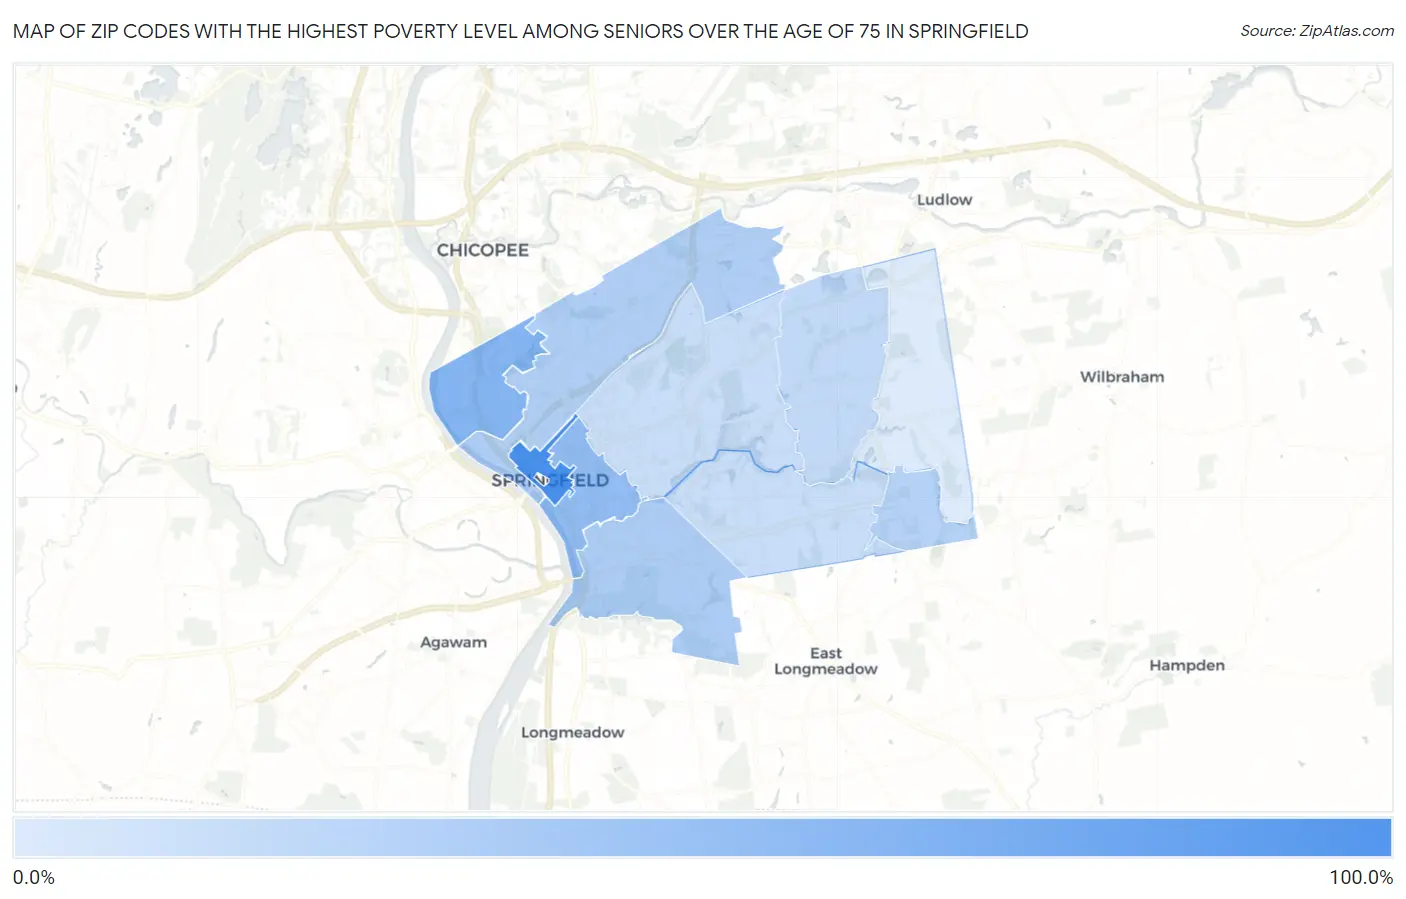
Zip Codes with the Highest Poverty Level Among Seniors Over the Age of 75 in Springfield, MA
RELATED REPORTS & OPTIONS
Highest Poverty | Seniors 75+
Springfield
Compare Zip Codes
Map of Zip Codes with the Highest Poverty Level Among Seniors Over the Age of 75 in Springfield
4.9%
86.3%
Zip Codes with the Highest Poverty Level Among Seniors Over the Age of 75 in Springfield, MA
| Zip Code | Senior Poverty | vs State | vs National | |
| 1. | 01103 | 86.3% | 11.8%(+74.5)#2 | 11.1%(+75.2)#272 |
| 2. | 01107 | 47.4% | 11.8%(+35.5)#11 | 11.1%(+36.3)#930 |
| 3. | 01105 | 40.0% | 11.8%(+28.2)#19 | 11.1%(+28.9)#1,300 |
| 4. | 01108 | 25.9% | 11.8%(+14.0)#36 | 11.1%(+14.8)#3,160 |
| 5. | 01104 | 25.0% | 11.8%(+13.1)#40 | 11.1%(+13.9)#3,437 |
| 6. | 01128 | 21.9% | 11.8%(+10.1)#54 | 11.1%(+10.9)#4,275 |
| 7. | 01119 | 17.1% | 11.8%(+5.30)#86 | 11.1%(+6.06)#6,526 |
| 8. | 01109 | 13.8% | 11.8%(+1.95)#136 | 11.1%(+2.71)#8,986 |
| 9. | 01118 | 13.7% | 11.8%(+1.83)#138 | 11.1%(+2.59)#9,092 |
| 10. | 01129 | 4.9% | 11.8%(-6.87)#358 | 11.1%(-6.12)#20,663 |
1
Common Questions
What are the Top 5 Zip Codes with the Highest Poverty Level Among Seniors Over the Age of 75 in Springfield, MA?
Top 5 Zip Codes with the Highest Poverty Level Among Seniors Over the Age of 75 in Springfield, MA are:
What zip code has the Highest Poverty Level Among Seniors Over the Age of 75 in Springfield, MA?
01103 has the Highest Poverty Level Among Seniors Over the Age of 75 in Springfield, MA with 86.3%.
What is the Poverty Level Among Seniors Over the Age of 75 in Springfield, MA?
Poverty Level Among Seniors Over the Age of 75 in Springfield is 22.2%.
What is the Poverty Level Among Seniors Over the Age of 75 in Massachusetts?
Poverty Level Among Seniors Over the Age of 75 in Massachusetts is 11.8%.
What is the Poverty Level Among Seniors Over the Age of 75 in the United States?
Poverty Level Among Seniors Over the Age of 75 in the United States is 11.1%.