Zip Codes with the Highest Percentage of Households with Income Above $100,000 in Springfield, MA
RELATED REPORTS & OPTIONS
Household Income | $100k+
Springfield
Compare Zip Codes
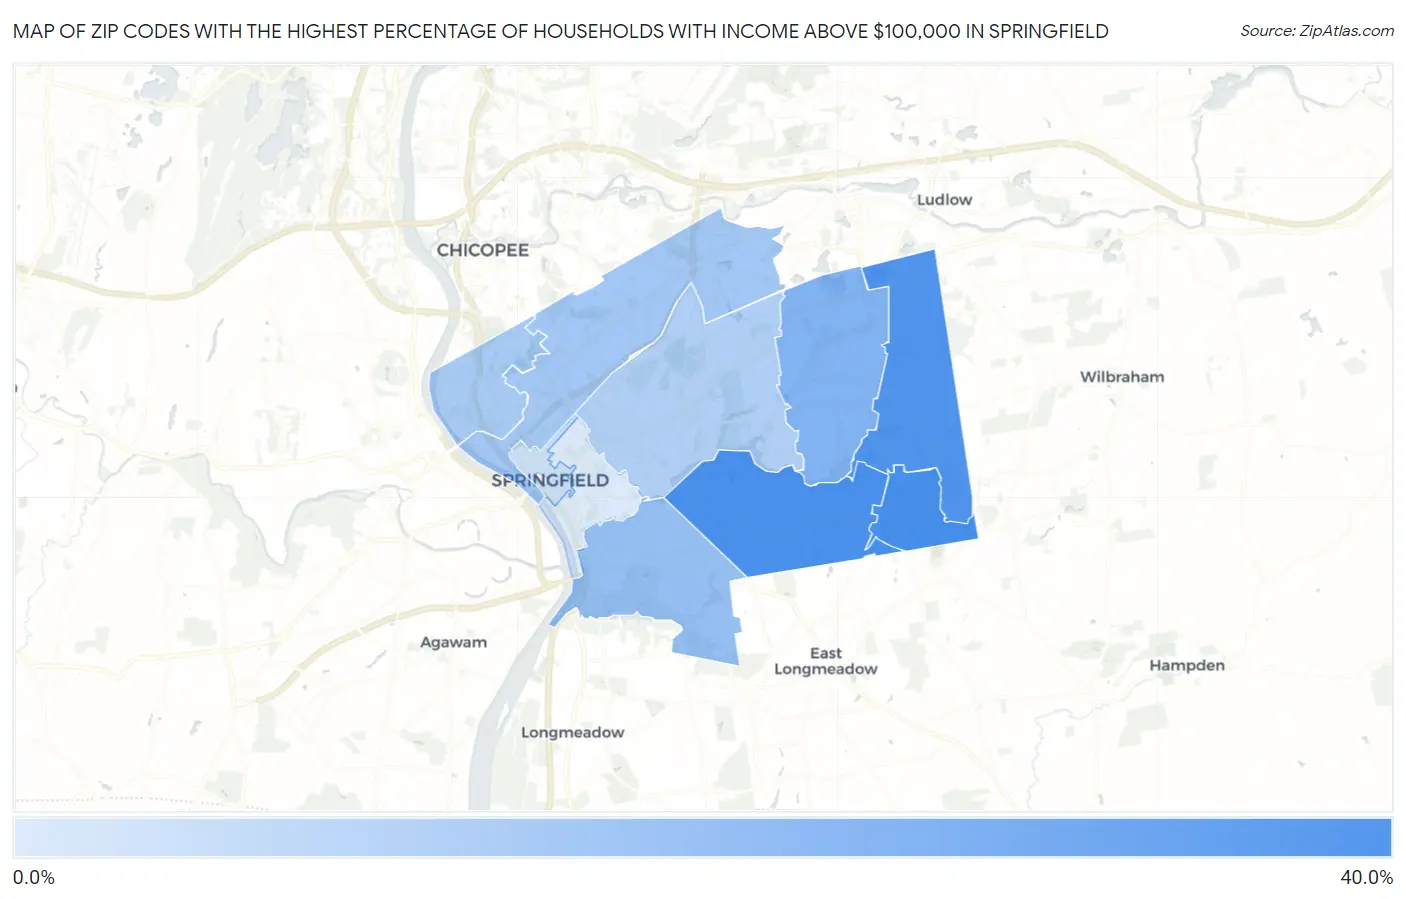
Map of Zip Codes with the Highest Percentage of Households with Income Above $100,000 in Springfield
8.6%
39.5%
Zip Codes with the Highest Percentage of Households with Income Above $100,000 in Springfield, MA
| Zip Code | Households with Income > $100k | vs State | vs National | |
| 1. | 01128 | 39.5% | 48.6%(-9.10)#385 | 37.3%(+2.20)#9,198 |
| 2. | 01118 | 39.1% | 48.6%(-9.50)#389 | 37.3%(+1.80)#9,375 |
| 3. | 01129 | 37.2% | 48.6%(-11.4)#408 | 37.3%(-0.100)#10,436 |
| 4. | 01119 | 26.7% | 48.6%(-21.9)#476 | 37.3%(-10.6)#18,239 |
| 5. | 01108 | 22.6% | 48.6%(-26.0)#497 | 37.3%(-14.7)#21,891 |
| 6. | 01104 | 19.6% | 48.6%(-29.0)#507 | 37.3%(-17.7)#24,349 |
| 7. | 01107 | 18.8% | 48.6%(-29.8)#510 | 37.3%(-18.5)#24,978 |
| 8. | 01109 | 16.9% | 48.6%(-31.7)#516 | 37.3%(-20.4)#26,291 |
| 9. | 01103 | 11.5% | 48.6%(-37.1)#520 | 37.3%(-25.8)#29,246 |
| 10. | 01105 | 8.6% | 48.6%(-40.0)#523 | 37.3%(-28.7)#30,262 |
1
Common Questions
What are the Top 5 Zip Codes with the Highest Percentage of Households with Income Above $100,000 in Springfield, MA?
Top 5 Zip Codes with the Highest Percentage of Households with Income Above $100,000 in Springfield, MA are:
What zip code has the Highest Percentage of Households with Income Above $100,000 in Springfield, MA?
01128 has the Highest Percentage of Households with Income Above $100,000 in Springfield, MA with 39.5%.
What is the Percentage of Households with Income Above $100,000 in Springfield, MA?
Percentage of Households with Income Above $100,000 in Springfield is 22.1%.
What is the Percentage of Households with Income Above $100,000 in Massachusetts?
Percentage of Households with Income Above $100,000 in Massachusetts is 48.6%.
What is the Percentage of Households with Income Above $100,000 in the United States?
Percentage of Households with Income Above $100,000 in the United States is 37.3%.