Zip Codes with the Highest Percentage of Households Without a Vehicle in Springfield, MA
RELATED REPORTS & OPTIONS
Households without a Cars
Springfield
Compare Zip Codes
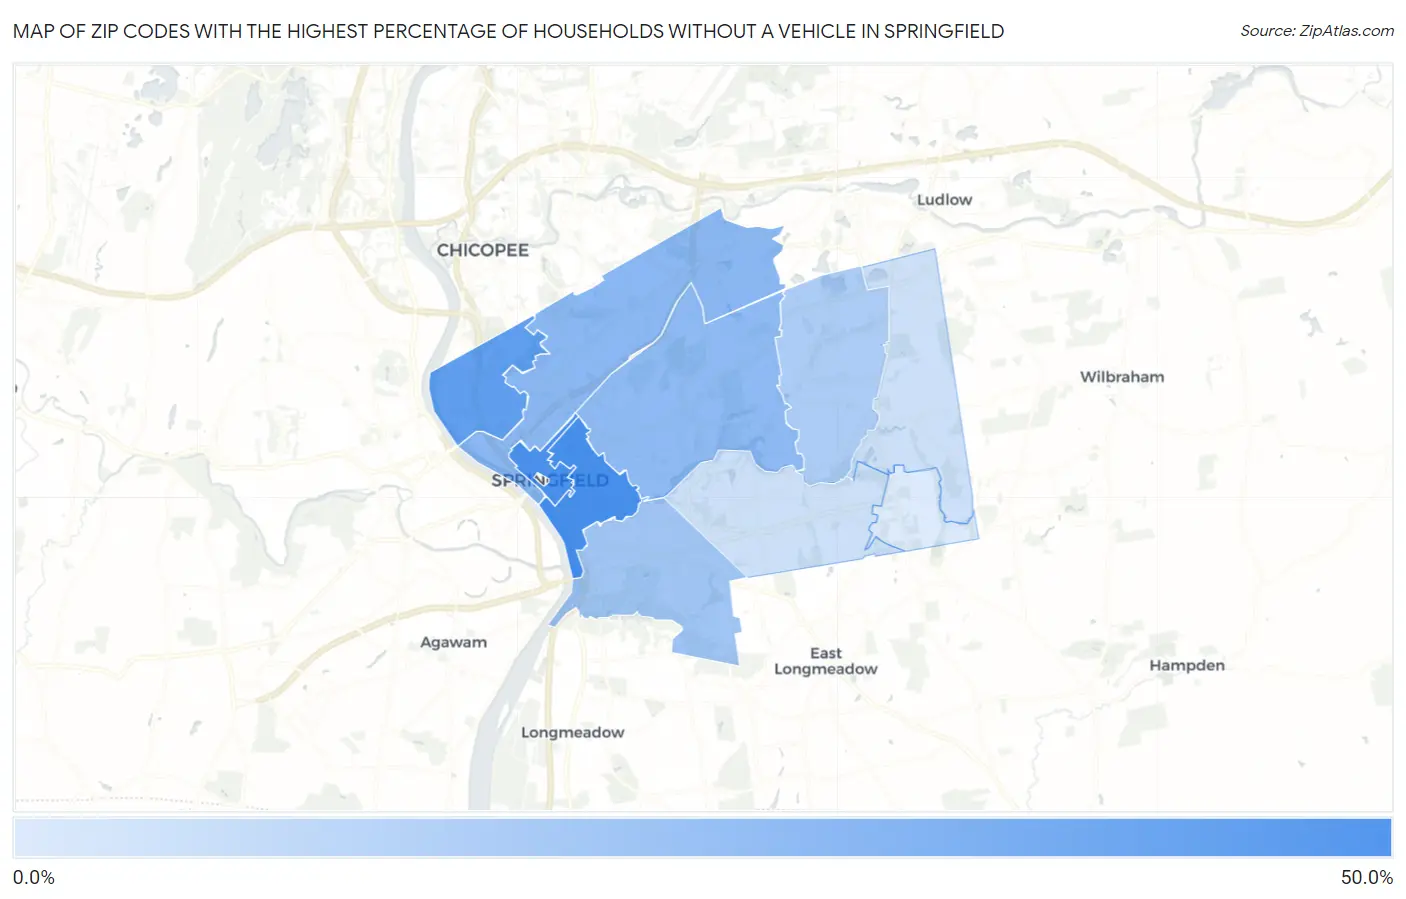
Map of Zip Codes with the Highest Percentage of Households Without a Vehicle in Springfield
1.7%
41.1%
Zip Codes with the Highest Percentage of Households Without a Vehicle in Springfield, MA
| Zip Code | Housholds Without a Car | vs State | vs National | |
| 1. | 01105 | 41.1% | 11.9%(+29.2)#18 | 8.3%(+32.8)#492 |
| 2. | 01103 | 40.2% | 11.9%(+28.3)#19 | 8.3%(+31.9)#508 |
| 3. | 01107 | 33.3% | 11.9%(+21.4)#28 | 8.3%(+25.0)#678 |
| 4. | 01104 | 22.2% | 11.9%(+10.3)#47 | 8.3%(+13.9)#1,282 |
| 5. | 01109 | 20.4% | 11.9%(+8.50)#53 | 8.3%(+12.1)#1,449 |
| 6. | 01108 | 16.2% | 11.9%(+4.30)#71 | 8.3%(+7.90)#2,105 |
| 7. | 01119 | 13.2% | 11.9%(+1.30)#91 | 8.3%(+4.90)#3,012 |
| 8. | 01118 | 5.5% | 11.9%(-6.40)#217 | 8.3%(-2.80)#11,662 |
| 9. | 01129 | 5.3% | 11.9%(-6.60)#229 | 8.3%(-3.00)#12,190 |
| 10. | 01128 | 1.7% | 11.9%(-10.2)#419 | 8.3%(-6.60)#23,580 |
1
Common Questions
What are the Top 5 Zip Codes with the Highest Percentage of Households Without a Vehicle in Springfield, MA?
Top 5 Zip Codes with the Highest Percentage of Households Without a Vehicle in Springfield, MA are:
What zip code has the Highest Percentage of Households Without a Vehicle in Springfield, MA?
01105 has the Highest Percentage of Households Without a Vehicle in Springfield, MA with 41.1%.
What is the Percentage of Households Without a Vehicle in Springfield, MA?
Percentage of Households Without a Vehicle in Springfield is 19.6%.
What is the Percentage of Households Without a Vehicle in Massachusetts?
Percentage of Households Without a Vehicle in Massachusetts is 11.9%.
What is the Percentage of Households Without a Vehicle in the United States?
Percentage of Households Without a Vehicle in the United States is 8.3%.