Zip Codes with the Highest Percentage of Population Taking Taxi / Cab to Work in Denham Springs, LA
RELATED REPORTS & OPTIONS
Taxi / Cab
Denham Springs
Compare Zip Codes
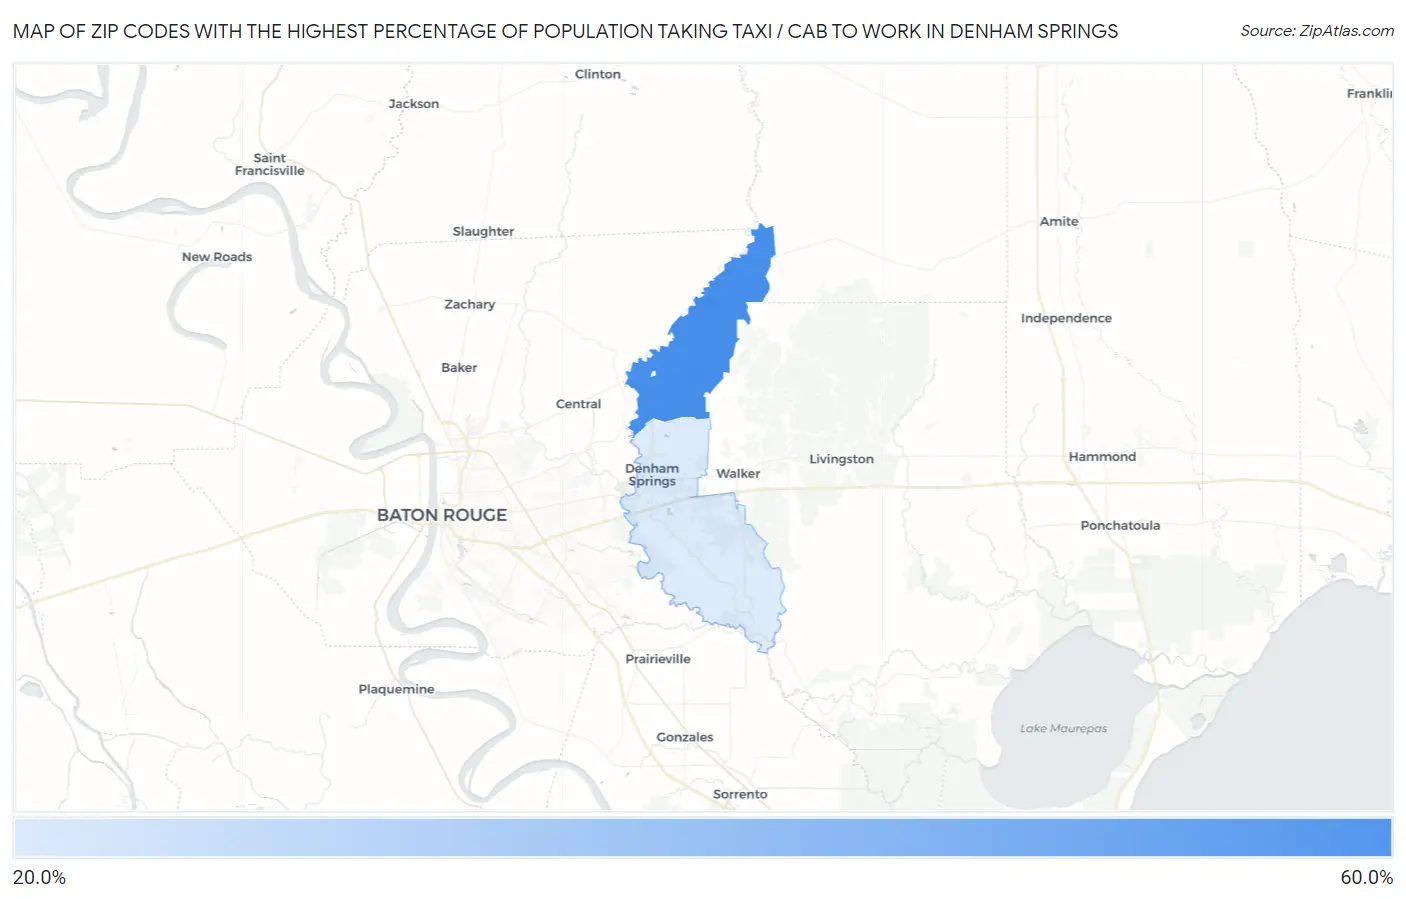
Map of Zip Codes with the Highest Percentage of Population Taking Taxi / Cab to Work in Denham Springs
23.0%
51.4%
Zip Codes with the Highest Percentage of Population Taking Taxi / Cab to Work in Denham Springs, LA
| Zip Code | % Take Taxi / Cab | vs State | vs National | |
| 1. | 70706 | 51.4% | 38.2%(+13.2)#33 | 38.2%(+13.2)#2,547 |
| 2. | 70726 | 23.0% | 38.2%(-15.2)#191 | 38.2%(-15.2)#12,607 |
1
Common Questions
What are the Top Zip Codes with the Highest Percentage of Population Taking Taxi / Cab to Work in Denham Springs, LA?
Top Zip Codes with the Highest Percentage of Population Taking Taxi / Cab to Work in Denham Springs, LA are:
What zip code has the Highest Percentage of Population Taking Taxi / Cab to Work in Denham Springs, LA?
70706 has the Highest Percentage of Population Taking Taxi / Cab to Work in Denham Springs, LA with 51.4%.
What is the Percentage of Population Taking Taxi / Cab to Work in Louisiana?
Percentage of Population Taking Taxi / Cab to Work in Louisiana is 38.2%.
What is the Percentage of Population Taking Taxi / Cab to Work in the United States?
Percentage of Population Taking Taxi / Cab to Work in the United States is 38.2%.