Zip Codes with the Highest Percentage of Population Employed in Security & Protection in Denham Springs, LA
RELATED REPORTS & OPTIONS
Security & Protection
Denham Springs
Compare Zip Codes
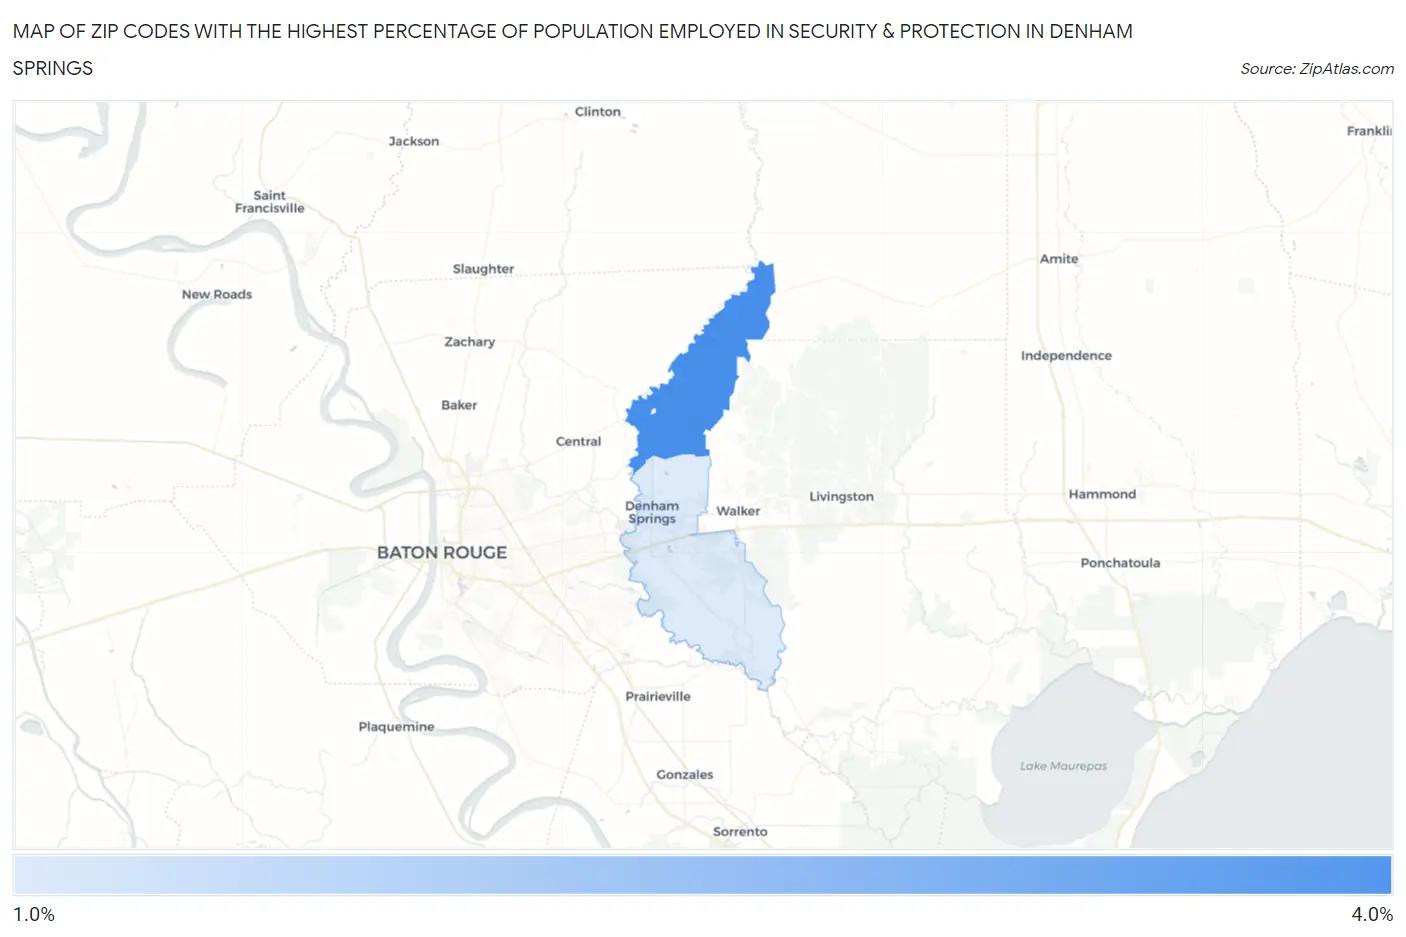
Map of Zip Codes with the Highest Percentage of Population Employed in Security & Protection in Denham Springs
1.2%
3.3%
Zip Codes with the Highest Percentage of Population Employed in Security & Protection in Denham Springs, LA
| Zip Code | % Employed | vs State | vs National | |
| 1. | 70706 | 3.3% | 2.6%(+0.710)#183 | 2.1%(+1.17)#6,189 |
| 2. | 70726 | 1.2% | 2.6%(-1.40)#340 | 2.1%(-0.945)#18,483 |
1
Common Questions
What are the Top Zip Codes with the Highest Percentage of Population Employed in Security & Protection in Denham Springs, LA?
Top Zip Codes with the Highest Percentage of Population Employed in Security & Protection in Denham Springs, LA are:
What zip code has the Highest Percentage of Population Employed in Security & Protection in Denham Springs, LA?
70706 has the Highest Percentage of Population Employed in Security & Protection in Denham Springs, LA with 3.3%.
What is the Percentage of Population Employed in Security & Protection in Denham Springs, LA?
Percentage of Population Employed in Security & Protection in Denham Springs is 1.9%.
What is the Percentage of Population Employed in Security & Protection in Louisiana?
Percentage of Population Employed in Security & Protection in Louisiana is 2.6%.
What is the Percentage of Population Employed in Security & Protection in the United States?
Percentage of Population Employed in Security & Protection in the United States is 2.1%.