Denham Springs, LA Map & Demographics
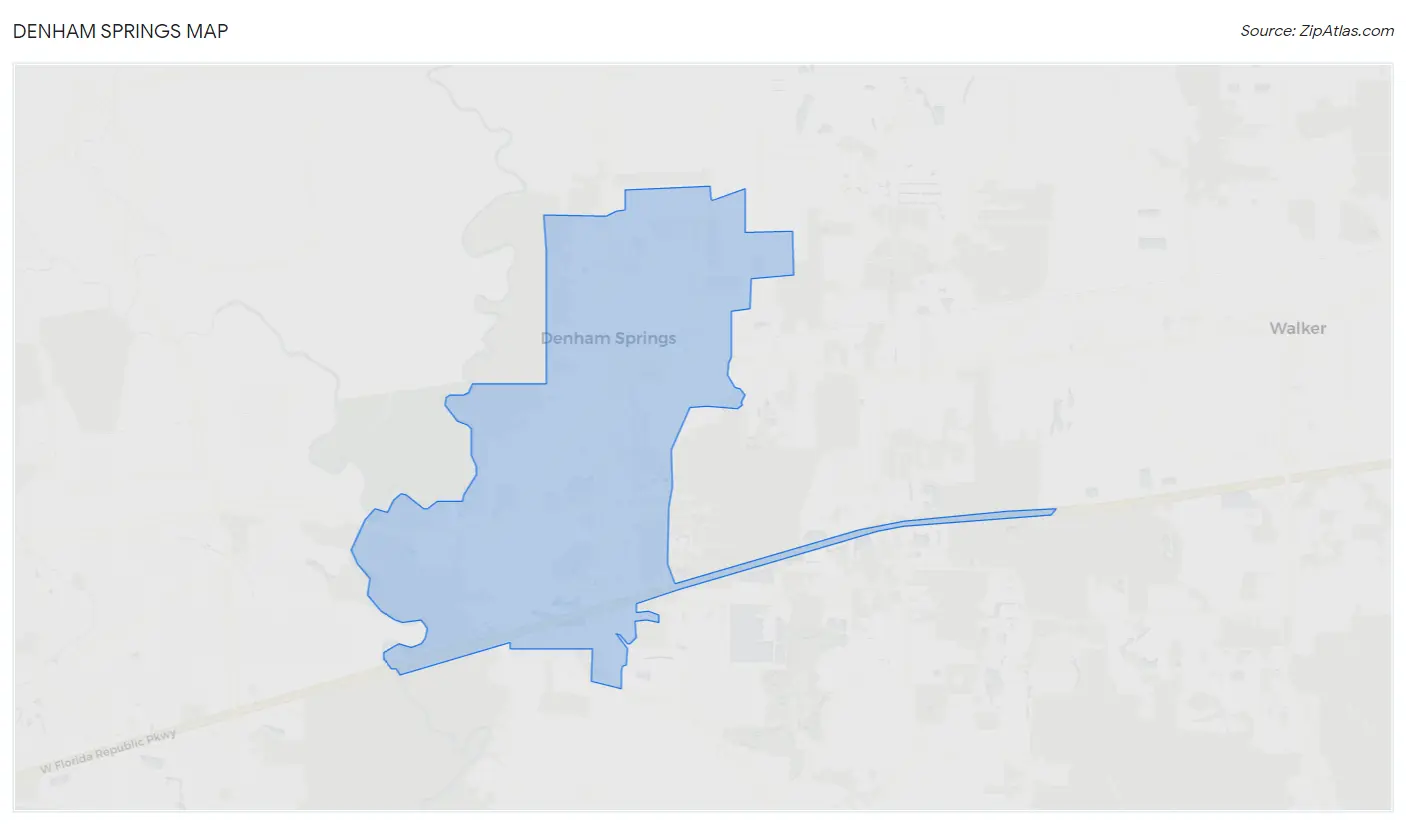
Denham Springs Map
Denham Springs Overview
$37,658
PER CAPITA INCOME
$105,297
AVG FAMILY INCOME
$85,625
AVG HOUSEHOLD INCOME
22.1%
WAGE / INCOME GAP [ % ]
77.9¢/ $1
WAGE / INCOME GAP [ $ ]
0.35
INEQUALITY / GINI INDEX
9,393
TOTAL POPULATION
4,419
MALE POPULATION
4,974
FEMALE POPULATION
88.84
MALES / 100 FEMALES
112.56
FEMALES / 100 MALES
36.7
MEDIAN AGE
3.3
AVG FAMILY SIZE
2.5
AVG HOUSEHOLD SIZE
4,731
LABOR FORCE [ PEOPLE ]
63.7%
PERCENT IN LABOR FORCE
7.4%
UNEMPLOYMENT RATE
Denham Springs Area Codes
Income in Denham Springs
Income Overview in Denham Springs
Per Capita Income in Denham Springs is $37,658, while median incomes of families and households are $105,297 and $85,625 respectively.
| Characteristic | Number | Measure |
| Per Capita Income | 9,393 | $37,658 |
| Median Family Income | 2,248 | $105,297 |
| Mean Family Income | 2,248 | $101,805 |
| Median Household Income | 3,674 | $85,625 |
| Mean Household Income | 3,674 | $88,186 |
| Income Deficit | 2,248 | $0 |
| Wage / Income Gap (%) | 9,393 | 22.14% |
| Wage / Income Gap ($) | 9,393 | 77.86¢ per $1 |
| Gini / Inequality Index | 9,393 | 0.35 |
Earnings by Sex in Denham Springs
Average Earnings in Denham Springs are $45,818, $51,680 for men and $40,238 for women, a difference of 22.1%.
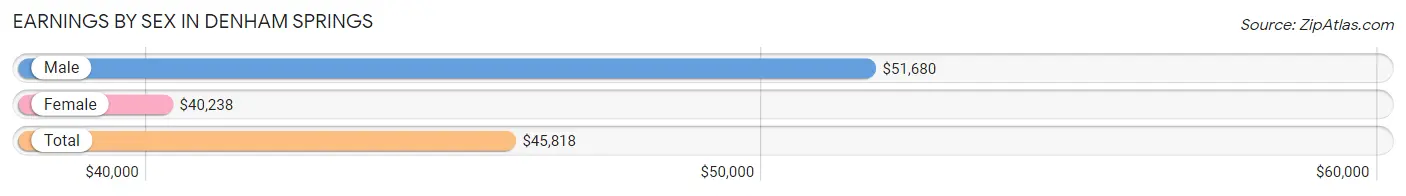
| Sex | Number | Average Earnings |
| Male | 2,638 (54.6%) | $51,680 |
| Female | 2,196 (45.4%) | $40,238 |
| Total | 4,834 (100.0%) | $45,818 |
Earnings by Sex by Income Bracket in Denham Springs
The most common earnings brackets in Denham Springs are $100,000+ for men (487 | 18.5%) and $100,000+ for women (249 | 11.3%).
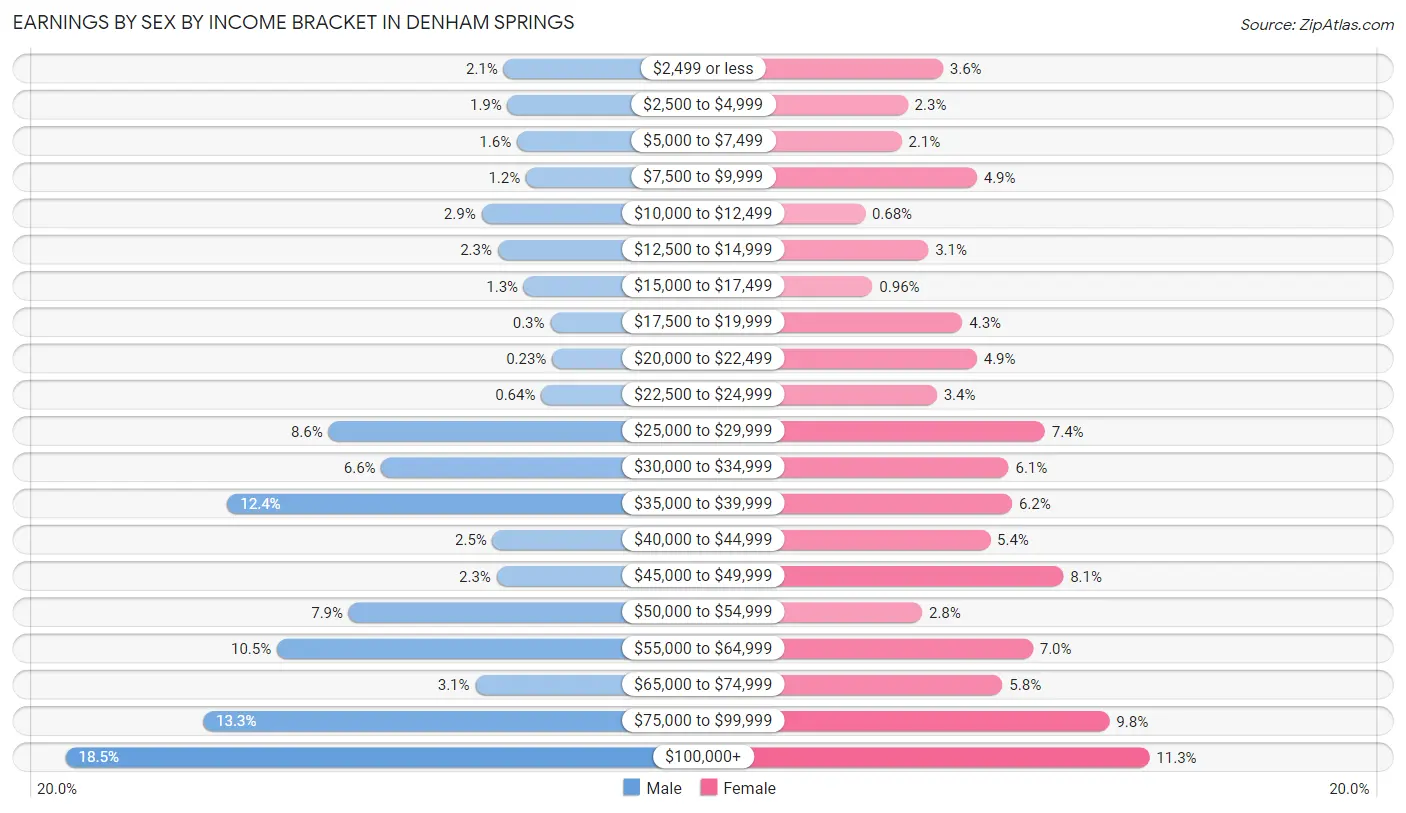
| Income | Male | Female |
| $2,499 or less | 54 (2.1%) | 79 (3.6%) |
| $2,500 to $4,999 | 50 (1.9%) | 50 (2.3%) |
| $5,000 to $7,499 | 41 (1.5%) | 45 (2.1%) |
| $7,500 to $9,999 | 32 (1.2%) | 107 (4.9%) |
| $10,000 to $12,499 | 76 (2.9%) | 15 (0.7%) |
| $12,500 to $14,999 | 60 (2.3%) | 67 (3.0%) |
| $15,000 to $17,499 | 34 (1.3%) | 21 (1.0%) |
| $17,500 to $19,999 | 8 (0.3%) | 95 (4.3%) |
| $20,000 to $22,499 | 6 (0.2%) | 107 (4.9%) |
| $22,500 to $24,999 | 17 (0.6%) | 74 (3.4%) |
| $25,000 to $29,999 | 227 (8.6%) | 163 (7.4%) |
| $30,000 to $34,999 | 175 (6.6%) | 133 (6.1%) |
| $35,000 to $39,999 | 327 (12.4%) | 136 (6.2%) |
| $40,000 to $44,999 | 65 (2.5%) | 118 (5.4%) |
| $45,000 to $49,999 | 61 (2.3%) | 178 (8.1%) |
| $50,000 to $54,999 | 207 (7.9%) | 62 (2.8%) |
| $55,000 to $64,999 | 278 (10.5%) | 153 (7.0%) |
| $65,000 to $74,999 | 82 (3.1%) | 128 (5.8%) |
| $75,000 to $99,999 | 351 (13.3%) | 216 (9.8%) |
| $100,000+ | 487 (18.5%) | 249 (11.3%) |
| Total | 2,638 (100.0%) | 2,196 (100.0%) |
Earnings by Sex by Educational Attainment in Denham Springs
Average earnings in Denham Springs are $52,366 for men and $41,310 for women, a difference of 21.1%. Men with an educational attainment of bachelor's degree enjoy the highest average annual earnings of $117,640, while those with college or associate's degree education earn the least with $39,670. Women with an educational attainment of graduate degree earn the most with the average annual earnings of $65,129, while those with high school diploma education have the smallest earnings of $23,567.
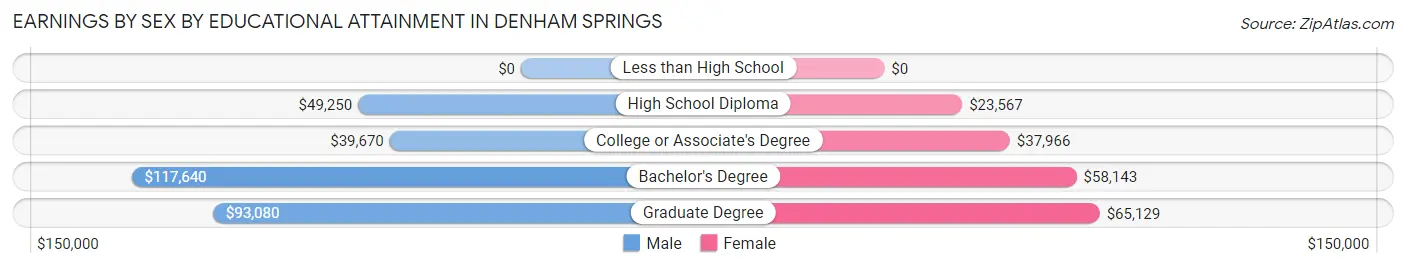
| Educational Attainment | Male Income | Female Income |
| Less than High School | - | - |
| High School Diploma | $49,250 | $23,567 |
| College or Associate's Degree | $39,670 | $37,966 |
| Bachelor's Degree | $117,640 | $58,143 |
| Graduate Degree | $93,080 | $65,129 |
| Total | $52,366 | $41,310 |
Family Income in Denham Springs
Family Income Brackets in Denham Springs
According to the Denham Springs family income data, there are 668 families falling into the $100,000 to $149,999 income range, which is the most common income bracket and makes up 29.7% of all families.
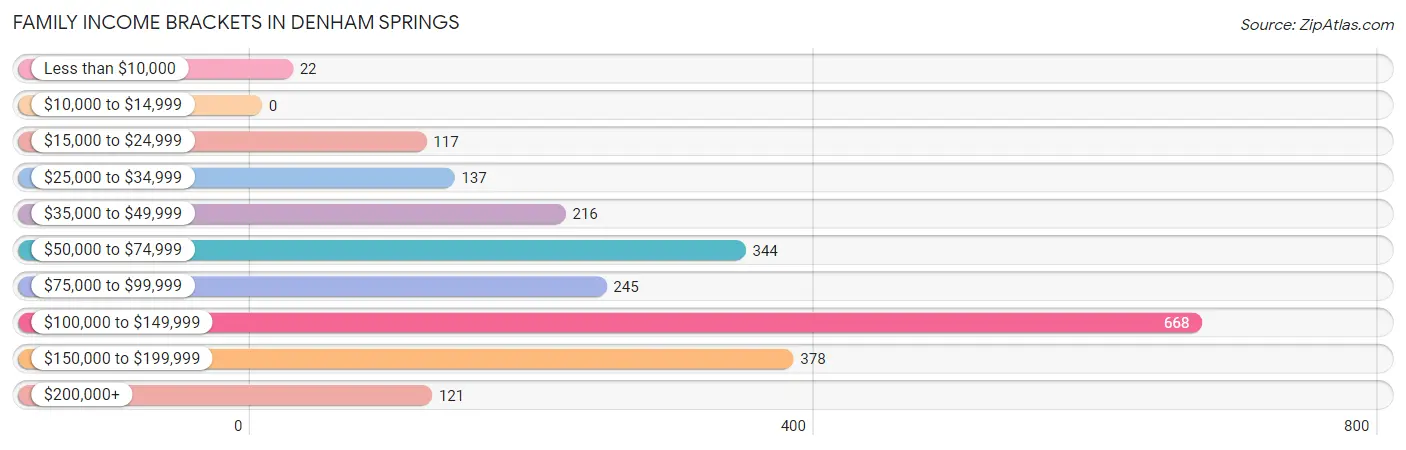
| Income Bracket | # Families | % Families |
| Less than $10,000 | 22 | 1.0% |
| $10,000 to $14,999 | 0 | 0.0% |
| $15,000 to $24,999 | 117 | 5.2% |
| $25,000 to $34,999 | 137 | 6.1% |
| $35,000 to $49,999 | 216 | 9.6% |
| $50,000 to $74,999 | 344 | 15.3% |
| $75,000 to $99,999 | 245 | 10.9% |
| $100,000 to $149,999 | 668 | 29.7% |
| $150,000 to $199,999 | 378 | 16.8% |
| $200,000+ | 121 | 5.4% |
Family Income by Famaliy Size in Denham Springs
5-person families (104 | 4.6%) account for the highest median family income in Denham Springs with $220,560 per family, while 5-person families (104 | 4.6%) have the highest median income of $44,112 per family member.
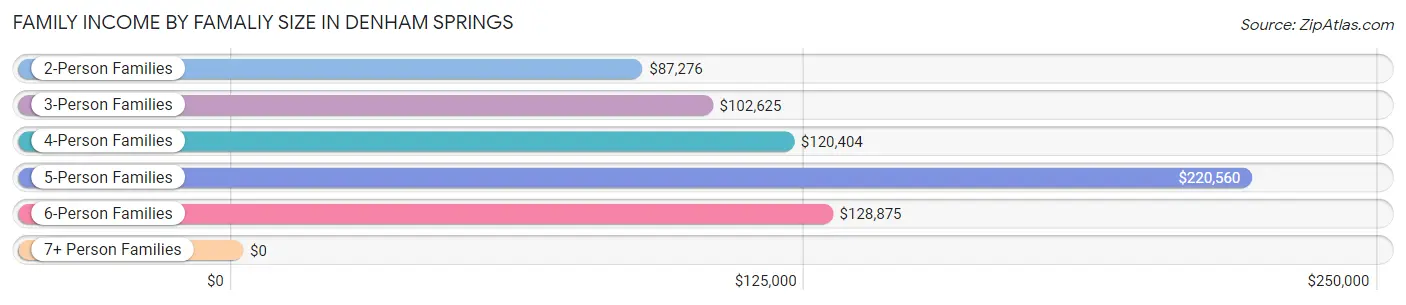
| Income Bracket | # Families | Median Income |
| 2-Person Families | 1,210 (53.8%) | $87,276 |
| 3-Person Families | 512 (22.8%) | $102,625 |
| 4-Person Families | 269 (12.0%) | $120,404 |
| 5-Person Families | 104 (4.6%) | $220,560 |
| 6-Person Families | 131 (5.8%) | $128,875 |
| 7+ Person Families | 22 (1.0%) | $0 |
| Total | 2,248 (100.0%) | $105,297 |
Family Income by Number of Earners in Denham Springs
The median family income in Denham Springs is $105,297, with families comprising 3+ earners (178) having the highest median family income of $220,448, while families with no earners (309) have the lowest median family income of $46,417, accounting for 7.9% and 13.8% of families, respectively.
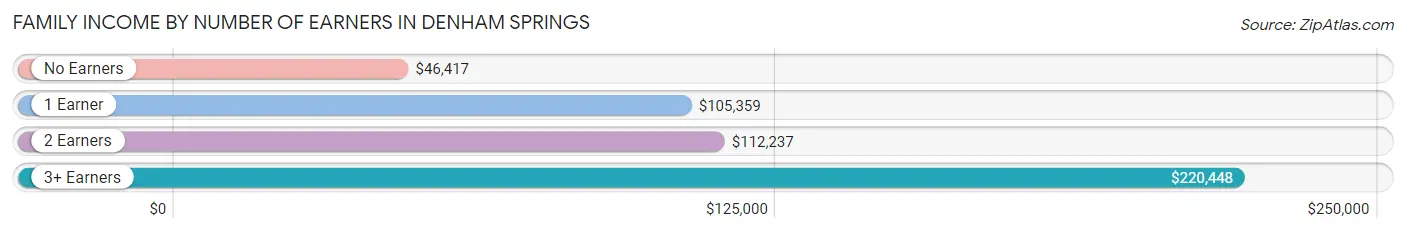
| Number of Earners | # Families | Median Income |
| No Earners | 309 (13.8%) | $46,417 |
| 1 Earner | 1,049 (46.7%) | $105,359 |
| 2 Earners | 712 (31.7%) | $112,237 |
| 3+ Earners | 178 (7.9%) | $220,448 |
| Total | 2,248 (100.0%) | $105,297 |
Household Income in Denham Springs
Household Income Brackets in Denham Springs
With 952 households falling in the category, the $100,000 to $149,999 income range is the most frequent in Denham Springs, accounting for 25.9% of all households. In contrast, only 55 households (1.5%) fall into the $10,000 to $14,999 income bracket, making it the least populous group.
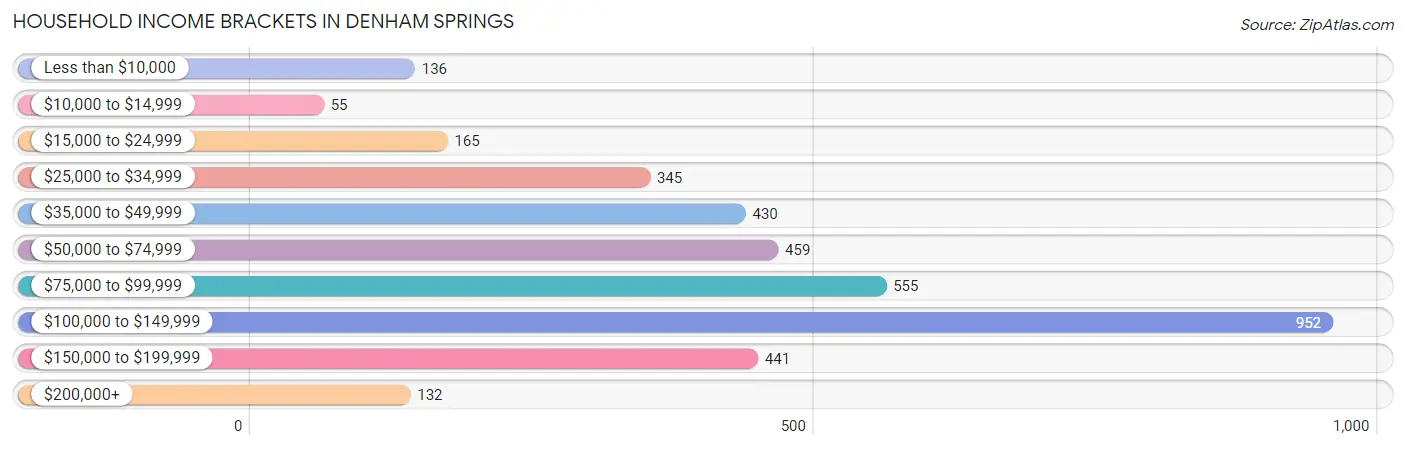
| Income Bracket | # Households | % Households |
| Less than $10,000 | 136 | 3.7% |
| $10,000 to $14,999 | 55 | 1.5% |
| $15,000 to $24,999 | 165 | 4.5% |
| $25,000 to $34,999 | 345 | 9.4% |
| $35,000 to $49,999 | 430 | 11.7% |
| $50,000 to $74,999 | 459 | 12.5% |
| $75,000 to $99,999 | 555 | 15.1% |
| $100,000 to $149,999 | 952 | 25.9% |
| $150,000 to $199,999 | 441 | 12.0% |
| $200,000+ | 132 | 3.6% |
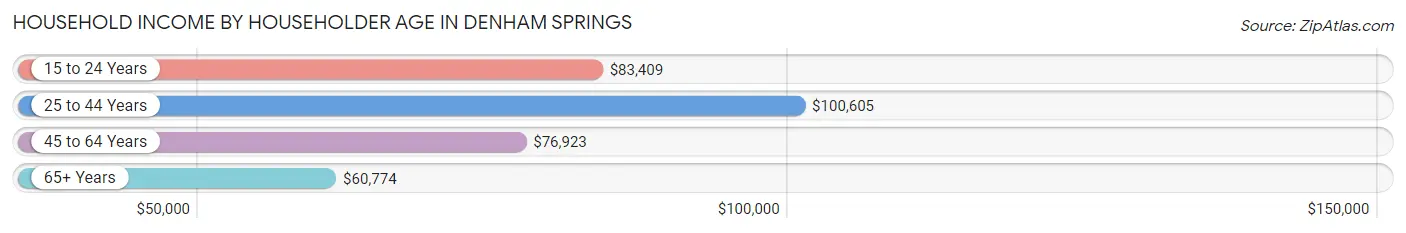
Household Income by Householder Age in Denham Springs
The median household income in Denham Springs is $85,625, with the highest median household income of $100,605 found in the 25 to 44 years age bracket for the primary householder. A total of 1,422 households (38.7%) fall into this category. Meanwhile, the 65+ years age bracket for the primary householder has the lowest median household income of $60,774, with 1,038 households (28.2%) in this group.
| Income Bracket | # Households | Median Income |
| 15 to 24 Years | 118 (3.2%) | $83,409 |
| 25 to 44 Years | 1,422 (38.7%) | $100,605 |
| 45 to 64 Years | 1,096 (29.8%) | $76,923 |
| 65+ Years | 1,038 (28.2%) | $60,774 |
| Total | 3,674 (100.0%) | $85,625 |
Poverty in Denham Springs
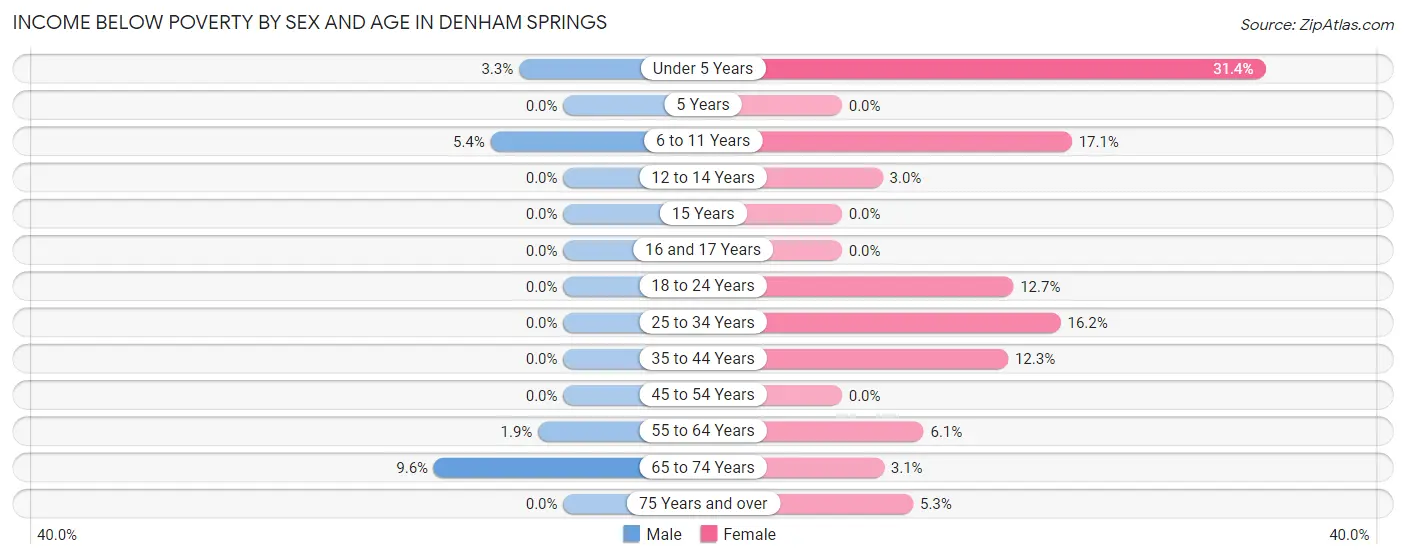
Income Below Poverty by Sex and Age in Denham Springs
With 1.7% poverty level for males and 9.4% for females among the residents of Denham Springs, 65 to 74 year old males and under 5 year old females are the most vulnerable to poverty, with 32 males (9.6%) and 61 females (31.4%) in their respective age groups living below the poverty level.
| Age Bracket | Male | Female |
| Under 5 Years | 11 (3.3%) | 61 (31.4%) |
| 5 Years | 0 (0.0%) | 0 (0.0%) |
| 6 to 11 Years | 19 (5.4%) | 70 (17.1%) |
| 12 to 14 Years | 0 (0.0%) | 11 (3.0%) |
| 15 Years | 0 (0.0%) | 0 (0.0%) |
| 16 and 17 Years | 0 (0.0%) | 0 (0.0%) |
| 18 to 24 Years | 0 (0.0%) | 42 (12.7%) |
| 25 to 34 Years | 0 (0.0%) | 113 (16.2%) |
| 35 to 44 Years | 0 (0.0%) | 86 (12.3%) |
| 45 to 54 Years | 0 (0.0%) | 0 (0.0%) |
| 55 to 64 Years | 11 (1.9%) | 34 (6.1%) |
| 65 to 74 Years | 32 (9.6%) | 23 (3.1%) |
| 75 Years and over | 0 (0.0%) | 19 (5.3%) |
| Total | 73 (1.7%) | 459 (9.4%) |
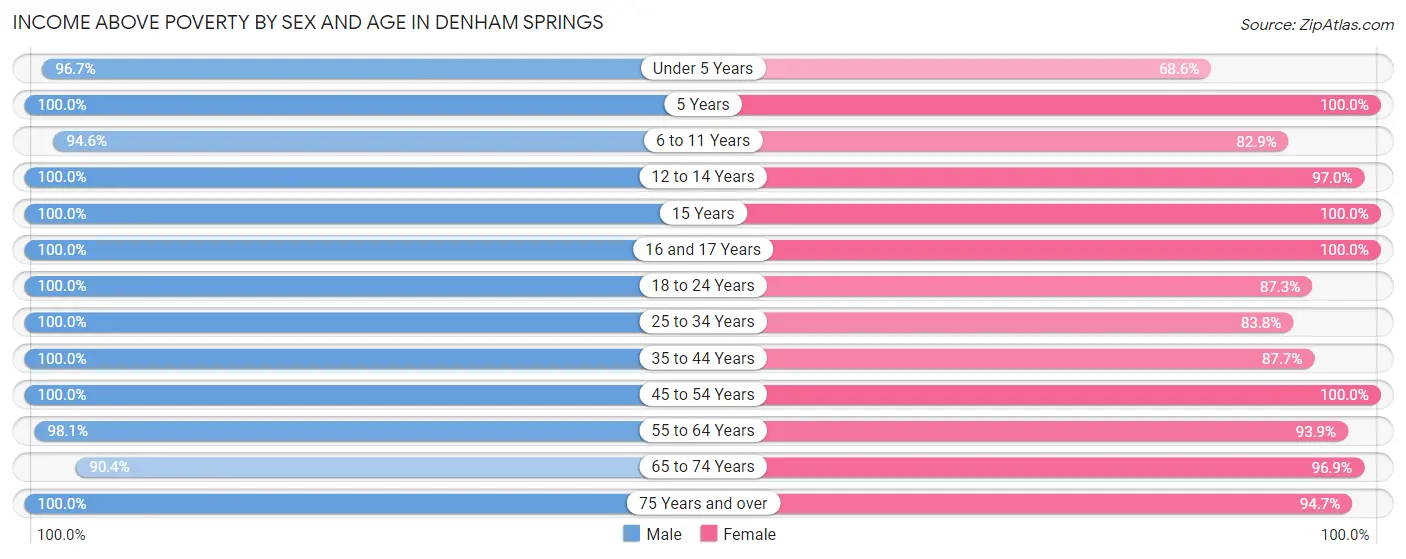
Income Above Poverty by Sex and Age in Denham Springs
According to the poverty statistics in Denham Springs, males aged 5 years and females aged 5 years are the age groups that are most secure financially, with 100.0% of males and 100.0% of females in these age groups living above the poverty line.
| Age Bracket | Male | Female |
| Under 5 Years | 323 (96.7%) | 133 (68.6%) |
| 5 Years | 49 (100.0%) | 10 (100.0%) |
| 6 to 11 Years | 333 (94.6%) | 340 (82.9%) |
| 12 to 14 Years | 93 (100.0%) | 352 (97.0%) |
| 15 Years | 77 (100.0%) | 70 (100.0%) |
| 16 and 17 Years | 68 (100.0%) | 57 (100.0%) |
| 18 to 24 Years | 508 (100.0%) | 288 (87.3%) |
| 25 to 34 Years | 654 (100.0%) | 583 (83.8%) |
| 35 to 44 Years | 469 (100.0%) | 611 (87.7%) |
| 45 to 54 Years | 451 (100.0%) | 381 (100.0%) |
| 55 to 64 Years | 577 (98.1%) | 526 (93.9%) |
| 65 to 74 Years | 301 (90.4%) | 714 (96.9%) |
| 75 Years and over | 378 (100.0%) | 340 (94.7%) |
| Total | 4,281 (98.3%) | 4,405 (90.6%) |
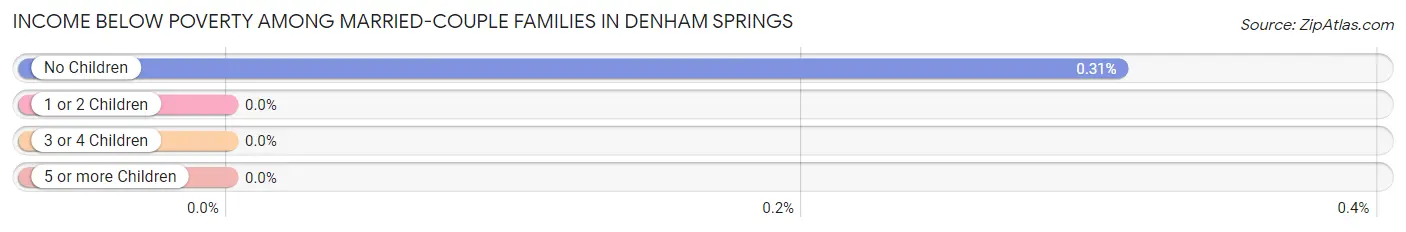
Income Below Poverty Among Married-Couple Families in Denham Springs
The poverty statistics for married-couple families in Denham Springs show that 0.2% or 3 of the total 1,521 families live below the poverty line. Families with no children have the highest poverty rate of 0.3%, comprising of 3 families. On the other hand, families with 1 or 2 children have the lowest poverty rate of 0.0%, which includes 0 families.
| Children | Above Poverty | Below Poverty |
| No Children | 967 (99.7%) | 3 (0.3%) |
| 1 or 2 Children | 390 (100.0%) | 0 (0.0%) |
| 3 or 4 Children | 149 (100.0%) | 0 (0.0%) |
| 5 or more Children | 12 (100.0%) | 0 (0.0%) |
| Total | 1,518 (99.8%) | 3 (0.2%) |
Income Below Poverty Among Single-Parent Households in Denham Springs
According to the poverty data in Denham Springs, 9.8% or 11 single-father households and 14.8% or 91 single-mother households are living below the poverty line. Among single-father households, those with no children have the highest poverty rate, with 11 households (12.4%) experiencing poverty. Likewise, among single-mother households, those with 3 or 4 children have the highest poverty rate, with 40 households (100.0%) falling below the poverty line.
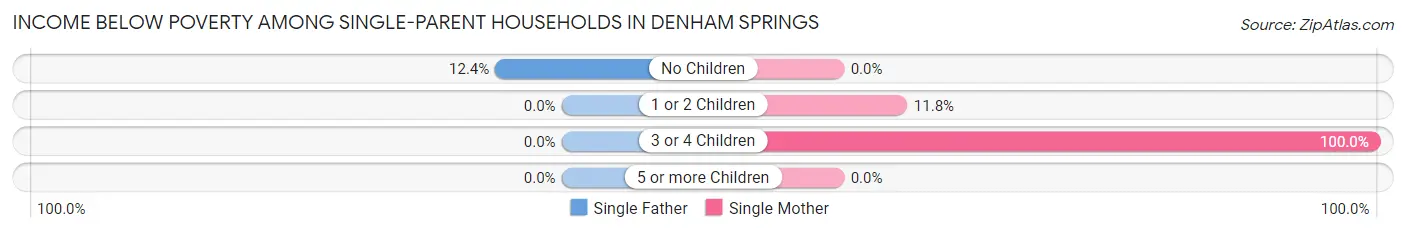
| Children | Single Father | Single Mother |
| No Children | 11 (12.4%) | 0 (0.0%) |
| 1 or 2 Children | 0 (0.0%) | 51 (11.8%) |
| 3 or 4 Children | 0 (0.0%) | 40 (100.0%) |
| 5 or more Children | 0 (0.0%) | 0 (0.0%) |
| Total | 11 (9.8%) | 91 (14.8%) |
Income Below Poverty Among Married-Couple vs Single-Parent Households in Denham Springs
The poverty data for Denham Springs shows that 3 of the married-couple family households (0.2%) and 102 of the single-parent households (14.0%) are living below the poverty level. Within the married-couple family households, those with no children have the highest poverty rate, with 3 households (0.3%) falling below the poverty line. Among the single-parent households, those with 3 or 4 children have the highest poverty rate, with 40 household (100.0%) living below poverty.
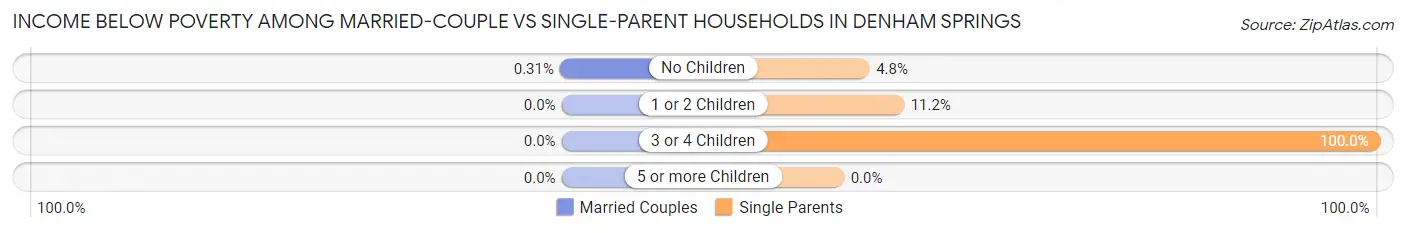
| Children | Married-Couple Families | Single-Parent Households |
| No Children | 3 (0.3%) | 11 (4.8%) |
| 1 or 2 Children | 0 (0.0%) | 51 (11.2%) |
| 3 or 4 Children | 0 (0.0%) | 40 (100.0%) |
| 5 or more Children | 0 (0.0%) | 0 (0.0%) |
| Total | 3 (0.2%) | 102 (14.0%) |
Race in Denham Springs
The most populous races in Denham Springs are White / Caucasian (7,254 | 77.2%), Black / African American (1,191 | 12.7%), and Hispanic or Latino (872 | 9.3%).
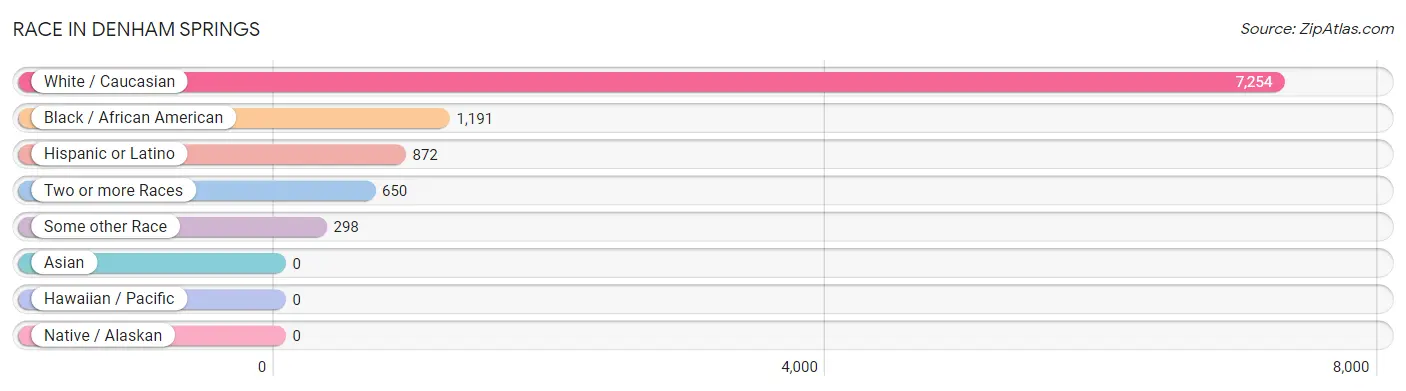
| Race | # Population | % Population |
| Asian | 0 | 0.0% |
| Black / African American | 1,191 | 12.7% |
| Hawaiian / Pacific | 0 | 0.0% |
| Hispanic or Latino | 872 | 9.3% |
| Native / Alaskan | 0 | 0.0% |
| White / Caucasian | 7,254 | 77.2% |
| Two or more Races | 650 | 6.9% |
| Some other Race | 298 | 3.2% |
| Total | 9,393 | 100.0% |
Ancestry in Denham Springs
The most populous ancestries reported in Denham Springs are Irish (1,217 | 13.0%), English (1,024 | 10.9%), French (785 | 8.4%), American (746 | 7.9%), and German (653 | 7.0%), together accounting for 47.1% of all Denham Springs residents.
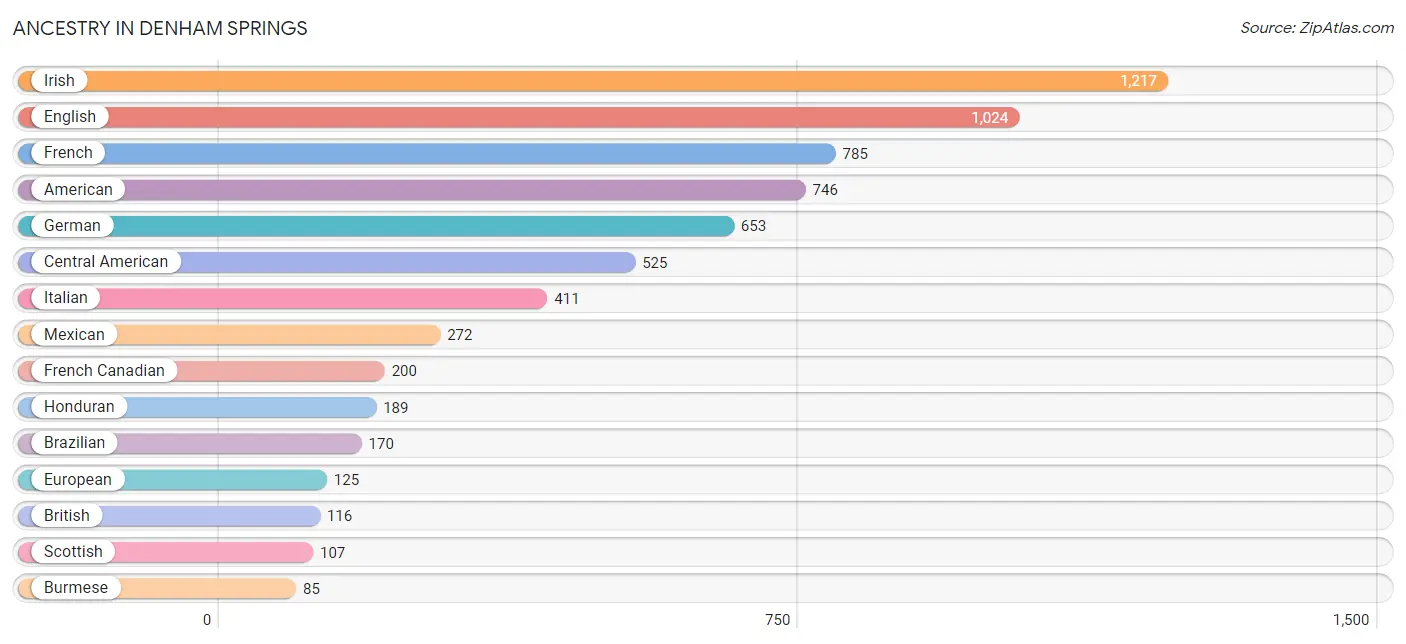
| Ancestry | # Population | % Population |
| African | 35 | 0.4% |
| American | 746 | 7.9% |
| Brazilian | 170 | 1.8% |
| British | 116 | 1.2% |
| Burmese | 85 | 0.9% |
| Cajun | 43 | 0.5% |
| Central American | 525 | 5.6% |
| Cuban | 18 | 0.2% |
| Dutch | 47 | 0.5% |
| Eastern European | 77 | 0.8% |
| English | 1,024 | 10.9% |
| European | 125 | 1.3% |
| French | 785 | 8.4% |
| French Canadian | 200 | 2.1% |
| German | 653 | 7.0% |
| Honduran | 189 | 2.0% |
| Iranian | 70 | 0.7% |
| Irish | 1,217 | 13.0% |
| Italian | 411 | 4.4% |
| Lithuanian | 7 | 0.1% |
| Mexican | 272 | 2.9% |
| Northern European | 13 | 0.1% |
| Norwegian | 26 | 0.3% |
| Polish | 5 | 0.1% |
| Portuguese | 15 | 0.2% |
| Salvadoran | 31 | 0.3% |
| Scotch-Irish | 73 | 0.8% |
| Scottish | 107 | 1.1% |
| Spaniard | 26 | 0.3% |
| Spanish | 31 | 0.3% |
| Subsaharan African | 35 | 0.4% |
| Ukrainian | 4 | 0.0% |
| Welsh | 28 | 0.3% |
| West Indian | 34 | 0.4% | View All 34 Rows |
Immigrants in Denham Springs
The most numerous immigrant groups reported in Denham Springs came from Latin America (743 | 7.9%), Central America (573 | 6.1%), Honduras (173 | 1.8%), Brazil (170 | 1.8%), and South America (170 | 1.8%), together accounting for 19.5% of all Denham Springs residents.
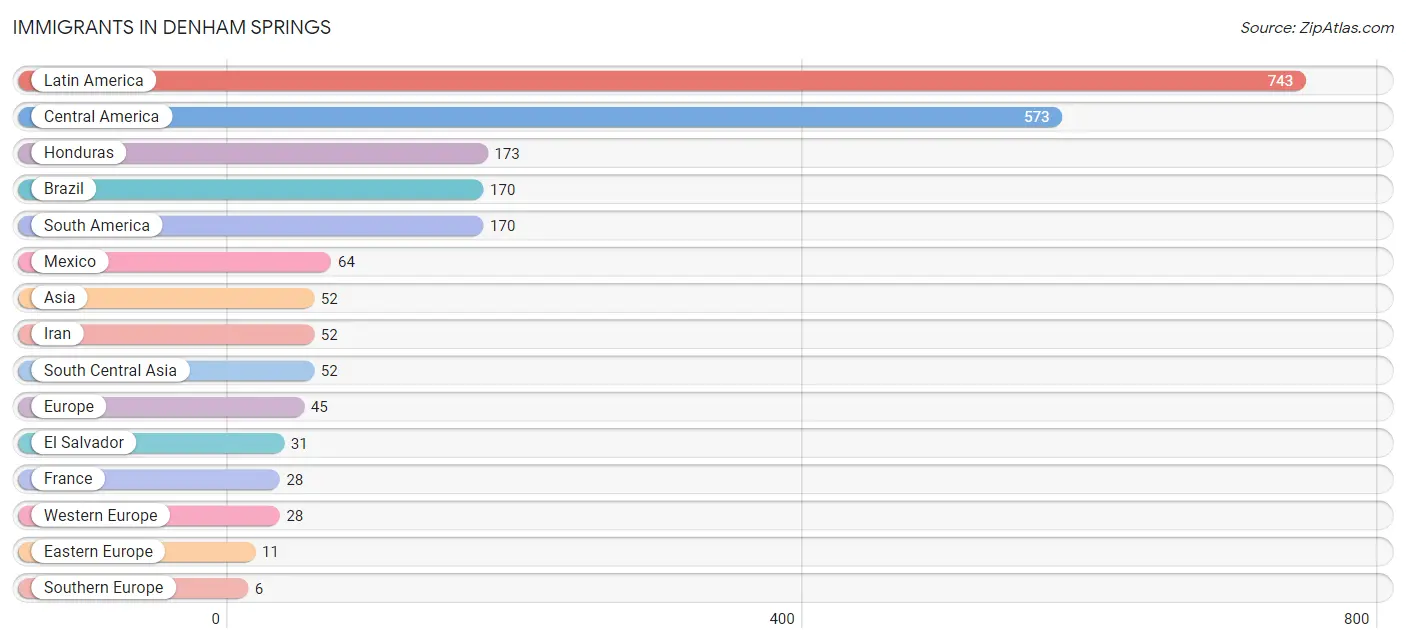
| Immigration Origin | # Population | % Population |
| Asia | 52 | 0.5% |
| Brazil | 170 | 1.8% |
| Central America | 573 | 6.1% |
| Eastern Europe | 11 | 0.1% |
| El Salvador | 31 | 0.3% |
| Europe | 45 | 0.5% |
| France | 28 | 0.3% |
| Honduras | 173 | 1.8% |
| Iran | 52 | 0.5% |
| Latin America | 743 | 7.9% |
| Lithuania | 3 | 0.0% |
| Mexico | 64 | 0.7% |
| South America | 170 | 1.8% |
| South Central Asia | 52 | 0.5% |
| Southern Europe | 6 | 0.1% |
| Spain | 6 | 0.1% |
| Western Europe | 28 | 0.3% | View All 17 Rows |
Sex and Age in Denham Springs
Sex and Age in Denham Springs
The most populous age groups in Denham Springs are 20 to 24 Years (471 | 10.7%) for men and 10 to 14 Years (642 | 12.9%) for women.
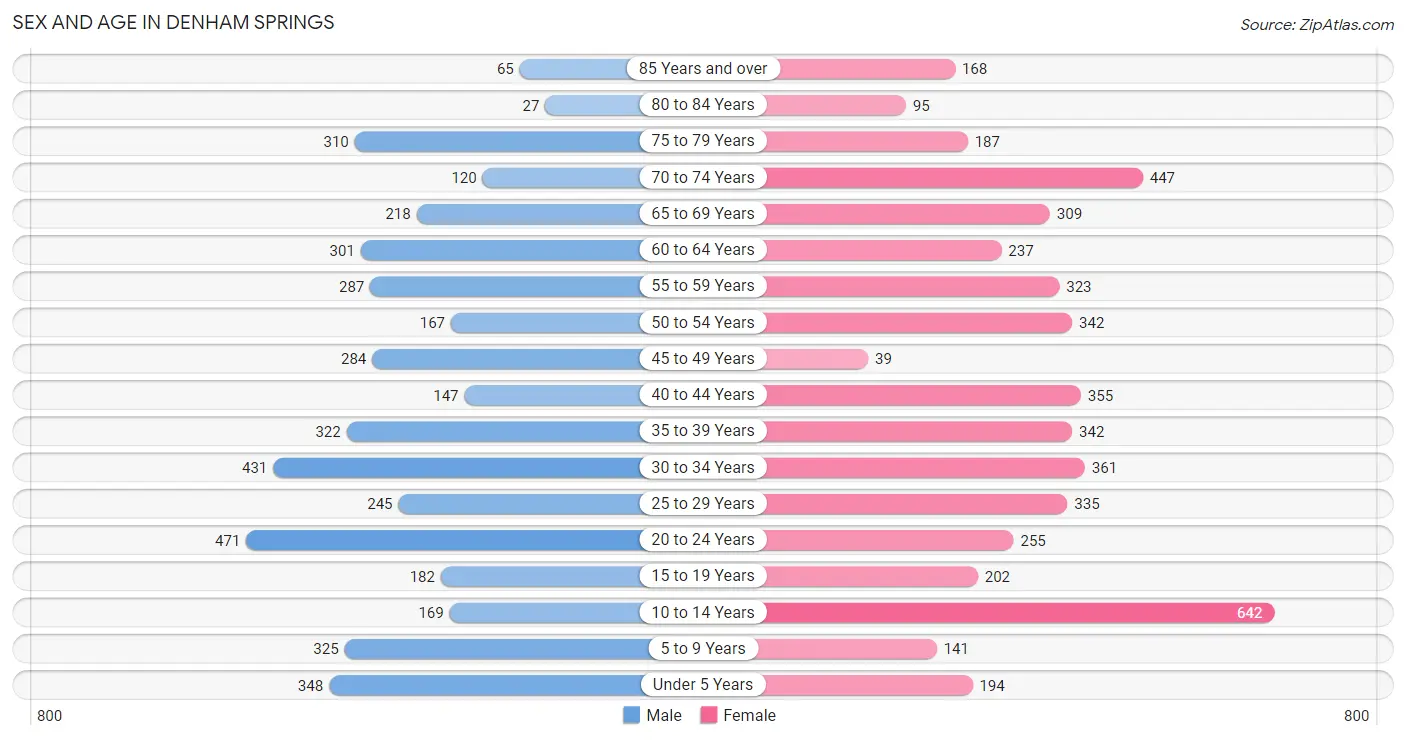
| Age Bracket | Male | Female |
| Under 5 Years | 348 (7.9%) | 194 (3.9%) |
| 5 to 9 Years | 325 (7.3%) | 141 (2.8%) |
| 10 to 14 Years | 169 (3.8%) | 642 (12.9%) |
| 15 to 19 Years | 182 (4.1%) | 202 (4.1%) |
| 20 to 24 Years | 471 (10.7%) | 255 (5.1%) |
| 25 to 29 Years | 245 (5.5%) | 335 (6.7%) |
| 30 to 34 Years | 431 (9.8%) | 361 (7.3%) |
| 35 to 39 Years | 322 (7.3%) | 342 (6.9%) |
| 40 to 44 Years | 147 (3.3%) | 355 (7.1%) |
| 45 to 49 Years | 284 (6.4%) | 39 (0.8%) |
| 50 to 54 Years | 167 (3.8%) | 342 (6.9%) |
| 55 to 59 Years | 287 (6.5%) | 323 (6.5%) |
| 60 to 64 Years | 301 (6.8%) | 237 (4.8%) |
| 65 to 69 Years | 218 (4.9%) | 309 (6.2%) |
| 70 to 74 Years | 120 (2.7%) | 447 (9.0%) |
| 75 to 79 Years | 310 (7.0%) | 187 (3.8%) |
| 80 to 84 Years | 27 (0.6%) | 95 (1.9%) |
| 85 Years and over | 65 (1.5%) | 168 (3.4%) |
| Total | 4,419 (100.0%) | 4,974 (100.0%) |
Families and Households in Denham Springs
Median Family Size in Denham Springs
The median family size in Denham Springs is 3.29 persons per family, with married-couple families (1,521 | 67.7%) accounting for the largest median family size of 3.48 persons per family. On the other hand, single male/father families (112 | 5.0%) represent the smallest median family size with 2.79 persons per family.
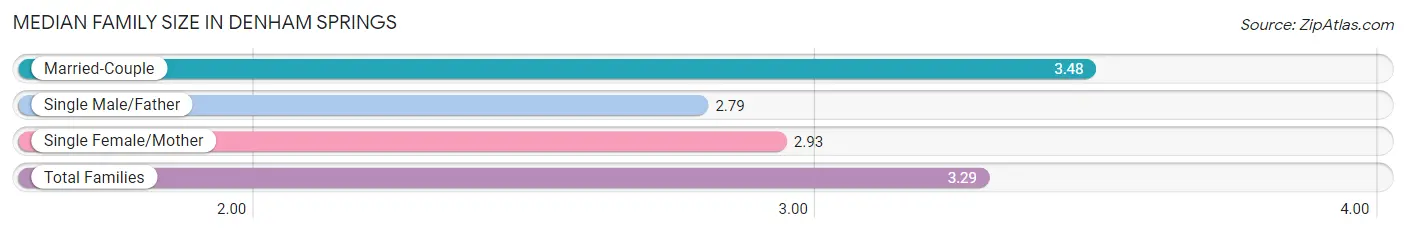
| Family Type | # Families | Family Size |
| Married-Couple | 1,521 (67.7%) | 3.48 |
| Single Male/Father | 112 (5.0%) | 2.79 |
| Single Female/Mother | 615 (27.4%) | 2.93 |
| Total Families | 2,248 (100.0%) | 3.29 |
Median Household Size in Denham Springs
The median household size in Denham Springs is 2.51 persons per household, with married-couple households (1,521 | 41.4%) accounting for the largest median household size of 3.51 persons per household. non-family households (1,426 | 38.8%) represent the smallest median household size with 1.17 persons per household.
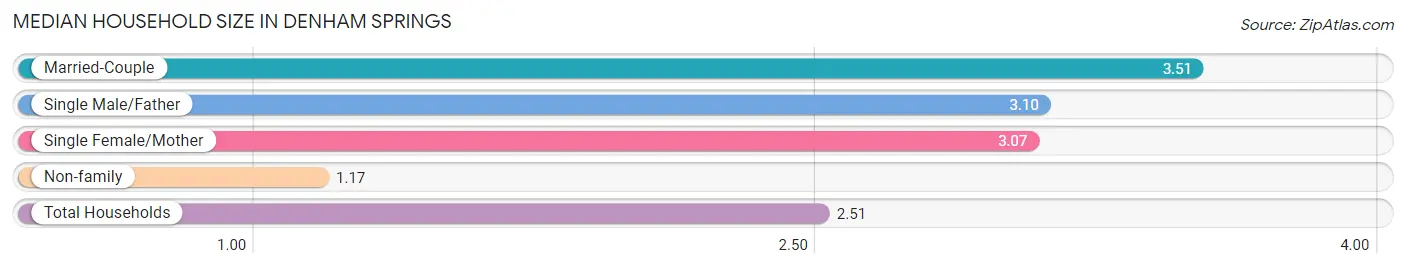
| Household Type | # Households | Household Size |
| Married-Couple | 1,521 (41.4%) | 3.51 |
| Single Male/Father | 112 (3.0%) | 3.10 |
| Single Female/Mother | 615 (16.7%) | 3.07 |
| Non-family | 1,426 (38.8%) | 1.17 |
| Total Households | 3,674 (100.0%) | 2.51 |
Household Size by Marriage Status in Denham Springs
Out of a total of 3,674 households in Denham Springs, 2,248 (61.2%) are family households, while 1,426 (38.8%) are nonfamily households. The most numerous type of family households are 2-person households, comprising 1,112, and the most common type of nonfamily households are 1-person households, comprising 1,221.
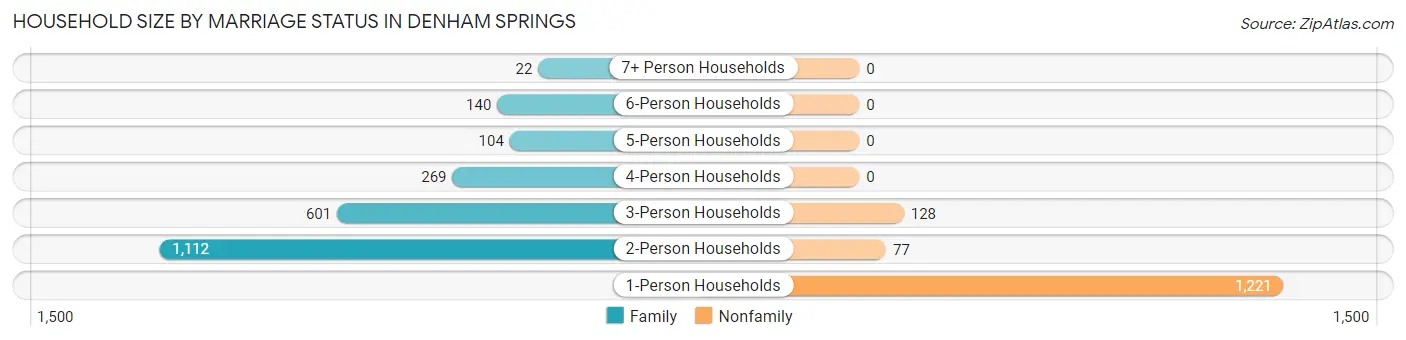
| Household Size | Family Households | Nonfamily Households |
| 1-Person Households | - | 1,221 (33.2%) |
| 2-Person Households | 1,112 (30.3%) | 77 (2.1%) |
| 3-Person Households | 601 (16.4%) | 128 (3.5%) |
| 4-Person Households | 269 (7.3%) | 0 (0.0%) |
| 5-Person Households | 104 (2.8%) | 0 (0.0%) |
| 6-Person Households | 140 (3.8%) | 0 (0.0%) |
| 7+ Person Households | 22 (0.6%) | 0 (0.0%) |
| Total | 2,248 (61.2%) | 1,426 (38.8%) |
Female Fertility in Denham Springs
Fertility by Age in Denham Springs
Average fertility rate in Denham Springs is 22.0 births per 1,000 women. Women in the age bracket of 20 to 34 years have the highest fertility rate with 25.0 births per 1,000 women. Women in the age bracket of 20 to 34 years acount for 57.1% of all women with births.
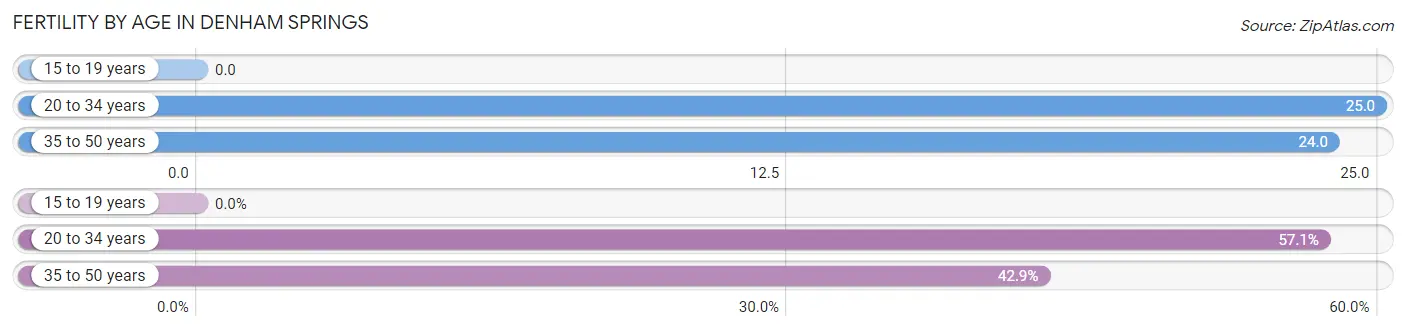
| Age Bracket | Women with Births | Births / 1,000 Women |
| 15 to 19 years | 0 (0.0%) | 0.0 |
| 20 to 34 years | 24 (57.1%) | 25.0 |
| 35 to 50 years | 18 (42.9%) | 24.0 |
| Total | 42 (100.0%) | 22.0 |
Fertility by Age by Marriage Status in Denham Springs
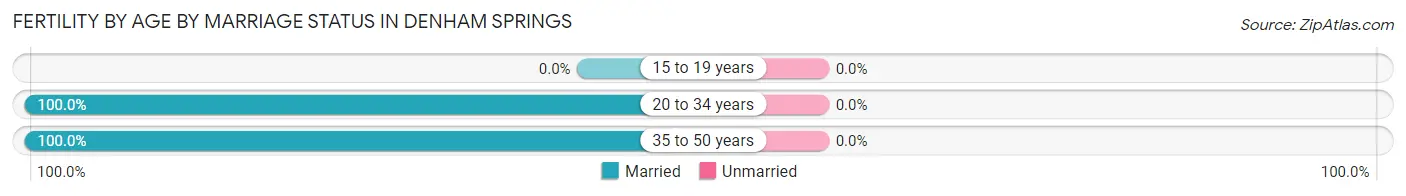
| Age Bracket | Married | Unmarried |
| 15 to 19 years | 0 (0.0%) | 0 (0.0%) |
| 20 to 34 years | 24 (100.0%) | 0 (0.0%) |
| 35 to 50 years | 18 (100.0%) | 0 (0.0%) |
| Total | 42 (100.0%) | 0 (0.0%) |
Fertility by Education in Denham Springs
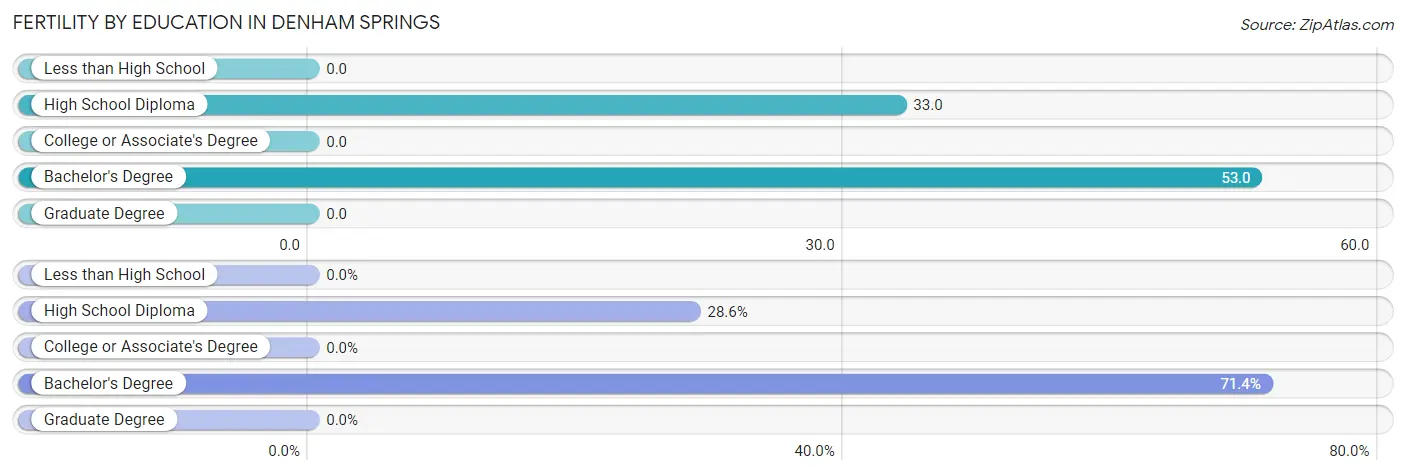
| Educational Attainment | Women with Births | Births / 1,000 Women |
| Less than High School | 0 (0.0%) | 0.0 |
| High School Diploma | 12 (28.6%) | 33.0 |
| College or Associate's Degree | 0 (0.0%) | 0.0 |
| Bachelor's Degree | 30 (71.4%) | 53.0 |
| Graduate Degree | 0 (0.0%) | 0.0 |
| Total | 42 (100.0%) | 22.0 |
Fertility by Education by Marriage Status in Denham Springs
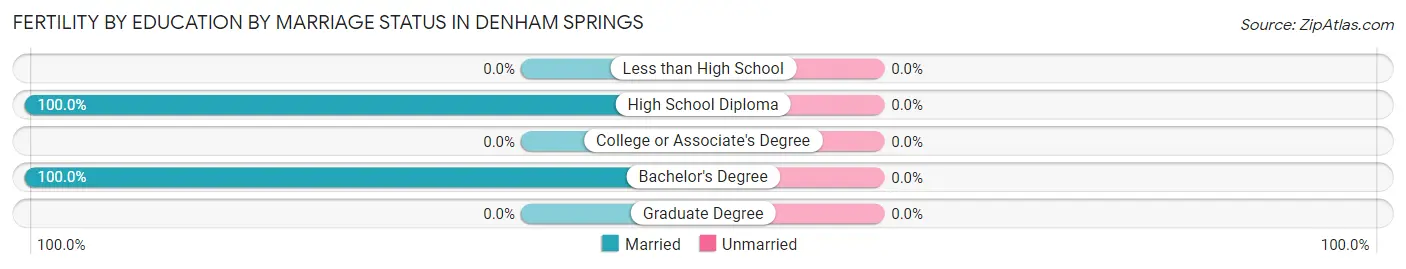
| Educational Attainment | Married | Unmarried |
| Less than High School | 0 (0.0%) | 0 (0.0%) |
| High School Diploma | 12 (100.0%) | 0 (0.0%) |
| College or Associate's Degree | 0 (0.0%) | 0 (0.0%) |
| Bachelor's Degree | 30 (100.0%) | 0 (0.0%) |
| Graduate Degree | 0 (0.0%) | 0 (0.0%) |
| Total | 42 (100.0%) | 0 (0.0%) |
Employment Characteristics in Denham Springs
Employment by Class of Employer in Denham Springs
Among the 4,369 employed individuals in Denham Springs, private company employees (2,353 | 53.9%), self-employed (not incorporated) (840 | 19.2%), and state government employees (446 | 10.2%) make up the most common classes of employment.
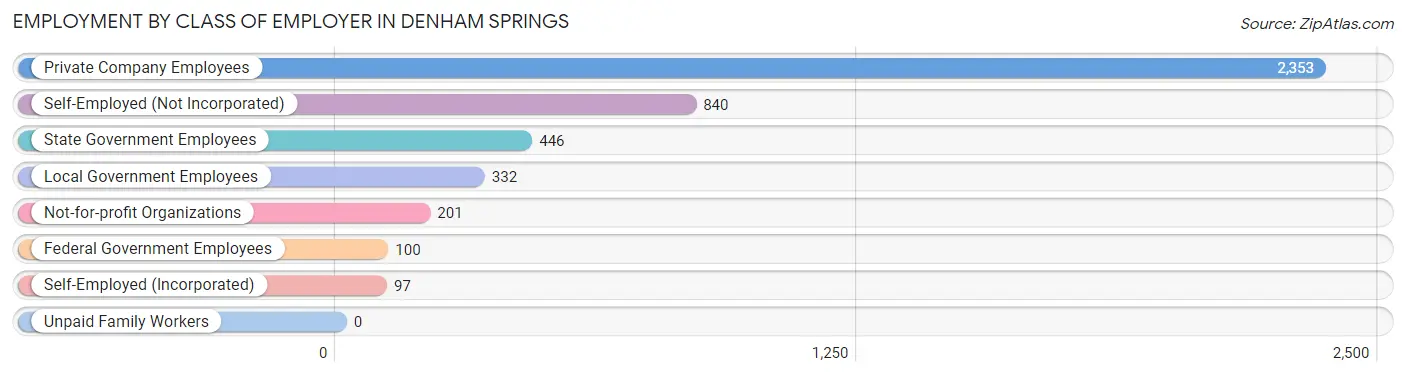
| Employer Class | # Employees | % Employees |
| Private Company Employees | 2,353 | 53.9% |
| Self-Employed (Incorporated) | 97 | 2.2% |
| Self-Employed (Not Incorporated) | 840 | 19.2% |
| Not-for-profit Organizations | 201 | 4.6% |
| Local Government Employees | 332 | 7.6% |
| State Government Employees | 446 | 10.2% |
| Federal Government Employees | 100 | 2.3% |
| Unpaid Family Workers | 0 | 0.0% |
| Total | 4,369 | 100.0% |
Employment Status by Age in Denham Springs
According to the labor force statistics for Denham Springs, out of the total population over 16 years of age (7,427), 63.7% or 4,731 individuals are in the labor force, with 7.4% or 350 of them unemployed. The age group with the highest labor force participation rate is 30 to 34 years, with 92.6% or 733 individuals in the labor force. Within the labor force, the 16 to 19 years age range has the highest percentage of unemployed individuals, with 49.2% or 31 of them being unemployed.
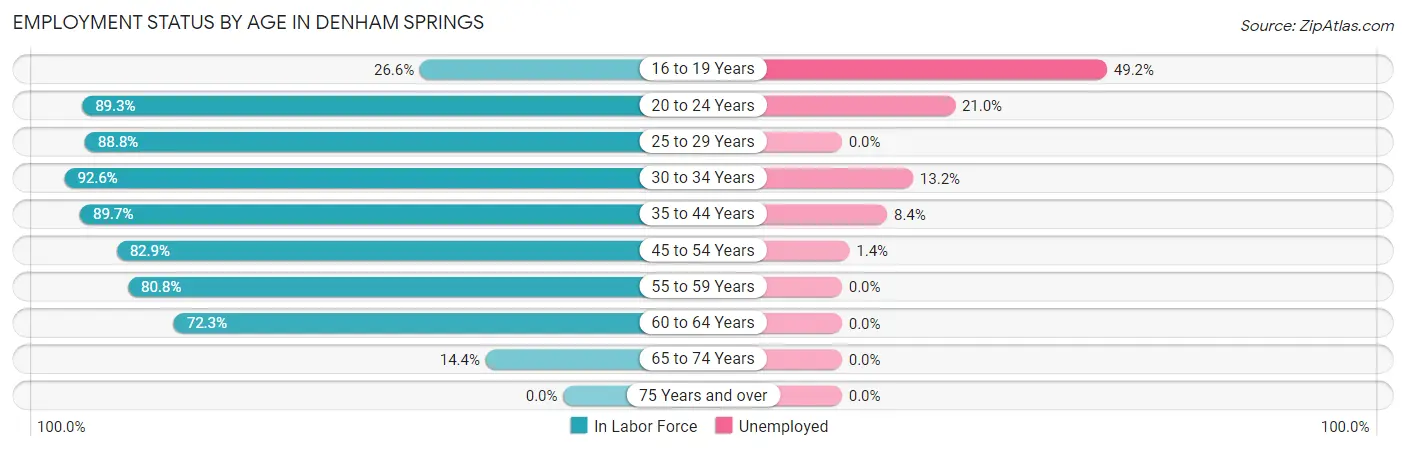
| Age Bracket | In Labor Force | Unemployed |
| 16 to 19 Years | 63 (26.6%) | 31 (49.2%) |
| 20 to 24 Years | 648 (89.3%) | 136 (21.0%) |
| 25 to 29 Years | 515 (88.8%) | 0 (0.0%) |
| 30 to 34 Years | 733 (92.6%) | 97 (13.2%) |
| 35 to 44 Years | 1,046 (89.7%) | 88 (8.4%) |
| 45 to 54 Years | 690 (82.9%) | 10 (1.4%) |
| 55 to 59 Years | 493 (80.8%) | 0 (0.0%) |
| 60 to 64 Years | 389 (72.3%) | 0 (0.0%) |
| 65 to 74 Years | 158 (14.4%) | 0 (0.0%) |
| 75 Years and over | 0 (0.0%) | 0 (0.0%) |
| Total | 4,731 (63.7%) | 350 (7.4%) |
Employment Status by Educational Attainment in Denham Springs
According to labor force statistics for Denham Springs, 85.6% of individuals (3,867) out of the total population between 25 and 64 years of age (4,518) are in the labor force, with 5.0% or 193 of them being unemployed. The group with the highest labor force participation rate are those with the educational attainment of bachelor's degree or higher, with 87.3% or 1,218 individuals in the labor force. Within the labor force, individuals with high school diploma education have the highest percentage of unemployment, with 9.2% or 95 of them being unemployed.
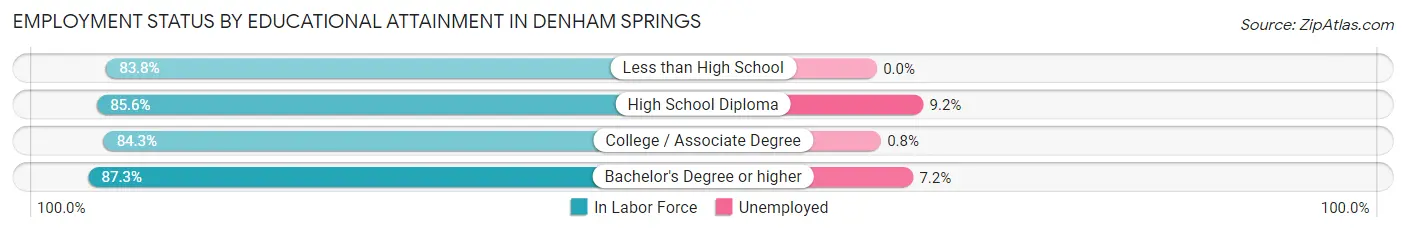
| Educational Attainment | In Labor Force | Unemployed |
| Less than High School | 119 (83.8%) | 0 (0.0%) |
| High School Diploma | 1,037 (85.6%) | 112 (9.2%) |
| College / Associate Degree | 1,491 (84.3%) | 14 (0.8%) |
| Bachelor's Degree or higher | 1,218 (87.3%) | 100 (7.2%) |
| Total | 3,867 (85.6%) | 226 (5.0%) |
Employment Occupations by Sex in Denham Springs
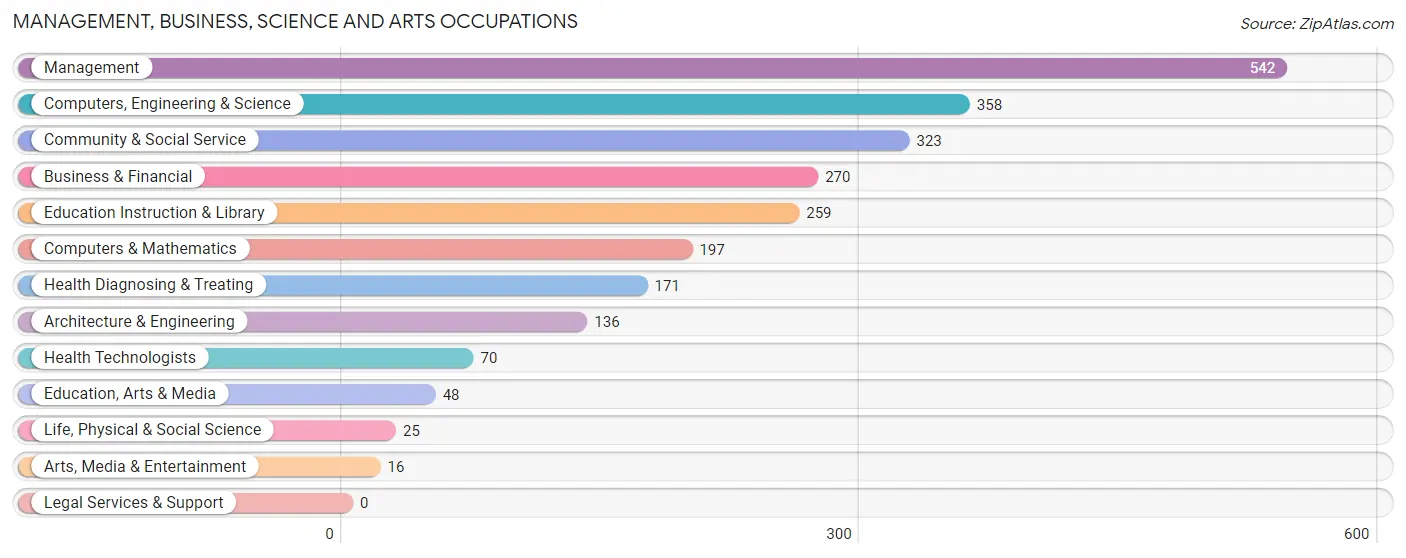
Management, Business, Science and Arts Occupations
The most common Management, Business, Science and Arts occupations in Denham Springs are Management (542 | 12.6%), Computers, Engineering & Science (358 | 8.3%), Community & Social Service (323 | 7.5%), Business & Financial (270 | 6.3%), and Education Instruction & Library (259 | 6.0%).
Management, Business, Science and Arts Occupations by Sex
Within the Management, Business, Science and Arts occupations in Denham Springs, the most male-oriented occupations are Computers & Mathematics (100.0%), Architecture & Engineering (90.4%), and Computers, Engineering & Science (89.4%), while the most female-oriented occupations are Life, Physical & Social Science (100.0%), Education, Arts & Media (100.0%), and Arts, Media & Entertainment (100.0%).
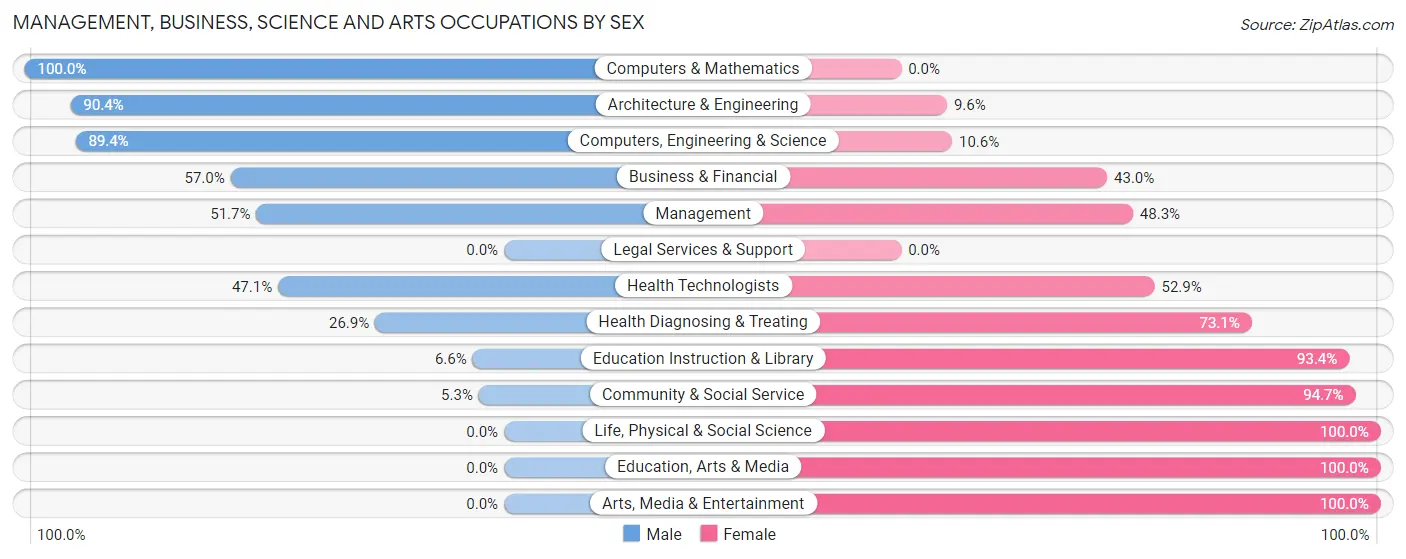
| Occupation | Male | Female |
| Management | 280 (51.7%) | 262 (48.3%) |
| Business & Financial | 154 (57.0%) | 116 (43.0%) |
| Computers, Engineering & Science | 320 (89.4%) | 38 (10.6%) |
| Computers & Mathematics | 197 (100.0%) | 0 (0.0%) |
| Architecture & Engineering | 123 (90.4%) | 13 (9.6%) |
| Life, Physical & Social Science | 0 (0.0%) | 25 (100.0%) |
| Community & Social Service | 17 (5.3%) | 306 (94.7%) |
| Education, Arts & Media | 0 (0.0%) | 48 (100.0%) |
| Legal Services & Support | 0 (0.0%) | 0 (0.0%) |
| Education Instruction & Library | 17 (6.6%) | 242 (93.4%) |
| Arts, Media & Entertainment | 0 (0.0%) | 16 (100.0%) |
| Health Diagnosing & Treating | 46 (26.9%) | 125 (73.1%) |
| Health Technologists | 33 (47.1%) | 37 (52.9%) |
| Total (Category) | 817 (49.1%) | 847 (50.9%) |
| Total (Overall) | 2,311 (53.7%) | 1,994 (46.3%) |
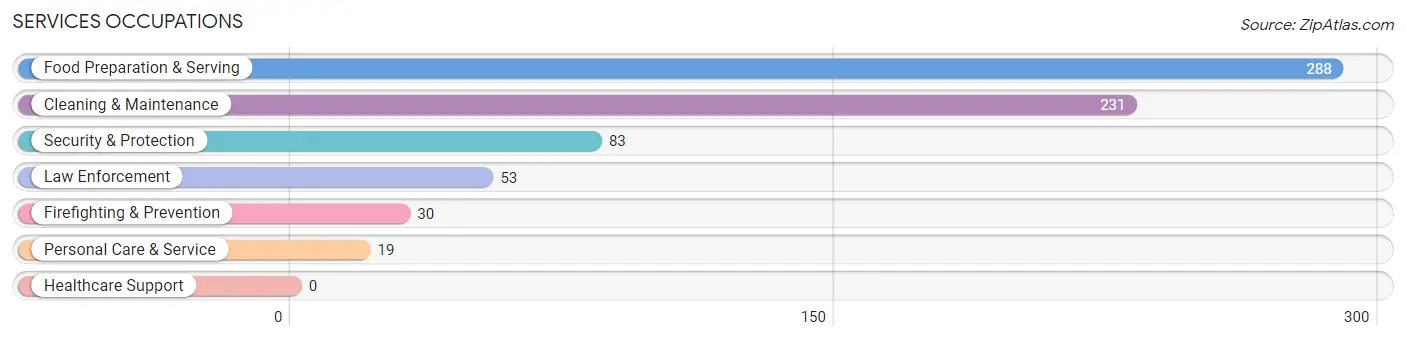
Services Occupations
The most common Services occupations in Denham Springs are Food Preparation & Serving (288 | 6.7%), Cleaning & Maintenance (231 | 5.4%), Security & Protection (83 | 1.9%), Law Enforcement (53 | 1.2%), and Firefighting & Prevention (30 | 0.7%).
Services Occupations by Sex
Within the Services occupations in Denham Springs, the most male-oriented occupations are Cleaning & Maintenance (65.8%), Firefighting & Prevention (53.3%), and Security & Protection (49.4%), while the most female-oriented occupations are Personal Care & Service (100.0%), Food Preparation & Serving (72.9%), and Law Enforcement (52.8%).
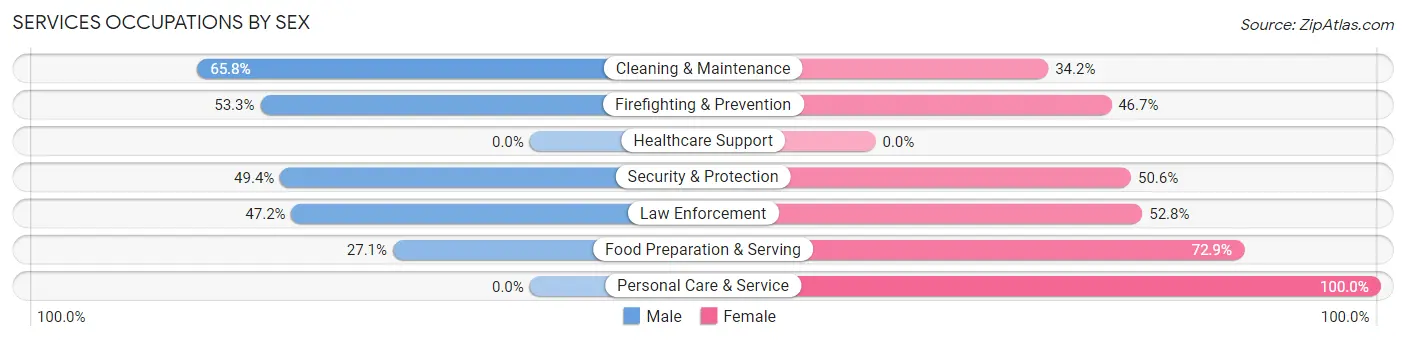
| Occupation | Male | Female |
| Healthcare Support | 0 (0.0%) | 0 (0.0%) |
| Security & Protection | 41 (49.4%) | 42 (50.6%) |
| Firefighting & Prevention | 16 (53.3%) | 14 (46.7%) |
| Law Enforcement | 25 (47.2%) | 28 (52.8%) |
| Food Preparation & Serving | 78 (27.1%) | 210 (72.9%) |
| Cleaning & Maintenance | 152 (65.8%) | 79 (34.2%) |
| Personal Care & Service | 0 (0.0%) | 19 (100.0%) |
| Total (Category) | 271 (43.6%) | 350 (56.4%) |
| Total (Overall) | 2,311 (53.7%) | 1,994 (46.3%) |
Sales and Office Occupations
The most common Sales and Office occupations in Denham Springs are Office & Administration (663 | 15.4%), and Sales & Related (321 | 7.5%).
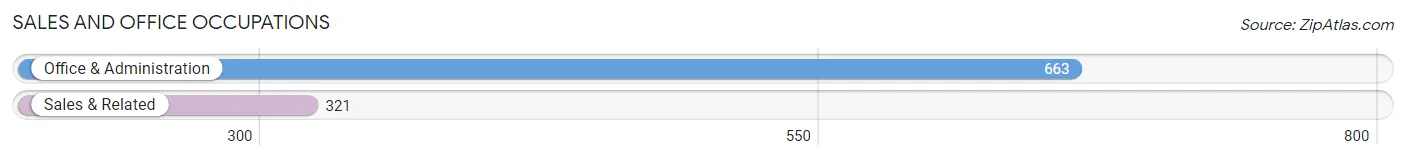
Sales and Office Occupations by Sex
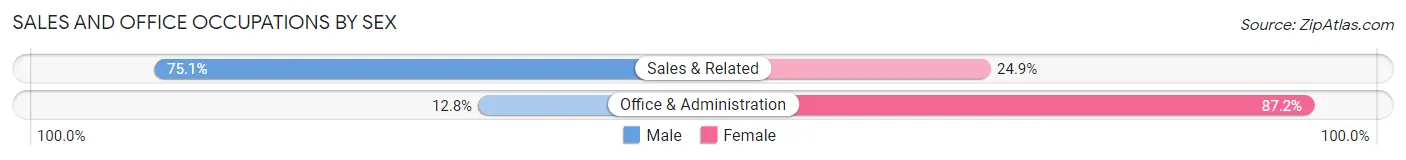
| Occupation | Male | Female |
| Sales & Related | 241 (75.1%) | 80 (24.9%) |
| Office & Administration | 85 (12.8%) | 578 (87.2%) |
| Total (Category) | 326 (33.1%) | 658 (66.9%) |
| Total (Overall) | 2,311 (53.7%) | 1,994 (46.3%) |
Natural Resources, Construction and Maintenance Occupations
The most common Natural Resources, Construction and Maintenance occupations in Denham Springs are Construction & Extraction (634 | 14.7%), and Installation, Maintenance & Repair (104 | 2.4%).
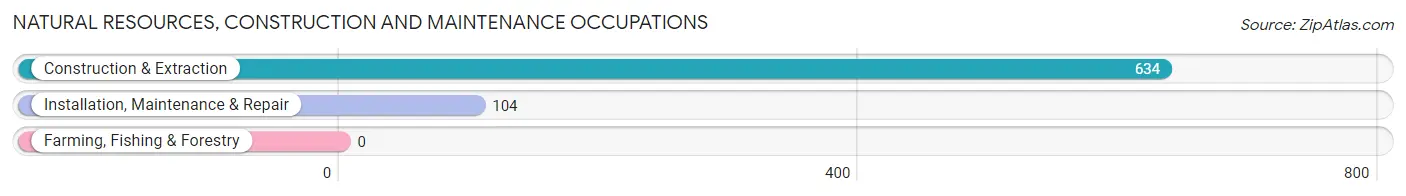
Natural Resources, Construction and Maintenance Occupations by Sex
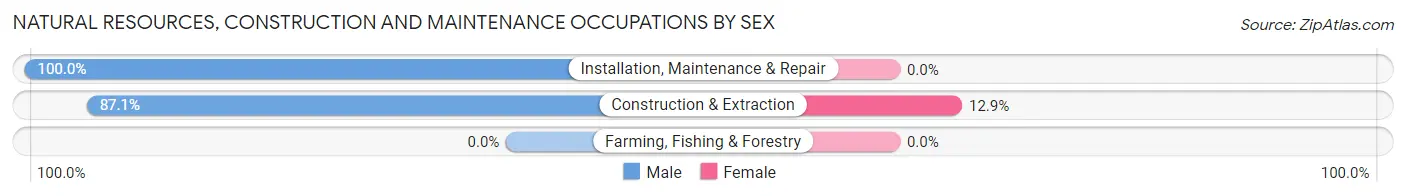
| Occupation | Male | Female |
| Farming, Fishing & Forestry | 0 (0.0%) | 0 (0.0%) |
| Construction & Extraction | 552 (87.1%) | 82 (12.9%) |
| Installation, Maintenance & Repair | 104 (100.0%) | 0 (0.0%) |
| Total (Category) | 656 (88.9%) | 82 (11.1%) |
| Total (Overall) | 2,311 (53.7%) | 1,994 (46.3%) |
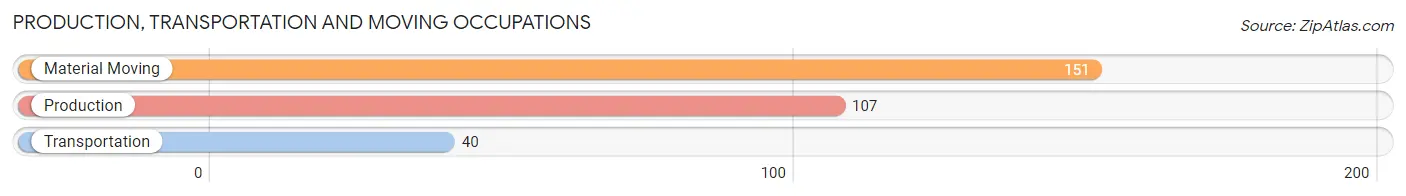
Production, Transportation and Moving Occupations
The most common Production, Transportation and Moving occupations in Denham Springs are Material Moving (151 | 3.5%), Production (107 | 2.5%), and Transportation (40 | 0.9%).
Production, Transportation and Moving Occupations by Sex
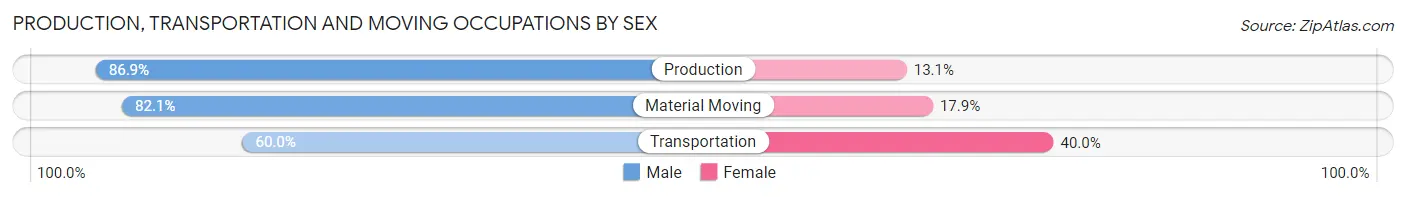
| Occupation | Male | Female |
| Production | 93 (86.9%) | 14 (13.1%) |
| Transportation | 24 (60.0%) | 16 (40.0%) |
| Material Moving | 124 (82.1%) | 27 (17.9%) |
| Total (Category) | 241 (80.9%) | 57 (19.1%) |
| Total (Overall) | 2,311 (53.7%) | 1,994 (46.3%) |
Employment Industries by Sex in Denham Springs
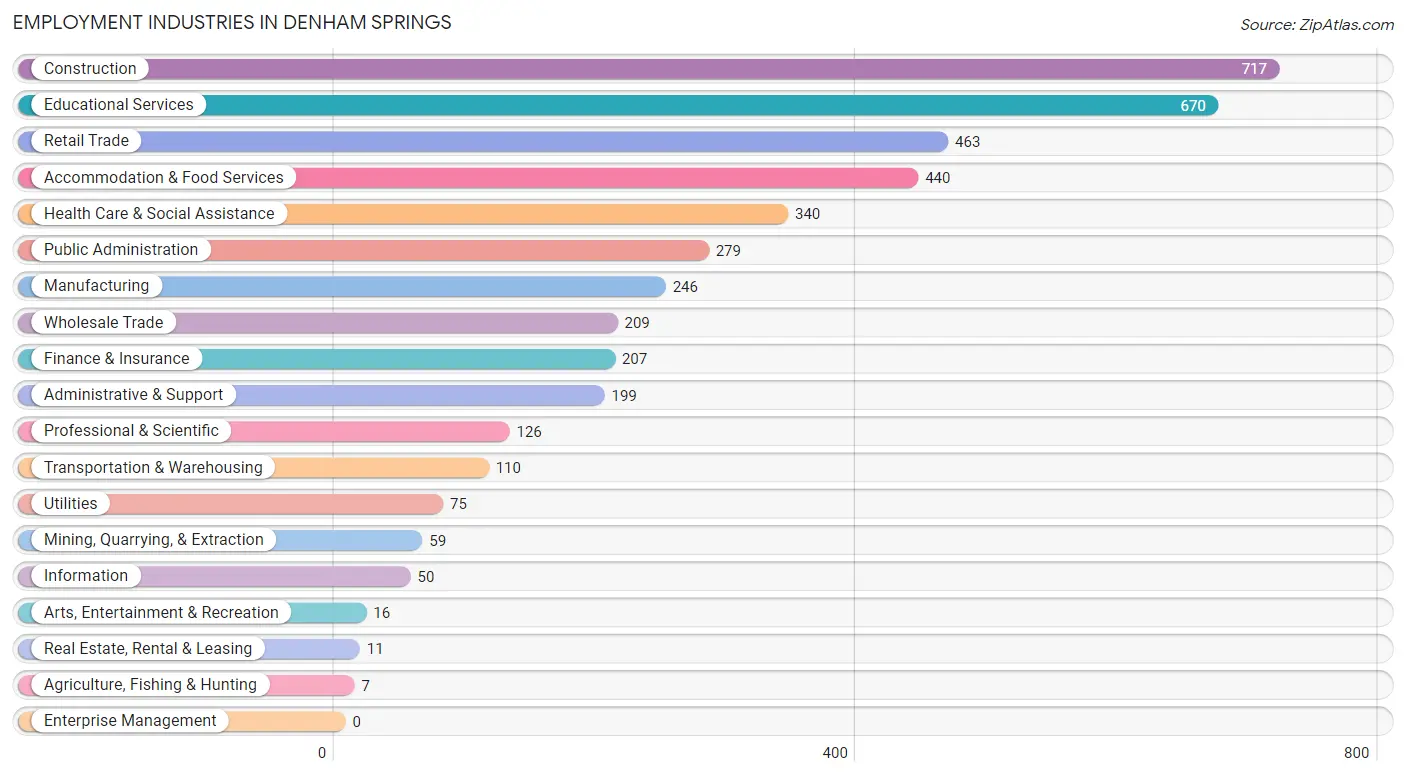
Employment Industries in Denham Springs
The major employment industries in Denham Springs include Construction (717 | 16.7%), Educational Services (670 | 15.6%), Retail Trade (463 | 10.7%), Accommodation & Food Services (440 | 10.2%), and Health Care & Social Assistance (340 | 7.9%).
Employment Industries by Sex in Denham Springs
The Denham Springs industries that see more men than women are Agriculture, Fishing & Hunting (100.0%), Mining, Quarrying, & Extraction (100.0%), and Transportation & Warehousing (100.0%), whereas the industries that tend to have a higher number of women are Arts, Entertainment & Recreation (100.0%), Information (82.0%), and Health Care & Social Assistance (81.8%).
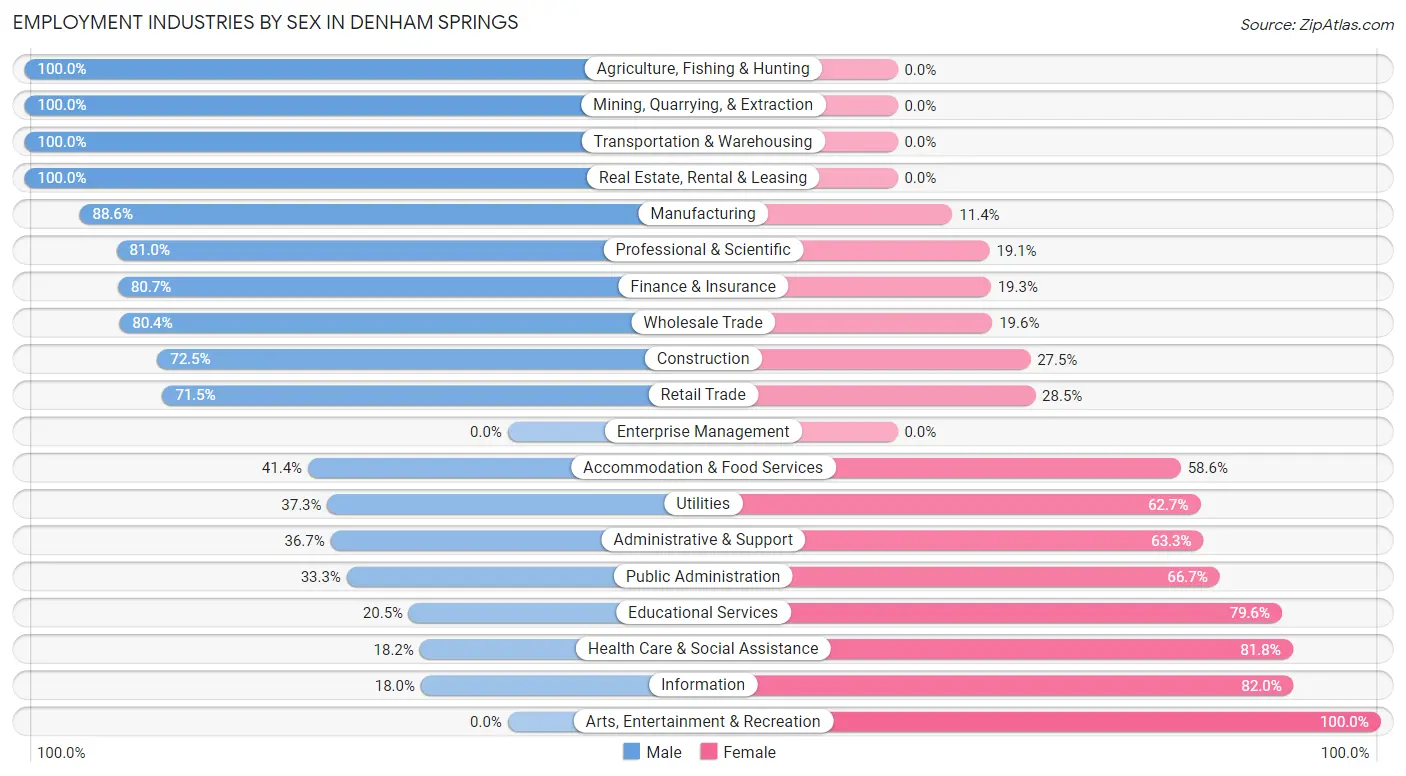
| Industry | Male | Female |
| Agriculture, Fishing & Hunting | 7 (100.0%) | 0 (0.0%) |
| Mining, Quarrying, & Extraction | 59 (100.0%) | 0 (0.0%) |
| Construction | 520 (72.5%) | 197 (27.5%) |
| Manufacturing | 218 (88.6%) | 28 (11.4%) |
| Wholesale Trade | 168 (80.4%) | 41 (19.6%) |
| Retail Trade | 331 (71.5%) | 132 (28.5%) |
| Transportation & Warehousing | 110 (100.0%) | 0 (0.0%) |
| Utilities | 28 (37.3%) | 47 (62.7%) |
| Information | 9 (18.0%) | 41 (82.0%) |
| Finance & Insurance | 167 (80.7%) | 40 (19.3%) |
| Real Estate, Rental & Leasing | 11 (100.0%) | 0 (0.0%) |
| Professional & Scientific | 102 (80.9%) | 24 (19.1%) |
| Enterprise Management | 0 (0.0%) | 0 (0.0%) |
| Administrative & Support | 73 (36.7%) | 126 (63.3%) |
| Educational Services | 137 (20.4%) | 533 (79.5%) |
| Health Care & Social Assistance | 62 (18.2%) | 278 (81.8%) |
| Arts, Entertainment & Recreation | 0 (0.0%) | 16 (100.0%) |
| Accommodation & Food Services | 182 (41.4%) | 258 (58.6%) |
| Public Administration | 93 (33.3%) | 186 (66.7%) |
| Total | 2,311 (53.7%) | 1,994 (46.3%) |
Education in Denham Springs
School Enrollment in Denham Springs
The most common levels of schooling among the 2,004 students in Denham Springs are middle school (793 | 39.6%), college / undergraduate (353 | 17.6%), and elementary school (346 | 17.3%).
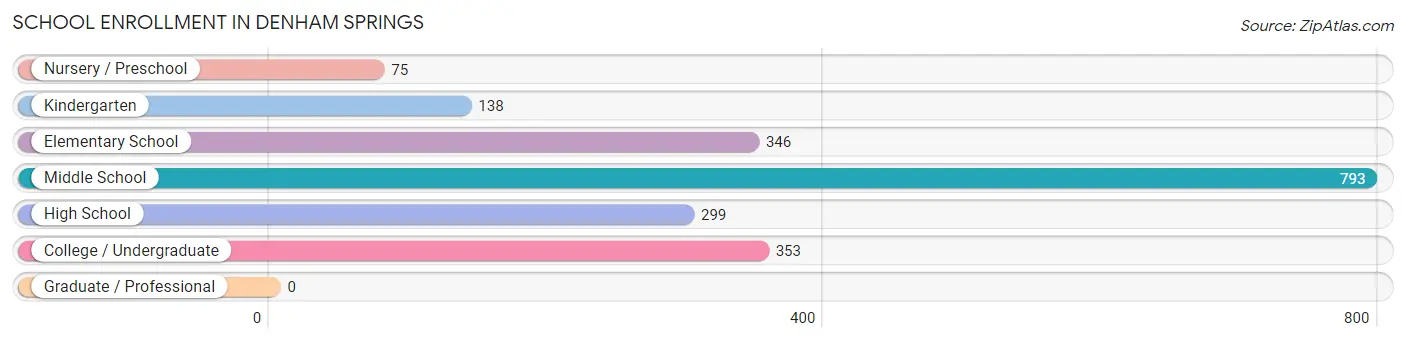
| School Level | # Students | % Students |
| Nursery / Preschool | 75 | 3.7% |
| Kindergarten | 138 | 6.9% |
| Elementary School | 346 | 17.3% |
| Middle School | 793 | 39.6% |
| High School | 299 | 14.9% |
| College / Undergraduate | 353 | 17.6% |
| Graduate / Professional | 0 | 0.0% |
| Total | 2,004 | 100.0% |
School Enrollment by Age by Funding Source in Denham Springs
Out of a total of 2,004 students who are enrolled in schools in Denham Springs, 387 (19.3%) attend a private institution, while the remaining 1,617 (80.7%) are enrolled in public schools. The age group of 35 years and over has the highest likelihood of being enrolled in private schools, with 29 (100.0% in the age bracket) enrolled. Conversely, the age group of 18 to 19 year olds has the lowest likelihood of being enrolled in a private school, with 35 (100.0% in the age bracket) attending a public institution.
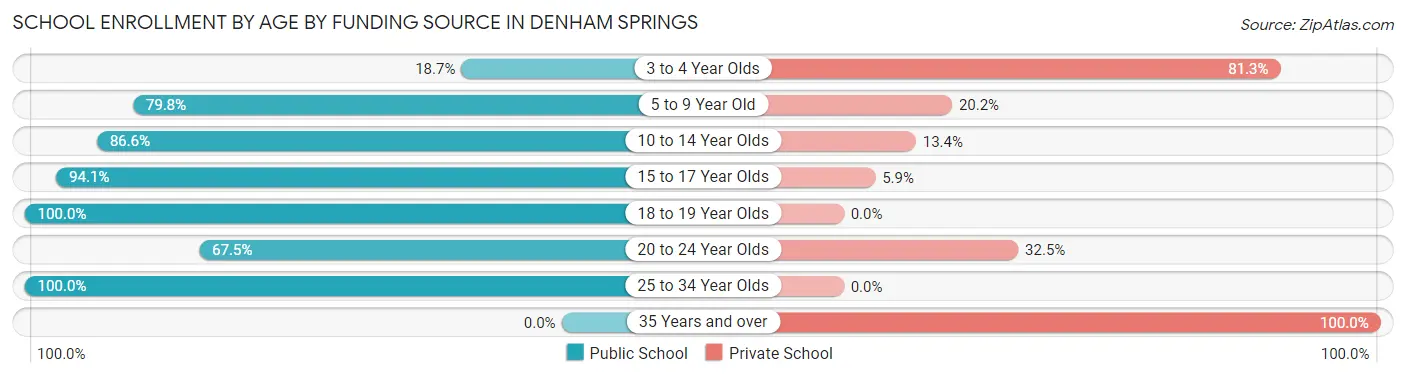
| Age Bracket | Public School | Private School |
| 3 to 4 Year Olds | 14 (18.7%) | 61 (81.3%) |
| 5 to 9 Year Old | 372 (79.8%) | 94 (20.2%) |
| 10 to 14 Year Olds | 702 (86.6%) | 109 (13.4%) |
| 15 to 17 Year Olds | 256 (94.1%) | 16 (5.9%) |
| 18 to 19 Year Olds | 35 (100.0%) | 0 (0.0%) |
| 20 to 24 Year Olds | 162 (67.5%) | 78 (32.5%) |
| 25 to 34 Year Olds | 76 (100.0%) | 0 (0.0%) |
| 35 Years and over | 0 (0.0%) | 29 (100.0%) |
| Total | 1,617 (80.7%) | 387 (19.3%) |
Educational Attainment by Field of Study in Denham Springs
Education (363 | 19.0%), visual & performing arts (313 | 16.3%), business (292 | 15.2%), liberal arts & history (171 | 8.9%), and bio, nature & agricultural (132 | 6.9%) are the most common fields of study among 1,915 individuals in Denham Springs who have obtained a bachelor's degree or higher.
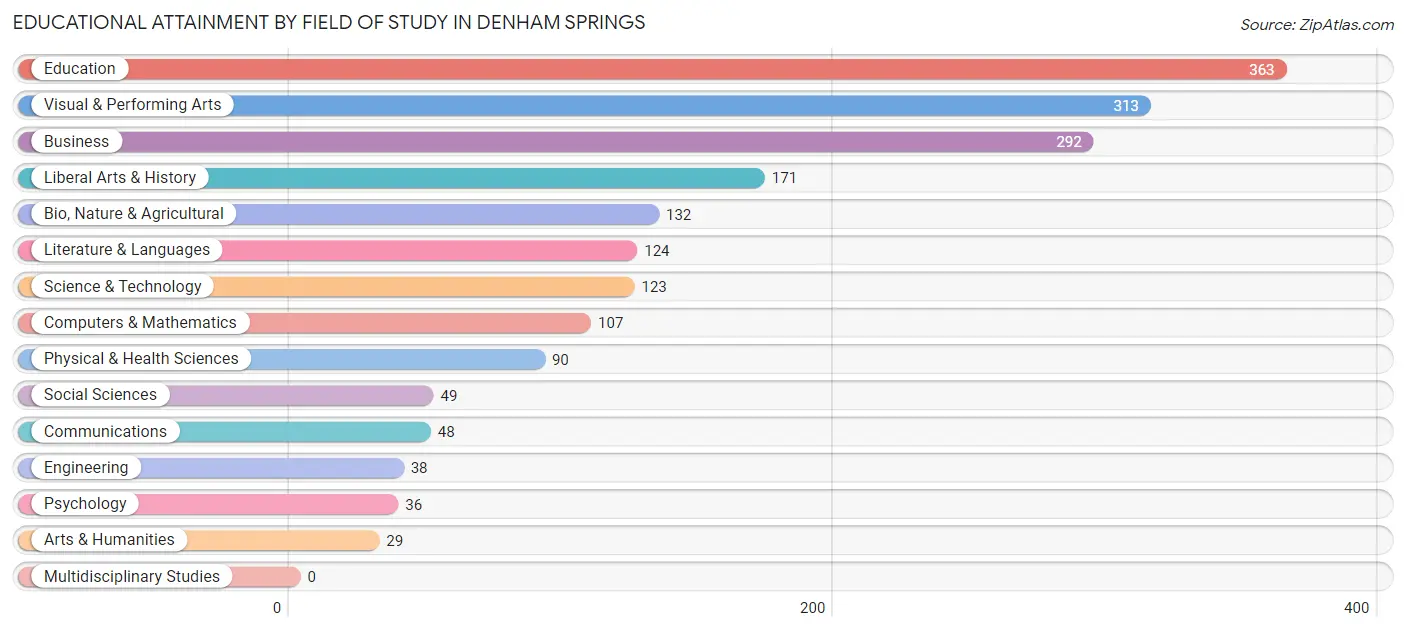
| Field of Study | # Graduates | % Graduates |
| Computers & Mathematics | 107 | 5.6% |
| Bio, Nature & Agricultural | 132 | 6.9% |
| Physical & Health Sciences | 90 | 4.7% |
| Psychology | 36 | 1.9% |
| Social Sciences | 49 | 2.6% |
| Engineering | 38 | 2.0% |
| Multidisciplinary Studies | 0 | 0.0% |
| Science & Technology | 123 | 6.4% |
| Business | 292 | 15.2% |
| Education | 363 | 19.0% |
| Literature & Languages | 124 | 6.5% |
| Liberal Arts & History | 171 | 8.9% |
| Visual & Performing Arts | 313 | 16.3% |
| Communications | 48 | 2.5% |
| Arts & Humanities | 29 | 1.5% |
| Total | 1,915 | 100.0% |
Transportation & Commute in Denham Springs
Vehicle Availability by Sex in Denham Springs
The most prevalent vehicle ownership categories in Denham Springs are males with 3 vehicles (780, accounting for 32.6%) and females with 3 vehicles (518, making up 39.5%).
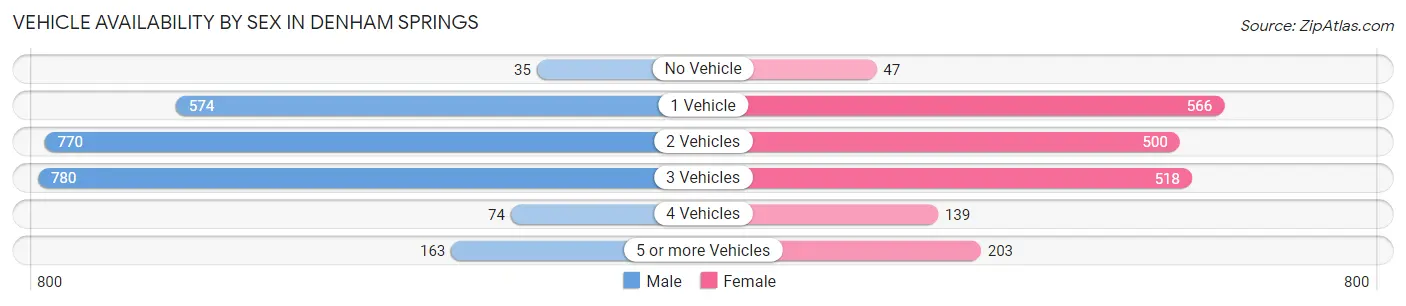
| Vehicles Available | Male | Female |
| No Vehicle | 35 (1.5%) | 47 (2.4%) |
| 1 Vehicle | 574 (24.0%) | 566 (28.7%) |
| 2 Vehicles | 770 (32.1%) | 500 (25.3%) |
| 3 Vehicles | 780 (32.6%) | 518 (26.3%) |
| 4 Vehicles | 74 (3.1%) | 139 (7.0%) |
| 5 or more Vehicles | 163 (6.8%) | 203 (10.3%) |
| Total | 2,396 (100.0%) | 1,973 (100.0%) |
Commute Time in Denham Springs
The most frequently occuring commute durations in Denham Springs are 20 to 24 minutes (783 commuters, 19.0%), 30 to 34 minutes (701 commuters, 17.0%), and 5 to 9 minutes (612 commuters, 14.8%).
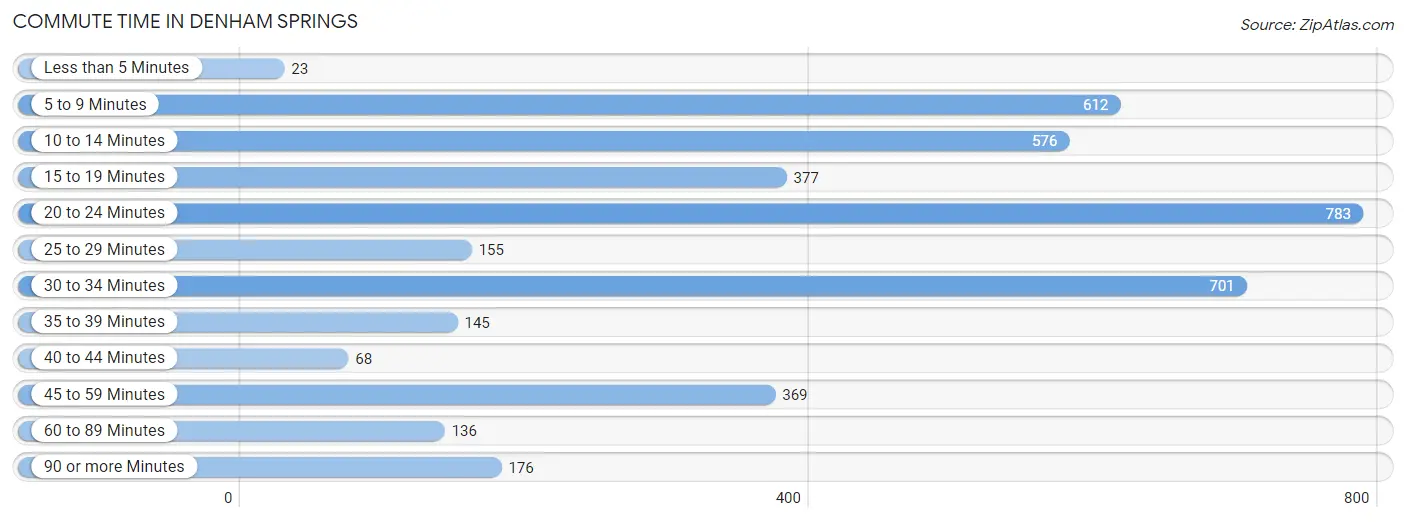
| Commute Time | # Commuters | % Commuters |
| Less than 5 Minutes | 23 | 0.6% |
| 5 to 9 Minutes | 612 | 14.8% |
| 10 to 14 Minutes | 576 | 14.0% |
| 15 to 19 Minutes | 377 | 9.1% |
| 20 to 24 Minutes | 783 | 19.0% |
| 25 to 29 Minutes | 155 | 3.8% |
| 30 to 34 Minutes | 701 | 17.0% |
| 35 to 39 Minutes | 145 | 3.5% |
| 40 to 44 Minutes | 68 | 1.7% |
| 45 to 59 Minutes | 369 | 8.9% |
| 60 to 89 Minutes | 136 | 3.3% |
| 90 or more Minutes | 176 | 4.3% |
Commute Time by Sex in Denham Springs
The most common commute times in Denham Springs are 20 to 24 minutes (653 commuters, 28.4%) for males and 5 to 9 minutes (402 commuters, 22.0%) for females.
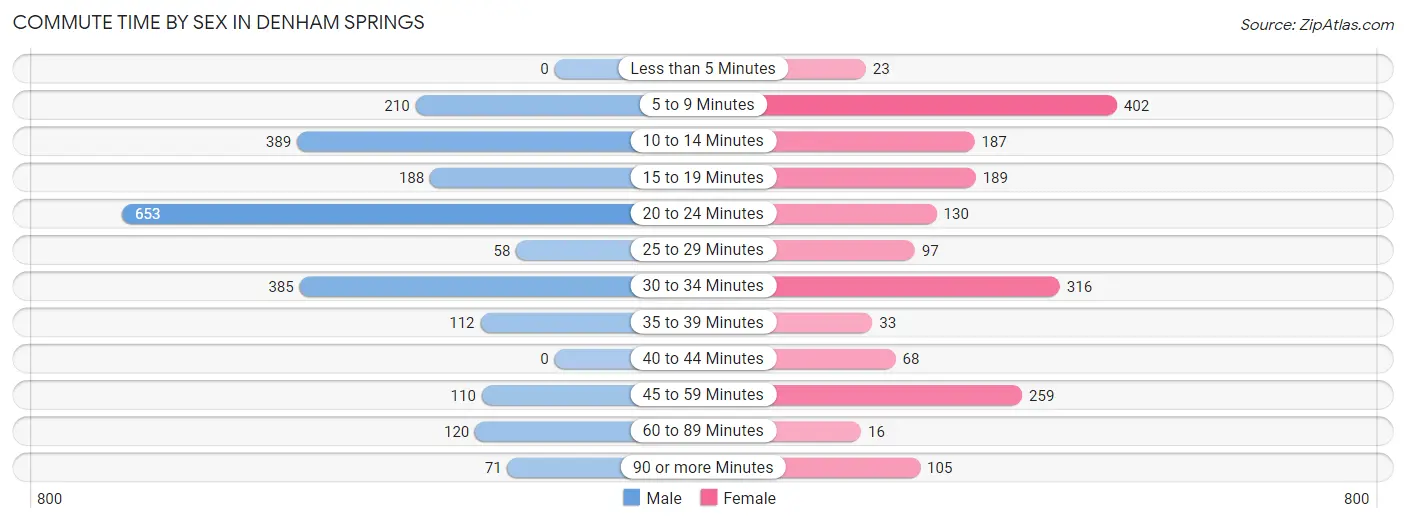
| Commute Time | Male | Female |
| Less than 5 Minutes | 0 (0.0%) | 23 (1.3%) |
| 5 to 9 Minutes | 210 (9.1%) | 402 (22.0%) |
| 10 to 14 Minutes | 389 (16.9%) | 187 (10.2%) |
| 15 to 19 Minutes | 188 (8.2%) | 189 (10.4%) |
| 20 to 24 Minutes | 653 (28.4%) | 130 (7.1%) |
| 25 to 29 Minutes | 58 (2.5%) | 97 (5.3%) |
| 30 to 34 Minutes | 385 (16.8%) | 316 (17.3%) |
| 35 to 39 Minutes | 112 (4.9%) | 33 (1.8%) |
| 40 to 44 Minutes | 0 (0.0%) | 68 (3.7%) |
| 45 to 59 Minutes | 110 (4.8%) | 259 (14.2%) |
| 60 to 89 Minutes | 120 (5.2%) | 16 (0.9%) |
| 90 or more Minutes | 71 (3.1%) | 105 (5.8%) |
Time of Departure to Work by Sex in Denham Springs
The most frequent times of departure to work in Denham Springs are 6:30 AM to 6:59 AM (403, 17.5%) for males and 6:30 AM to 6:59 AM (454, 24.9%) for females.
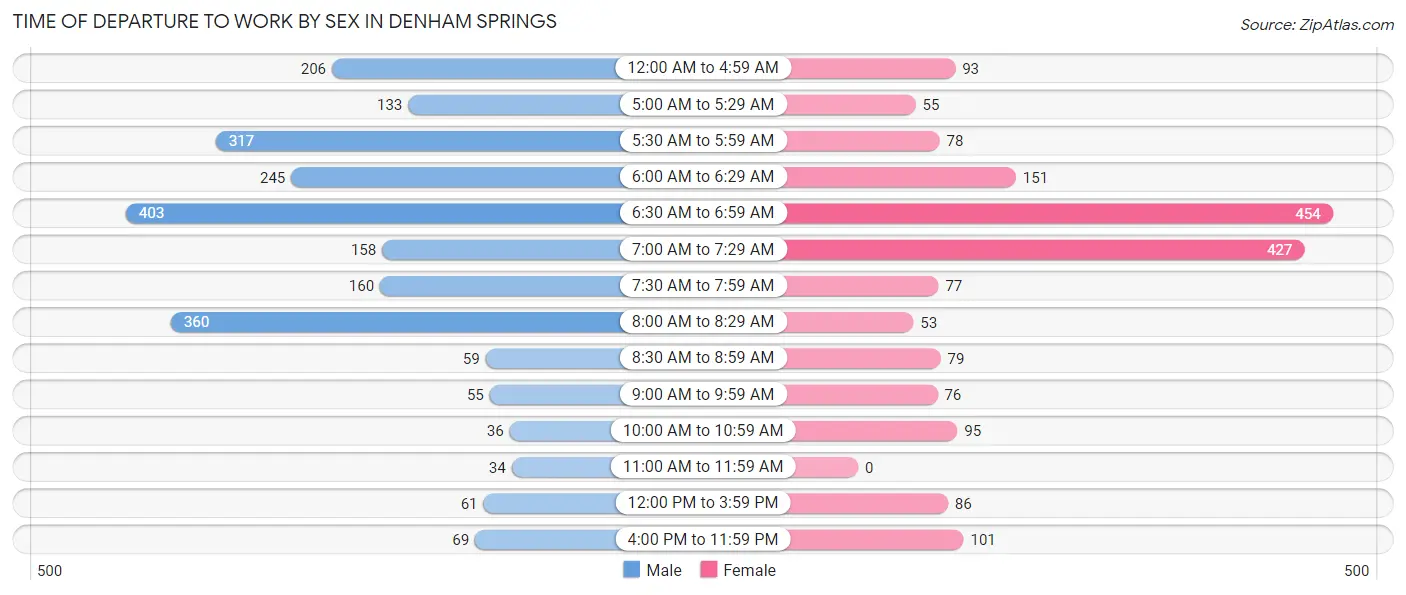
| Time of Departure | Male | Female |
| 12:00 AM to 4:59 AM | 206 (9.0%) | 93 (5.1%) |
| 5:00 AM to 5:29 AM | 133 (5.8%) | 55 (3.0%) |
| 5:30 AM to 5:59 AM | 317 (13.8%) | 78 (4.3%) |
| 6:00 AM to 6:29 AM | 245 (10.7%) | 151 (8.3%) |
| 6:30 AM to 6:59 AM | 403 (17.5%) | 454 (24.9%) |
| 7:00 AM to 7:29 AM | 158 (6.9%) | 427 (23.4%) |
| 7:30 AM to 7:59 AM | 160 (7.0%) | 77 (4.2%) |
| 8:00 AM to 8:29 AM | 360 (15.7%) | 53 (2.9%) |
| 8:30 AM to 8:59 AM | 59 (2.6%) | 79 (4.3%) |
| 9:00 AM to 9:59 AM | 55 (2.4%) | 76 (4.2%) |
| 10:00 AM to 10:59 AM | 36 (1.6%) | 95 (5.2%) |
| 11:00 AM to 11:59 AM | 34 (1.5%) | 0 (0.0%) |
| 12:00 PM to 3:59 PM | 61 (2.7%) | 86 (4.7%) |
| 4:00 PM to 11:59 PM | 69 (3.0%) | 101 (5.5%) |
| Total | 2,296 (100.0%) | 1,825 (100.0%) |
Housing Occupancy in Denham Springs
Occupancy by Ownership in Denham Springs
Of the total 3,674 dwellings in Denham Springs, owner-occupied units account for 2,625 (71.5%), while renter-occupied units make up 1,049 (28.5%).
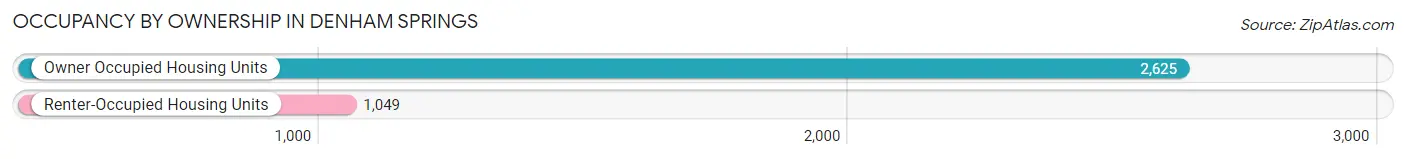
| Occupancy | # Housing Units | % Housing Units |
| Owner Occupied Housing Units | 2,625 | 71.5% |
| Renter-Occupied Housing Units | 1,049 | 28.5% |
| Total Occupied Housing Units | 3,674 | 100.0% |
Occupancy by Household Size in Denham Springs
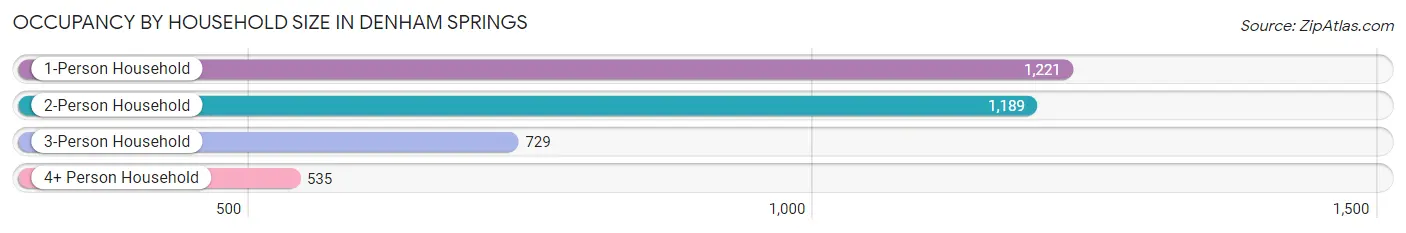
| Household Size | # Housing Units | % Housing Units |
| 1-Person Household | 1,221 | 33.2% |
| 2-Person Household | 1,189 | 32.4% |
| 3-Person Household | 729 | 19.8% |
| 4+ Person Household | 535 | 14.6% |
| Total Housing Units | 3,674 | 100.0% |
Occupancy by Ownership by Household Size in Denham Springs
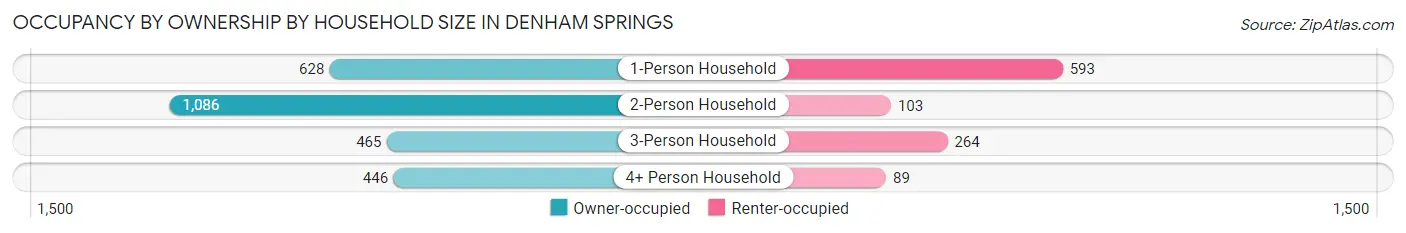
| Household Size | Owner-occupied | Renter-occupied |
| 1-Person Household | 628 (51.4%) | 593 (48.6%) |
| 2-Person Household | 1,086 (91.3%) | 103 (8.7%) |
| 3-Person Household | 465 (63.8%) | 264 (36.2%) |
| 4+ Person Household | 446 (83.4%) | 89 (16.6%) |
| Total Housing Units | 2,625 (71.5%) | 1,049 (28.5%) |
Occupancy by Educational Attainment in Denham Springs
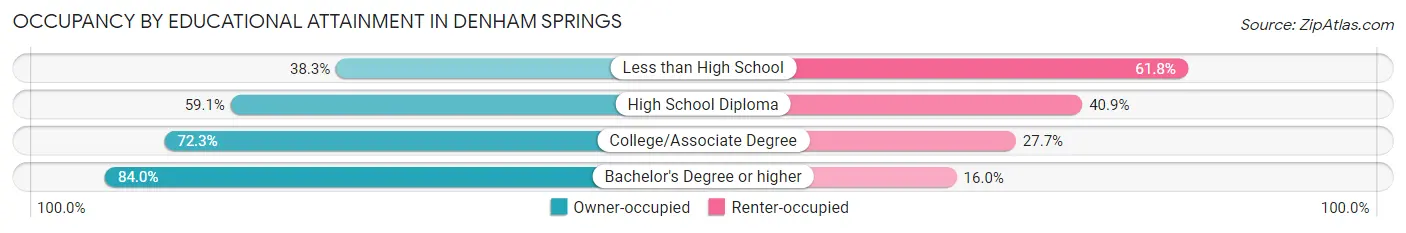
| Household Size | Owner-occupied | Renter-occupied |
| Less than High School | 70 (38.3%) | 113 (61.8%) |
| High School Diploma | 521 (59.1%) | 360 (40.9%) |
| College/Associate Degree | 981 (72.3%) | 376 (27.7%) |
| Bachelor's Degree or higher | 1,053 (84.0%) | 200 (16.0%) |
Occupancy by Age of Householder in Denham Springs
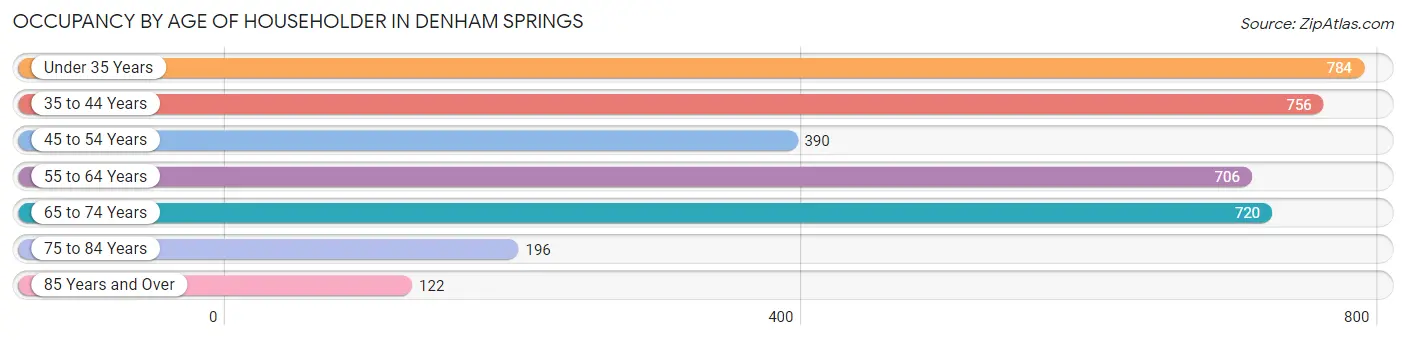
| Age Bracket | # Households | % Households |
| Under 35 Years | 784 | 21.3% |
| 35 to 44 Years | 756 | 20.6% |
| 45 to 54 Years | 390 | 10.6% |
| 55 to 64 Years | 706 | 19.2% |
| 65 to 74 Years | 720 | 19.6% |
| 75 to 84 Years | 196 | 5.3% |
| 85 Years and Over | 122 | 3.3% |
| Total | 3,674 | 100.0% |
Housing Finances in Denham Springs
Median Income by Occupancy in Denham Springs
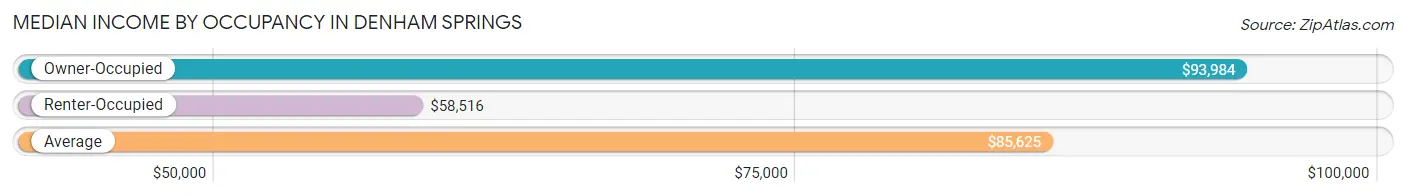
| Occupancy Type | # Households | Median Income |
| Owner-Occupied | 2,625 (71.5%) | $93,984 |
| Renter-Occupied | 1,049 (28.5%) | $58,516 |
| Average | 3,674 (100.0%) | $85,625 |
Occupancy by Householder Income Bracket in Denham Springs
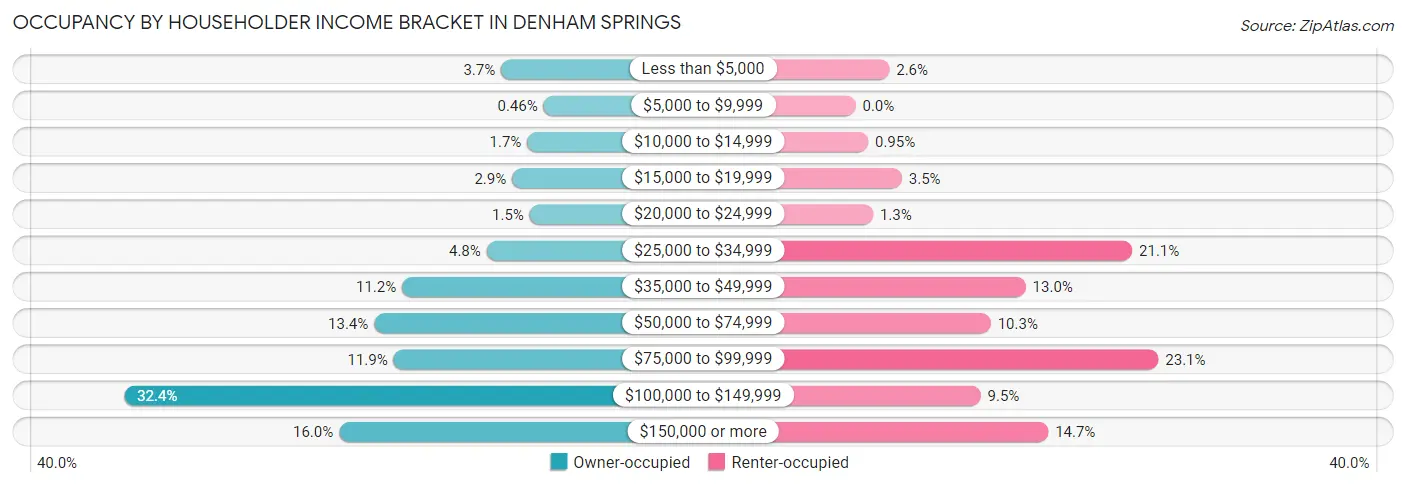
| Income Bracket | Owner-occupied | Renter-occupied |
| Less than $5,000 | 97 (3.7%) | 27 (2.6%) |
| $5,000 to $9,999 | 12 (0.5%) | 0 (0.0%) |
| $10,000 to $14,999 | 45 (1.7%) | 10 (0.9%) |
| $15,000 to $19,999 | 75 (2.9%) | 37 (3.5%) |
| $20,000 to $24,999 | 40 (1.5%) | 14 (1.3%) |
| $25,000 to $34,999 | 126 (4.8%) | 221 (21.1%) |
| $35,000 to $49,999 | 295 (11.2%) | 136 (13.0%) |
| $50,000 to $74,999 | 351 (13.4%) | 108 (10.3%) |
| $75,000 to $99,999 | 312 (11.9%) | 242 (23.1%) |
| $100,000 to $149,999 | 851 (32.4%) | 100 (9.5%) |
| $150,000 or more | 421 (16.0%) | 154 (14.7%) |
| Total | 2,625 (100.0%) | 1,049 (100.0%) |
Monthly Housing Cost Tiers in Denham Springs

| Monthly Cost | Owner-occupied | Renter-occupied |
| Less than $300 | 458 (17.4%) | 8 (0.8%) |
| $300 to $499 | 529 (20.2%) | 9 (0.9%) |
| $500 to $799 | 324 (12.3%) | 264 (25.2%) |
| $800 to $999 | 194 (7.4%) | 169 (16.1%) |
| $1,000 to $1,499 | 548 (20.9%) | 215 (20.5%) |
| $1,500 to $1,999 | 345 (13.1%) | 43 (4.1%) |
| $2,000 to $2,499 | 95 (3.6%) | 181 (17.2%) |
| $2,500 to $2,999 | 132 (5.0%) | 90 (8.6%) |
| $3,000 or more | 0 (0.0%) | 0 (0.0%) |
| Total | 2,625 (100.0%) | 1,049 (100.0%) |
Physical Housing Characteristics in Denham Springs
Housing Structures in Denham Springs
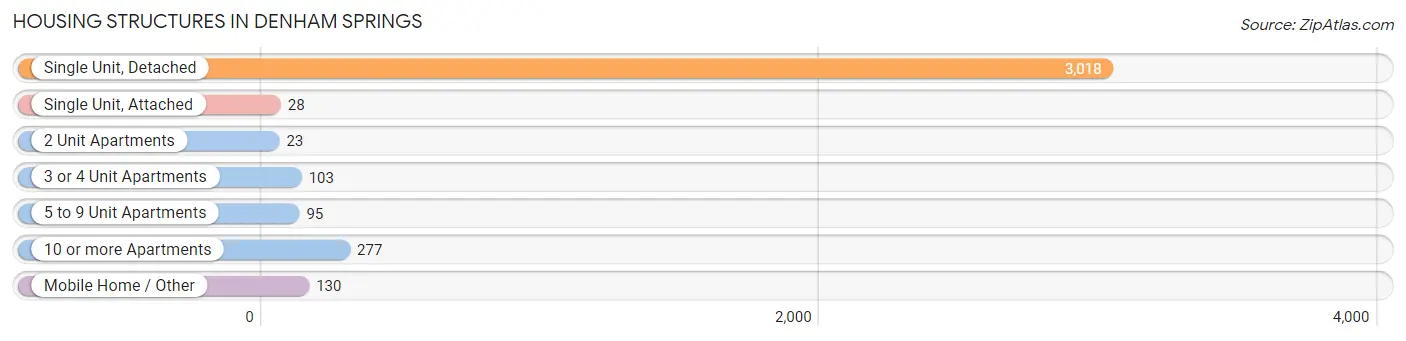
| Structure Type | # Housing Units | % Housing Units |
| Single Unit, Detached | 3,018 | 82.1% |
| Single Unit, Attached | 28 | 0.8% |
| 2 Unit Apartments | 23 | 0.6% |
| 3 or 4 Unit Apartments | 103 | 2.8% |
| 5 to 9 Unit Apartments | 95 | 2.6% |
| 10 or more Apartments | 277 | 7.5% |
| Mobile Home / Other | 130 | 3.5% |
| Total | 3,674 | 100.0% |
Housing Structures by Occupancy in Denham Springs
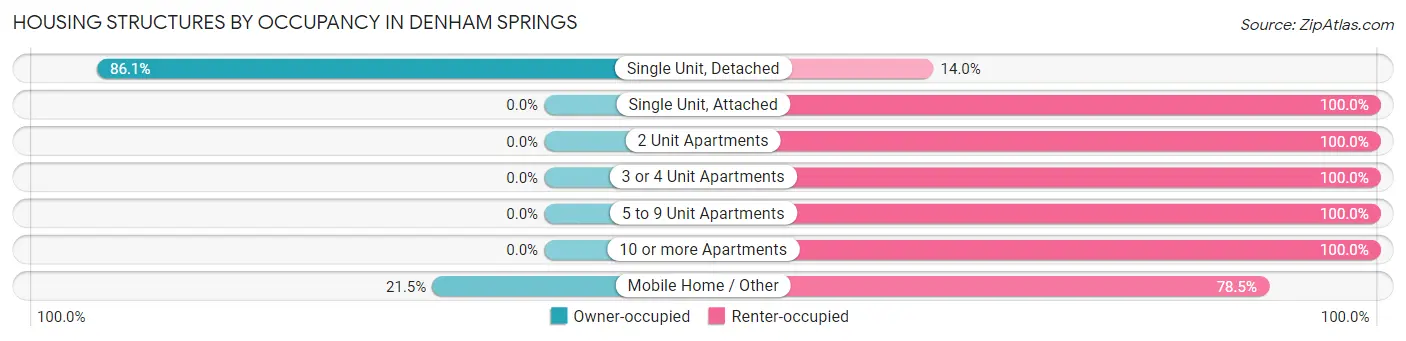
| Structure Type | Owner-occupied | Renter-occupied |
| Single Unit, Detached | 2,597 (86.1%) | 421 (14.0%) |
| Single Unit, Attached | 0 (0.0%) | 28 (100.0%) |
| 2 Unit Apartments | 0 (0.0%) | 23 (100.0%) |
| 3 or 4 Unit Apartments | 0 (0.0%) | 103 (100.0%) |
| 5 to 9 Unit Apartments | 0 (0.0%) | 95 (100.0%) |
| 10 or more Apartments | 0 (0.0%) | 277 (100.0%) |
| Mobile Home / Other | 28 (21.5%) | 102 (78.5%) |
| Total | 2,625 (71.5%) | 1,049 (28.5%) |
Housing Structures by Number of Rooms in Denham Springs
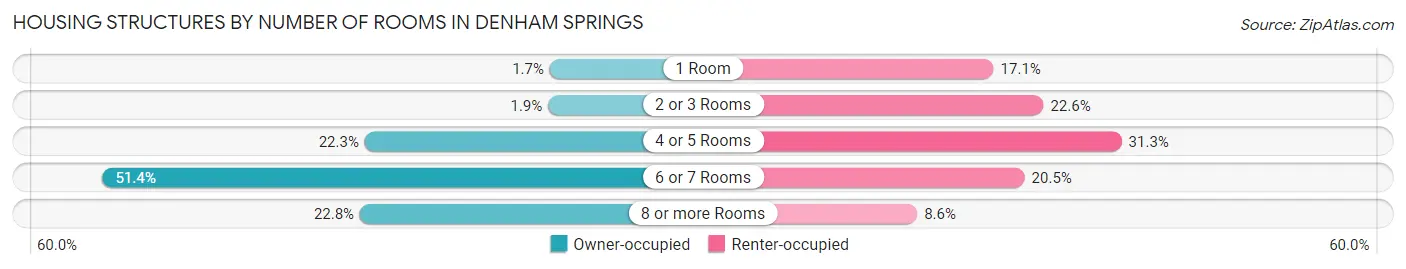
| Number of Rooms | Owner-occupied | Renter-occupied |
| 1 Room | 45 (1.7%) | 179 (17.1%) |
| 2 or 3 Rooms | 50 (1.9%) | 237 (22.6%) |
| 4 or 5 Rooms | 584 (22.3%) | 328 (31.3%) |
| 6 or 7 Rooms | 1,348 (51.3%) | 215 (20.5%) |
| 8 or more Rooms | 598 (22.8%) | 90 (8.6%) |
| Total | 2,625 (100.0%) | 1,049 (100.0%) |
Housing Structure by Heating Type in Denham Springs
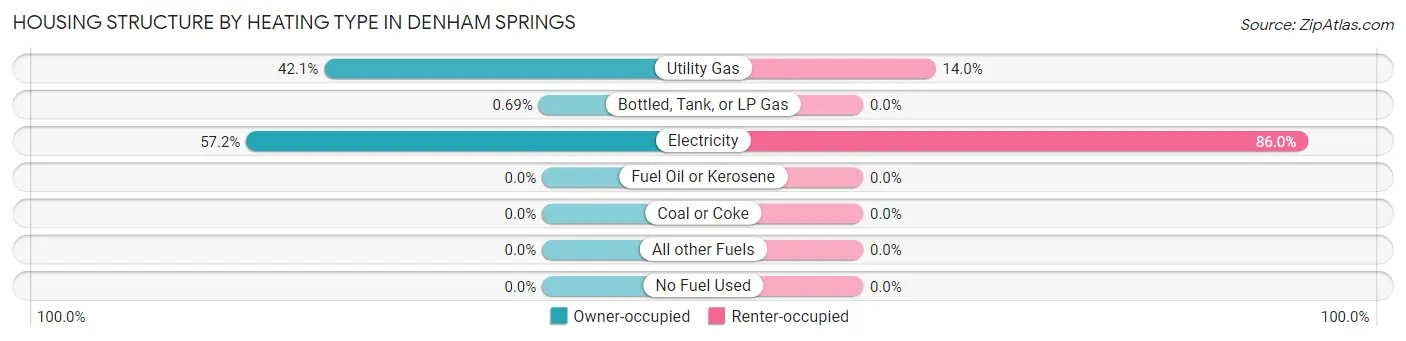
| Heating Type | Owner-occupied | Renter-occupied |
| Utility Gas | 1,106 (42.1%) | 147 (14.0%) |
| Bottled, Tank, or LP Gas | 18 (0.7%) | 0 (0.0%) |
| Electricity | 1,501 (57.2%) | 902 (86.0%) |
| Fuel Oil or Kerosene | 0 (0.0%) | 0 (0.0%) |
| Coal or Coke | 0 (0.0%) | 0 (0.0%) |
| All other Fuels | 0 (0.0%) | 0 (0.0%) |
| No Fuel Used | 0 (0.0%) | 0 (0.0%) |
| Total | 2,625 (100.0%) | 1,049 (100.0%) |
Household Vehicle Usage in Denham Springs
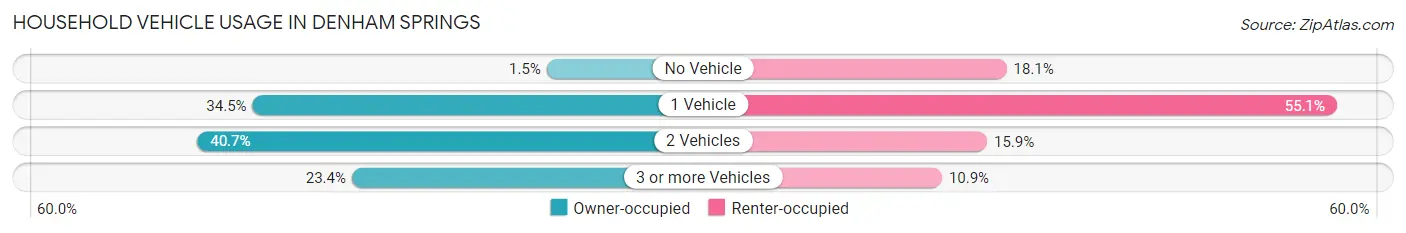
| Vehicles per Household | Owner-occupied | Renter-occupied |
| No Vehicle | 40 (1.5%) | 190 (18.1%) |
| 1 Vehicle | 905 (34.5%) | 578 (55.1%) |
| 2 Vehicles | 1,067 (40.6%) | 167 (15.9%) |
| 3 or more Vehicles | 613 (23.4%) | 114 (10.9%) |
| Total | 2,625 (100.0%) | 1,049 (100.0%) |
Real Estate & Mortgages in Denham Springs
Real Estate and Mortgage Overview in Denham Springs
| Characteristic | Without Mortgage | With Mortgage |
| Housing Units | 1,302 | 1,323 |
| Median Property Value | $161,400 | $208,500 |
| Median Household Income | $85,726 | $324 |
| Monthly Housing Costs | $401 | $0 |
| Real Estate Taxes | $490 | $69 |
Property Value by Mortgage Status in Denham Springs
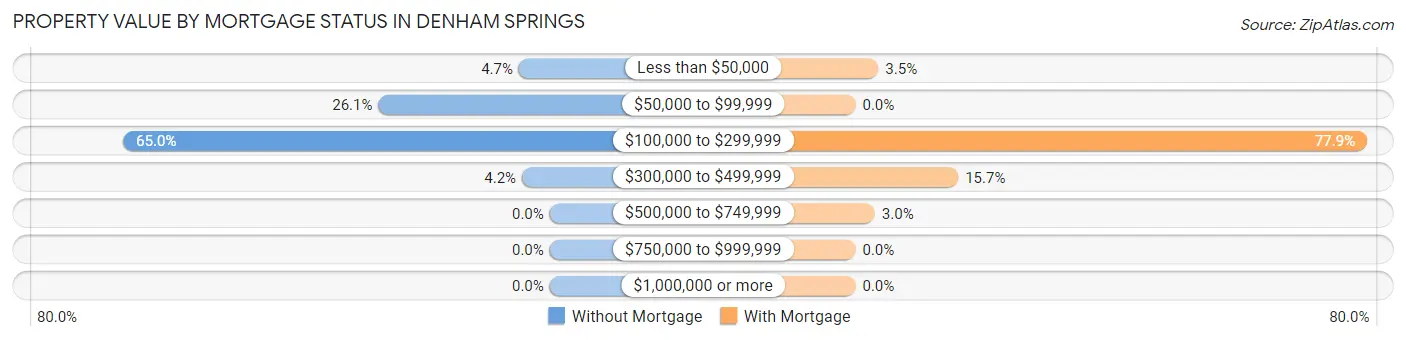
| Property Value | Without Mortgage | With Mortgage |
| Less than $50,000 | 61 (4.7%) | 46 (3.5%) |
| $50,000 to $99,999 | 340 (26.1%) | 0 (0.0%) |
| $100,000 to $299,999 | 846 (65.0%) | 1,031 (77.9%) |
| $300,000 to $499,999 | 55 (4.2%) | 207 (15.7%) |
| $500,000 to $749,999 | 0 (0.0%) | 39 (2.9%) |
| $750,000 to $999,999 | 0 (0.0%) | 0 (0.0%) |
| $1,000,000 or more | 0 (0.0%) | 0 (0.0%) |
| Total | 1,302 (100.0%) | 1,323 (100.0%) |
Household Income by Mortgage Status in Denham Springs
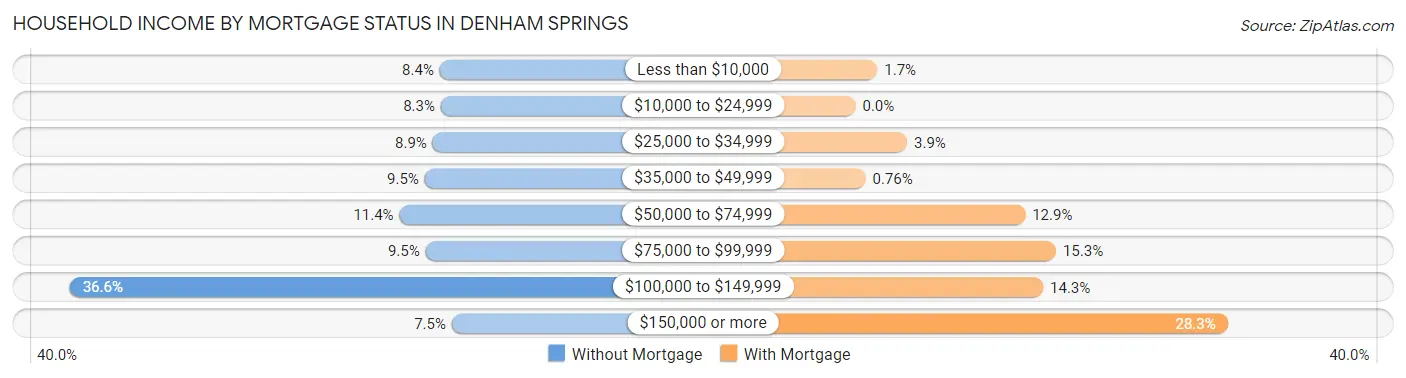
| Household Income | Without Mortgage | With Mortgage |
| Less than $10,000 | 109 (8.4%) | 22 (1.7%) |
| $10,000 to $24,999 | 108 (8.3%) | 0 (0.0%) |
| $25,000 to $34,999 | 116 (8.9%) | 52 (3.9%) |
| $35,000 to $49,999 | 124 (9.5%) | 10 (0.8%) |
| $50,000 to $74,999 | 149 (11.4%) | 171 (12.9%) |
| $75,000 to $99,999 | 123 (9.5%) | 202 (15.3%) |
| $100,000 to $149,999 | 476 (36.6%) | 189 (14.3%) |
| $150,000 or more | 97 (7.4%) | 375 (28.3%) |
| Total | 1,302 (100.0%) | 1,323 (100.0%) |
Property Value to Household Income Ratio in Denham Springs
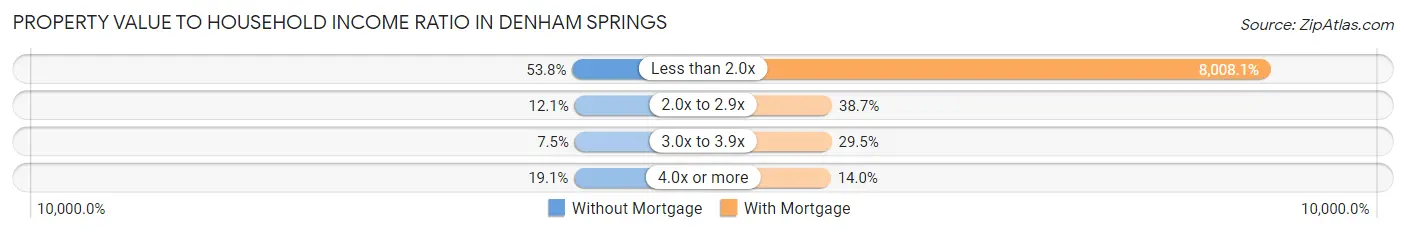
| Value-to-Income Ratio | Without Mortgage | With Mortgage |
| Less than 2.0x | 701 (53.8%) | 105,947 (8,008.1%) |
| 2.0x to 2.9x | 157 (12.1%) | 512 (38.7%) |
| 3.0x to 3.9x | 98 (7.5%) | 390 (29.5%) |
| 4.0x or more | 249 (19.1%) | 185 (14.0%) |
| Total | 1,302 (100.0%) | 1,323 (100.0%) |
Real Estate Taxes by Mortgage Status in Denham Springs
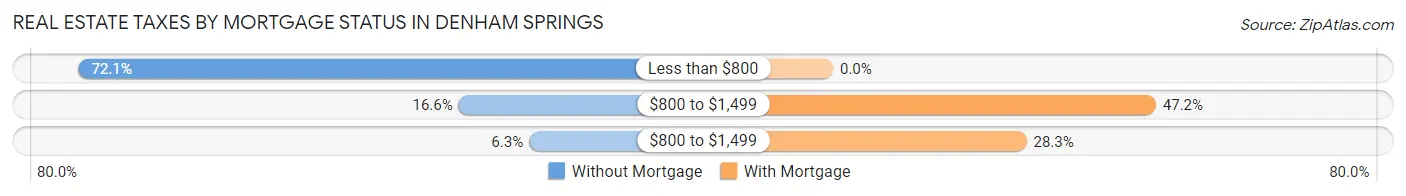
| Property Taxes | Without Mortgage | With Mortgage |
| Less than $800 | 939 (72.1%) | 0 (0.0%) |
| $800 to $1,499 | 216 (16.6%) | 624 (47.2%) |
| $800 to $1,499 | 82 (6.3%) | 374 (28.3%) |
| Total | 1,302 (100.0%) | 1,323 (100.0%) |
Health & Disability in Denham Springs
Health Insurance Coverage by Age in Denham Springs
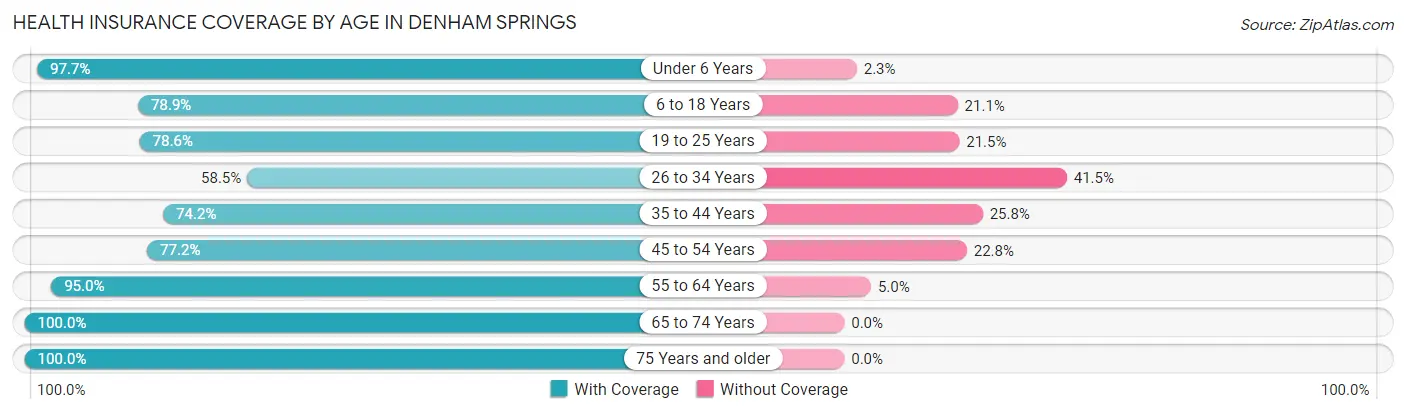
| Age Bracket | With Coverage | Without Coverage |
| Under 6 Years | 587 (97.7%) | 14 (2.3%) |
| 6 to 18 Years | 1,220 (78.9%) | 327 (21.1%) |
| 19 to 25 Years | 619 (78.5%) | 169 (21.4%) |
| 26 to 34 Years | 736 (58.5%) | 522 (41.5%) |
| 35 to 44 Years | 865 (74.2%) | 301 (25.8%) |
| 45 to 54 Years | 642 (77.2%) | 190 (22.8%) |
| 55 to 64 Years | 1,091 (95.0%) | 57 (5.0%) |
| 65 to 74 Years | 1,070 (100.0%) | 0 (0.0%) |
| 75 Years and older | 737 (100.0%) | 0 (0.0%) |
| Total | 7,567 (82.7%) | 1,580 (17.3%) |
Health Insurance Coverage by Citizenship Status in Denham Springs
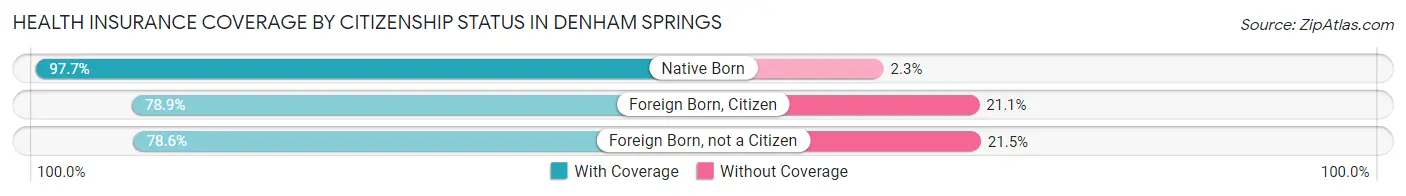
| Citizenship Status | With Coverage | Without Coverage |
| Native Born | 587 (97.7%) | 14 (2.3%) |
| Foreign Born, Citizen | 1,220 (78.9%) | 327 (21.1%) |
| Foreign Born, not a Citizen | 619 (78.5%) | 169 (21.4%) |
Health Insurance Coverage by Household Income in Denham Springs
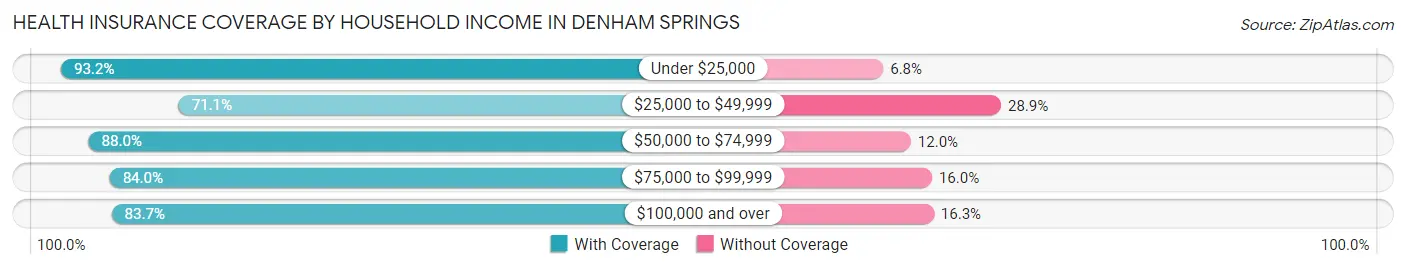
| Household Income | With Coverage | Without Coverage |
| Under $25,000 | 463 (93.2%) | 34 (6.8%) |
| $25,000 to $49,999 | 1,085 (71.1%) | 441 (28.9%) |
| $50,000 to $74,999 | 1,092 (88.0%) | 149 (12.0%) |
| $75,000 to $99,999 | 958 (84.0%) | 182 (16.0%) |
| $100,000 and over | 3,969 (83.7%) | 774 (16.3%) |
Public vs Private Health Insurance Coverage by Age in Denham Springs
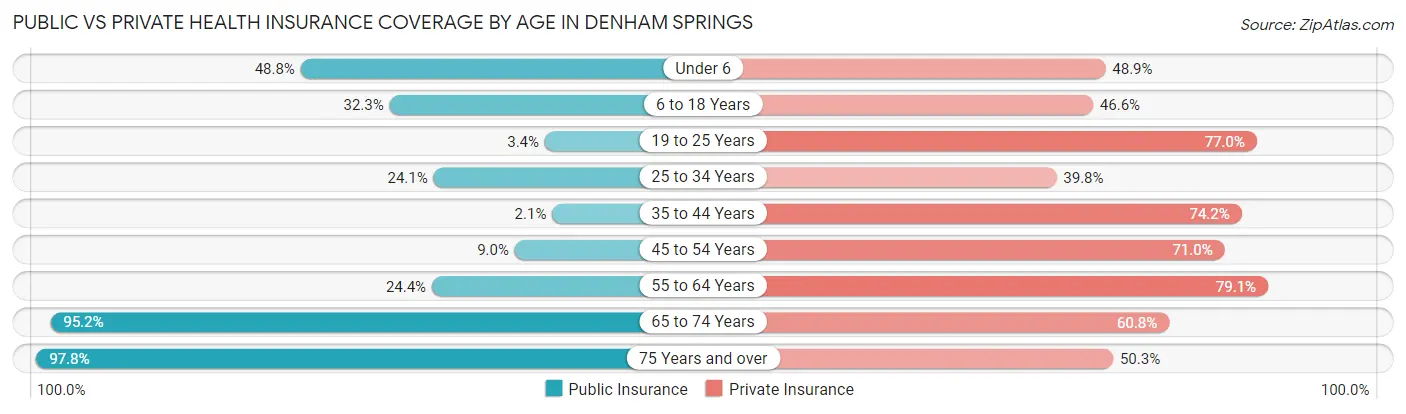
| Age Bracket | Public Insurance | Private Insurance |
| Under 6 | 293 (48.7%) | 294 (48.9%) |
| 6 to 18 Years | 499 (32.3%) | 721 (46.6%) |
| 19 to 25 Years | 27 (3.4%) | 607 (77.0%) |
| 25 to 34 Years | 303 (24.1%) | 501 (39.8%) |
| 35 to 44 Years | 24 (2.1%) | 865 (74.2%) |
| 45 to 54 Years | 75 (9.0%) | 591 (71.0%) |
| 55 to 64 Years | 280 (24.4%) | 908 (79.1%) |
| 65 to 74 Years | 1,019 (95.2%) | 650 (60.8%) |
| 75 Years and over | 721 (97.8%) | 371 (50.3%) |
| Total | 3,241 (35.4%) | 5,508 (60.2%) |
Disability Status by Sex by Age in Denham Springs
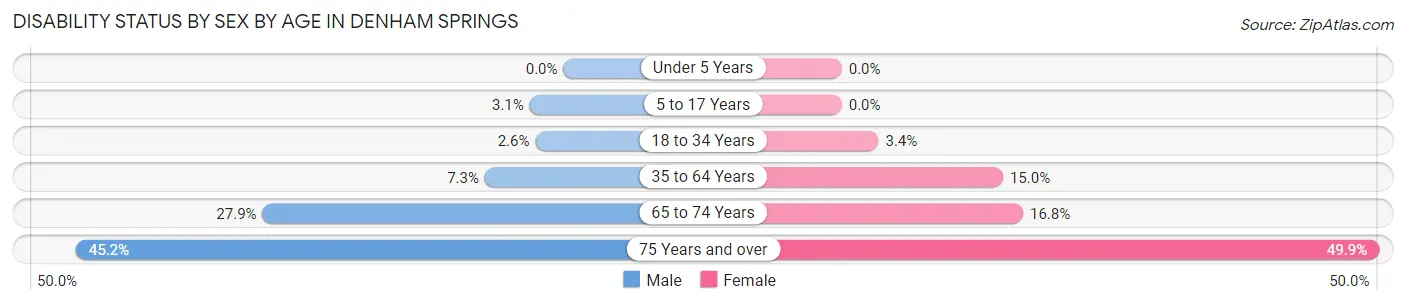
| Age Bracket | Male | Female |
| Under 5 Years | 0 (0.0%) | 0 (0.0%) |
| 5 to 17 Years | 20 (3.1%) | 0 (0.0%) |
| 18 to 34 Years | 28 (2.6%) | 35 (3.4%) |
| 35 to 64 Years | 110 (7.3%) | 245 (15.0%) |
| 65 to 74 Years | 93 (27.9%) | 124 (16.8%) |
| 75 Years and over | 171 (45.2%) | 179 (49.9%) |
Disability Class by Sex by Age in Denham Springs
Disability Class: Hearing Difficulty
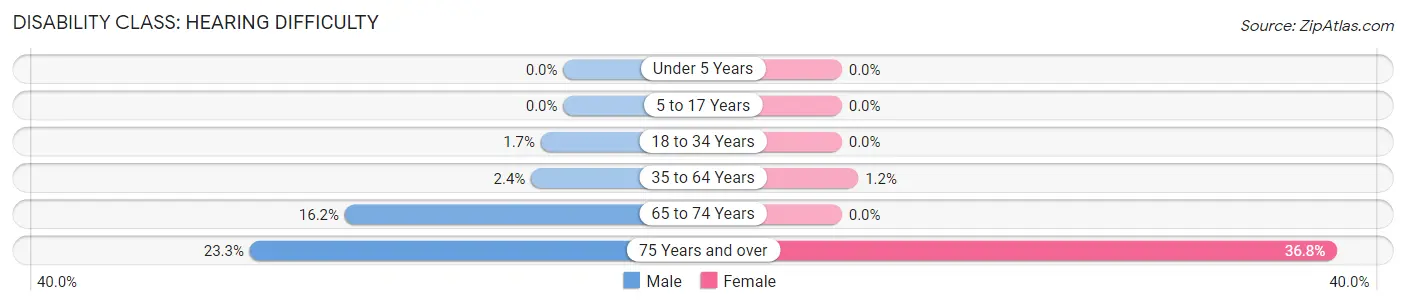
| Age Bracket | Male | Female |
| Under 5 Years | 0 (0.0%) | 0 (0.0%) |
| 5 to 17 Years | 0 (0.0%) | 0 (0.0%) |
| 18 to 34 Years | 18 (1.7%) | 0 (0.0%) |
| 35 to 64 Years | 36 (2.4%) | 20 (1.2%) |
| 65 to 74 Years | 54 (16.2%) | 0 (0.0%) |
| 75 Years and over | 88 (23.3%) | 132 (36.8%) |
Disability Class: Vision Difficulty
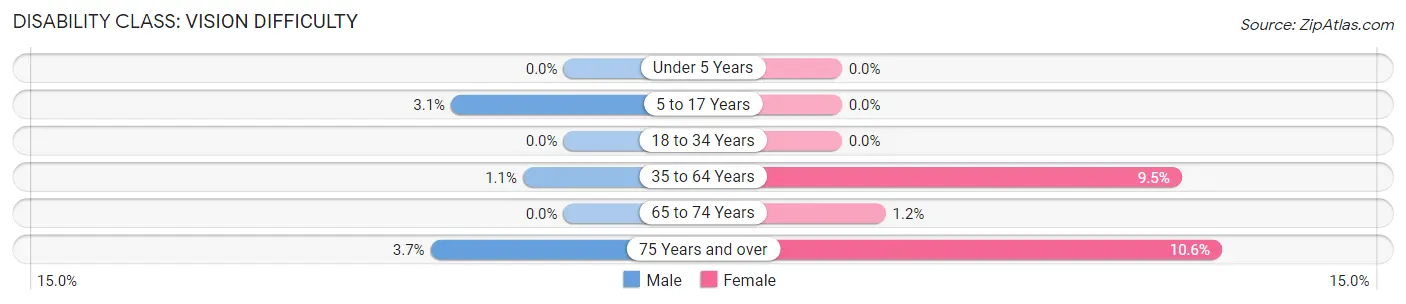
| Age Bracket | Male | Female |
| Under 5 Years | 0 (0.0%) | 0 (0.0%) |
| 5 to 17 Years | 20 (3.1%) | 0 (0.0%) |
| 18 to 34 Years | 0 (0.0%) | 0 (0.0%) |
| 35 to 64 Years | 17 (1.1%) | 155 (9.5%) |
| 65 to 74 Years | 0 (0.0%) | 9 (1.2%) |
| 75 Years and over | 14 (3.7%) | 38 (10.6%) |
Disability Class: Cognitive Difficulty
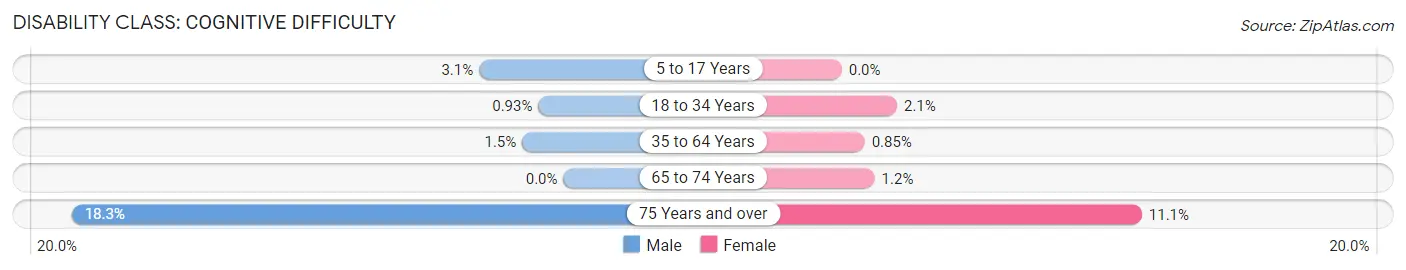
| Age Bracket | Male | Female |
| 5 to 17 Years | 20 (3.1%) | 0 (0.0%) |
| 18 to 34 Years | 10 (0.9%) | 21 (2.1%) |
| 35 to 64 Years | 23 (1.5%) | 14 (0.9%) |
| 65 to 74 Years | 0 (0.0%) | 9 (1.2%) |
| 75 Years and over | 69 (18.2%) | 40 (11.1%) |
Disability Class: Ambulatory Difficulty
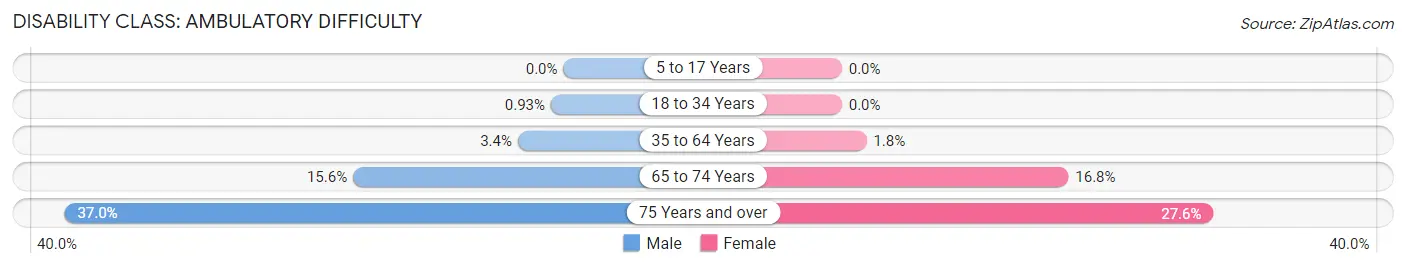
| Age Bracket | Male | Female |
| 5 to 17 Years | 0 (0.0%) | 0 (0.0%) |
| 18 to 34 Years | 10 (0.9%) | 0 (0.0%) |
| 35 to 64 Years | 51 (3.4%) | 30 (1.8%) |
| 65 to 74 Years | 52 (15.6%) | 124 (16.8%) |
| 75 Years and over | 140 (37.0%) | 99 (27.6%) |
Disability Class: Self-Care Difficulty
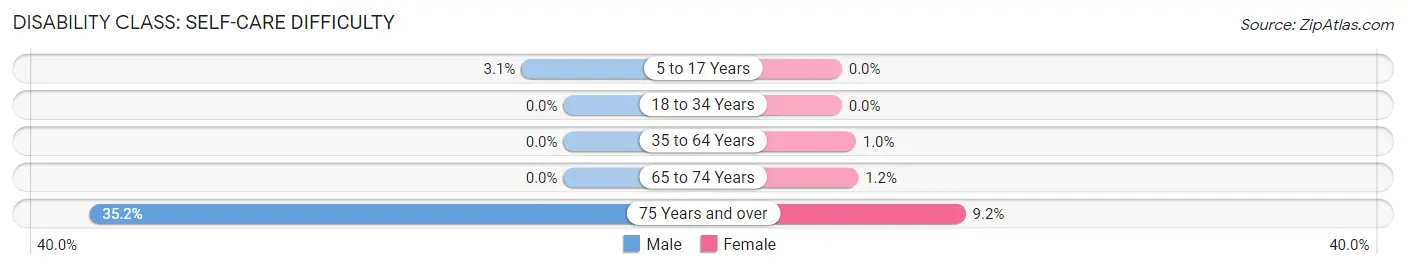
| Age Bracket | Male | Female |
| 5 to 17 Years | 20 (3.1%) | 0 (0.0%) |
| 18 to 34 Years | 0 (0.0%) | 0 (0.0%) |
| 35 to 64 Years | 0 (0.0%) | 17 (1.0%) |
| 65 to 74 Years | 0 (0.0%) | 9 (1.2%) |
| 75 Years and over | 133 (35.2%) | 33 (9.2%) |
Technology Access in Denham Springs
Computing Device Access in Denham Springs
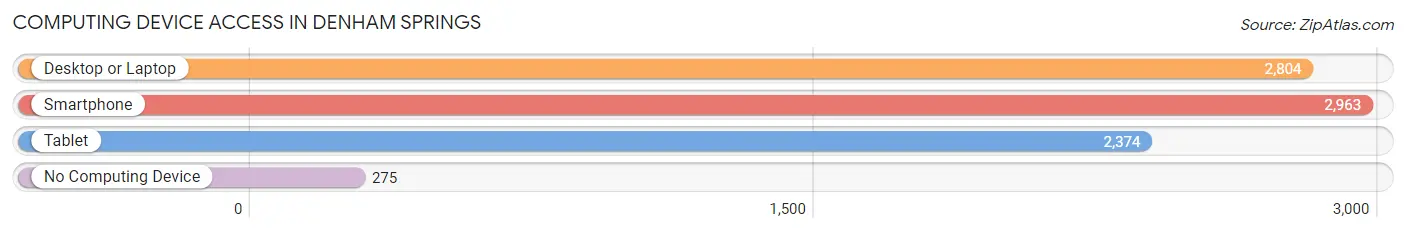
| Device Type | # Households | % Households |
| Desktop or Laptop | 2,804 | 76.3% |
| Smartphone | 2,963 | 80.6% |
| Tablet | 2,374 | 64.6% |
| No Computing Device | 275 | 7.5% |
| Total | 3,674 | 100.0% |
Internet Access in Denham Springs
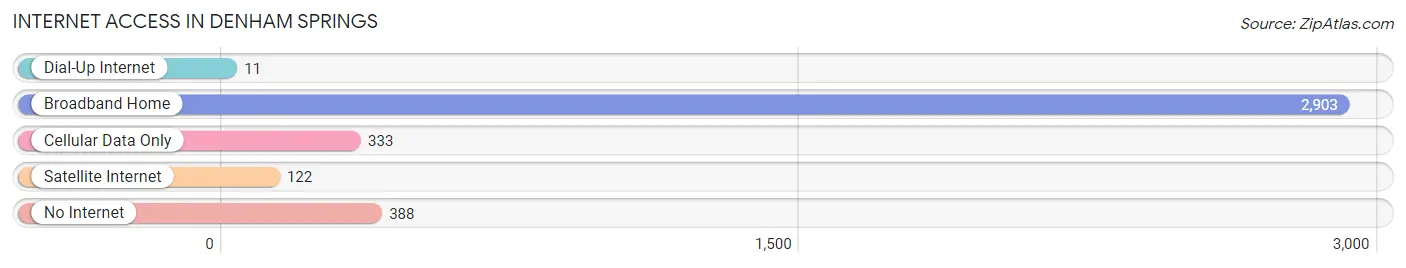
| Internet Type | # Households | % Households |
| Dial-Up Internet | 11 | 0.3% |
| Broadband Home | 2,903 | 79.0% |
| Cellular Data Only | 333 | 9.1% |
| Satellite Internet | 122 | 3.3% |
| No Internet | 388 | 10.6% |
| Total | 3,674 | 100.0% |
Denham Springs Summary
Denham Springs, Louisiana is a small city located in Livingston Parish, Louisiana. It is situated on the Amite River, approximately 20 miles east of Baton Rouge. The city is part of the Baton Rouge Metropolitan Statistical Area and has a population of approximately 10,215 people as of the 2010 census.
History
The area that is now Denham Springs was first settled in the early 1800s by French-Canadian immigrants. The town was originally known as Amite Springs, named after the nearby Amite River. In 1855, the town was renamed Denham Springs after the family of William Denham, who had purchased the land in 1854.
In the late 1800s, Denham Springs became a popular resort destination due to its natural springs. The town was also known for its mineral springs, which were believed to have healing properties. The town was also home to a number of businesses, including a hotel, a general store, and a sawmill.
In the early 1900s, Denham Springs began to experience rapid growth due to the construction of the Louisiana and Mississippi Railroad. The railroad connected Denham Springs to Baton Rouge and New Orleans, making it easier for people to travel to and from the town.
Geography
Denham Springs is located in Livingston Parish, Louisiana. It is situated on the Amite River, approximately 20 miles east of Baton Rouge. The city has a total area of 8.3 square miles, of which 8.2 square miles is land and 0.1 square miles is water.
The city is located in the humid subtropical climate zone, with hot, humid summers and mild winters. The average temperature in the summer is around 90°F, while the average temperature in the winter is around 50°F.
Economy
Denham Springs is home to a number of businesses, including retail stores, restaurants, and manufacturing companies. The city is also home to a number of industrial parks, which provide jobs for many of the city’s residents.
The city is also home to a number of tourist attractions, including the Denham Springs Antique Village, which is a collection of antique stores and restaurants. The city is also home to the Denham Springs Sportsman’s Park, which offers fishing, camping, and other outdoor activities.
Demographics
As of the 2010 census, Denham Springs had a population of 10,215 people. The racial makeup of the city was 79.2% White, 17.3% African American, 0.5% Native American, 0.7% Asian, 0.1% Pacific Islander, and 2.2% from other races. Hispanic or Latino of any race were 3.2% of the population.
The median household income in Denham Springs was $41,945, and the median family income was $50,945. The per capita income for the city was $20,945. About 15.2% of the population was below the poverty line.
Denham Springs is a small city with a rich history and a diverse economy. The city is home to a number of businesses, tourist attractions, and industrial parks, which provide jobs for many of the city’s residents. The city is also home to a diverse population, with a variety of racial and ethnic backgrounds.
Common Questions
What is Per Capita Income in Denham Springs?
Per Capita income in Denham Springs is $37,658.
What is the Median Family Income in Denham Springs?
Median Family Income in Denham Springs is $105,297.
What is the Median Household income in Denham Springs?
Median Household Income in Denham Springs is $85,625.
What is Income or Wage Gap in Denham Springs?
Income or Wage Gap in Denham Springs is 22.1%.
Women in Denham Springs earn 77.9 cents for every dollar earned by a man.
What is Inequality or Gini Index in Denham Springs?
Inequality or Gini Index in Denham Springs is 0.35.
What is the Total Population of Denham Springs?
Total Population of Denham Springs is 9,393.
What is the Total Male Population of Denham Springs?
Total Male Population of Denham Springs is 4,419.
What is the Total Female Population of Denham Springs?
Total Female Population of Denham Springs is 4,974.
What is the Ratio of Males per 100 Females in Denham Springs?
There are 88.84 Males per 100 Females in Denham Springs.
What is the Ratio of Females per 100 Males in Denham Springs?
There are 112.56 Females per 100 Males in Denham Springs.
What is the Median Population Age in Denham Springs?
Median Population Age in Denham Springs is 36.7 Years.
What is the Average Family Size in Denham Springs
Average Family Size in Denham Springs is 3.3 People.
What is the Average Household Size in Denham Springs
Average Household Size in Denham Springs is 2.5 People.
How Large is the Labor Force in Denham Springs?
There are 4,731 People in the Labor Forcein in Denham Springs.
What is the Percentage of People in the Labor Force in Denham Springs?
63.7% of People are in the Labor Force in Denham Springs.
What is the Unemployment Rate in Denham Springs?
Unemployment Rate in Denham Springs is 7.4%.