Zip Codes with the Highest Percentage of Population Employed in Installation, Maintenance & Repair in Denham Springs, LA
RELATED REPORTS & OPTIONS
Installation, Maintenance & Repair
Denham Springs
Compare Zip Codes
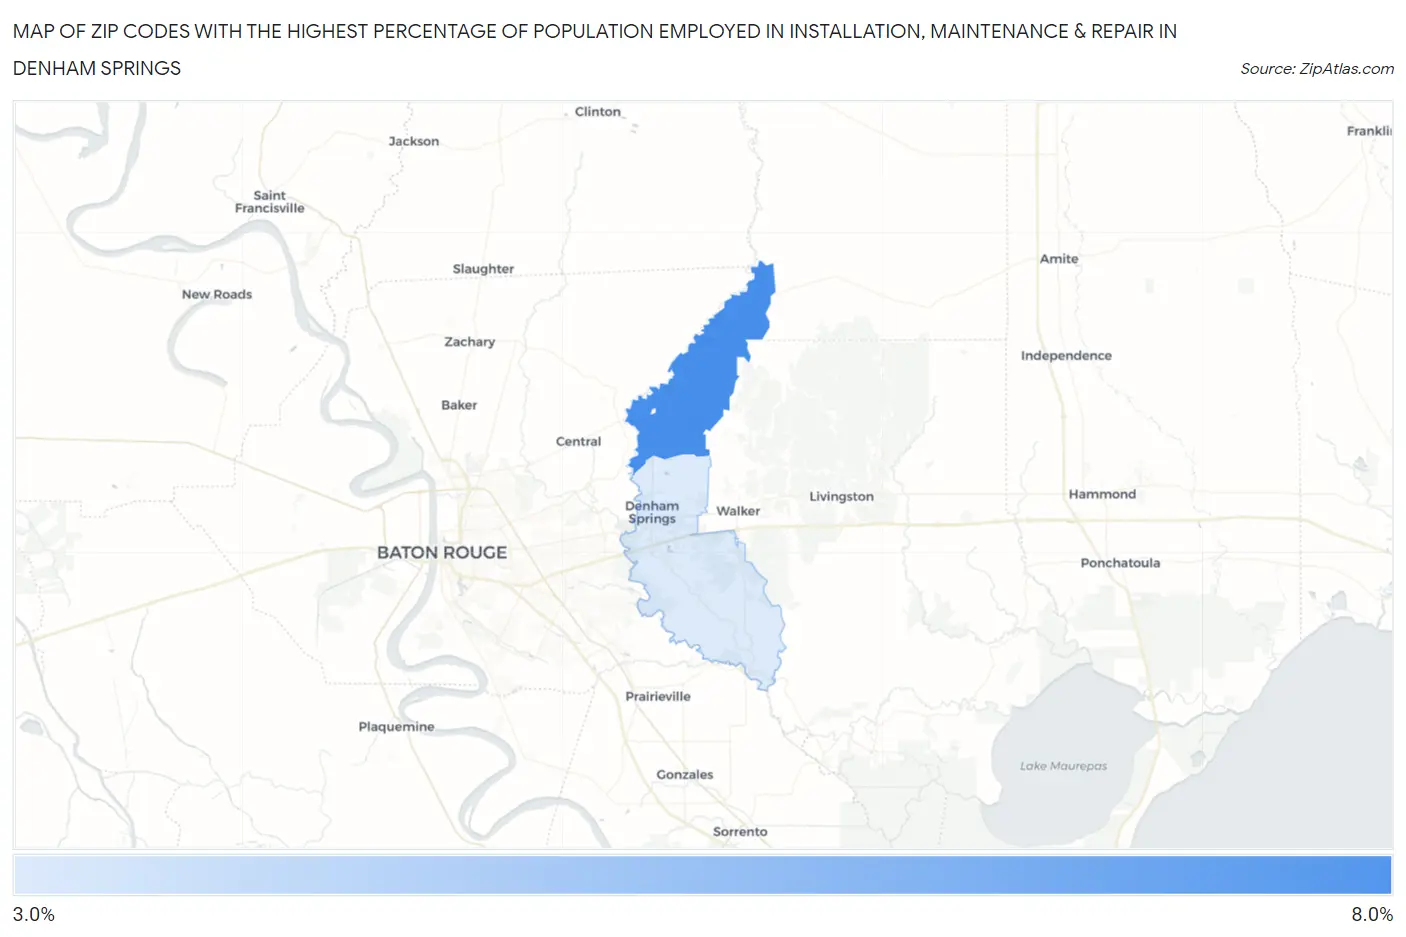
Map of Zip Codes with the Highest Percentage of Population Employed in Installation, Maintenance & Repair in Denham Springs
3.1%
7.0%
Zip Codes with the Highest Percentage of Population Employed in Installation, Maintenance & Repair in Denham Springs, LA
| Zip Code | % Employed | vs State | vs National | |
| 1. | 70706 | 7.0% | 3.7%(+3.32)#87 | 3.1%(+3.93)#4,426 |
| 2. | 70726 | 3.1% | 3.7%(-0.600)#297 | 3.1%(+0.012)#16,613 |
1
Common Questions
What are the Top Zip Codes with the Highest Percentage of Population Employed in Installation, Maintenance & Repair in Denham Springs, LA?
Top Zip Codes with the Highest Percentage of Population Employed in Installation, Maintenance & Repair in Denham Springs, LA are:
What zip code has the Highest Percentage of Population Employed in Installation, Maintenance & Repair in Denham Springs, LA?
70706 has the Highest Percentage of Population Employed in Installation, Maintenance & Repair in Denham Springs, LA with 7.0%.
What is the Percentage of Population Employed in Installation, Maintenance & Repair in Denham Springs, LA?
Percentage of Population Employed in Installation, Maintenance & Repair in Denham Springs is 2.4%.
What is the Percentage of Population Employed in Installation, Maintenance & Repair in Louisiana?
Percentage of Population Employed in Installation, Maintenance & Repair in Louisiana is 3.7%.
What is the Percentage of Population Employed in Installation, Maintenance & Repair in the United States?
Percentage of Population Employed in Installation, Maintenance & Repair in the United States is 3.1%.