Zip Codes with the Highest Percentage of Households Without a Vehicle in Denham Springs, LA
RELATED REPORTS & OPTIONS
Households without a Cars
Denham Springs
Compare Zip Codes
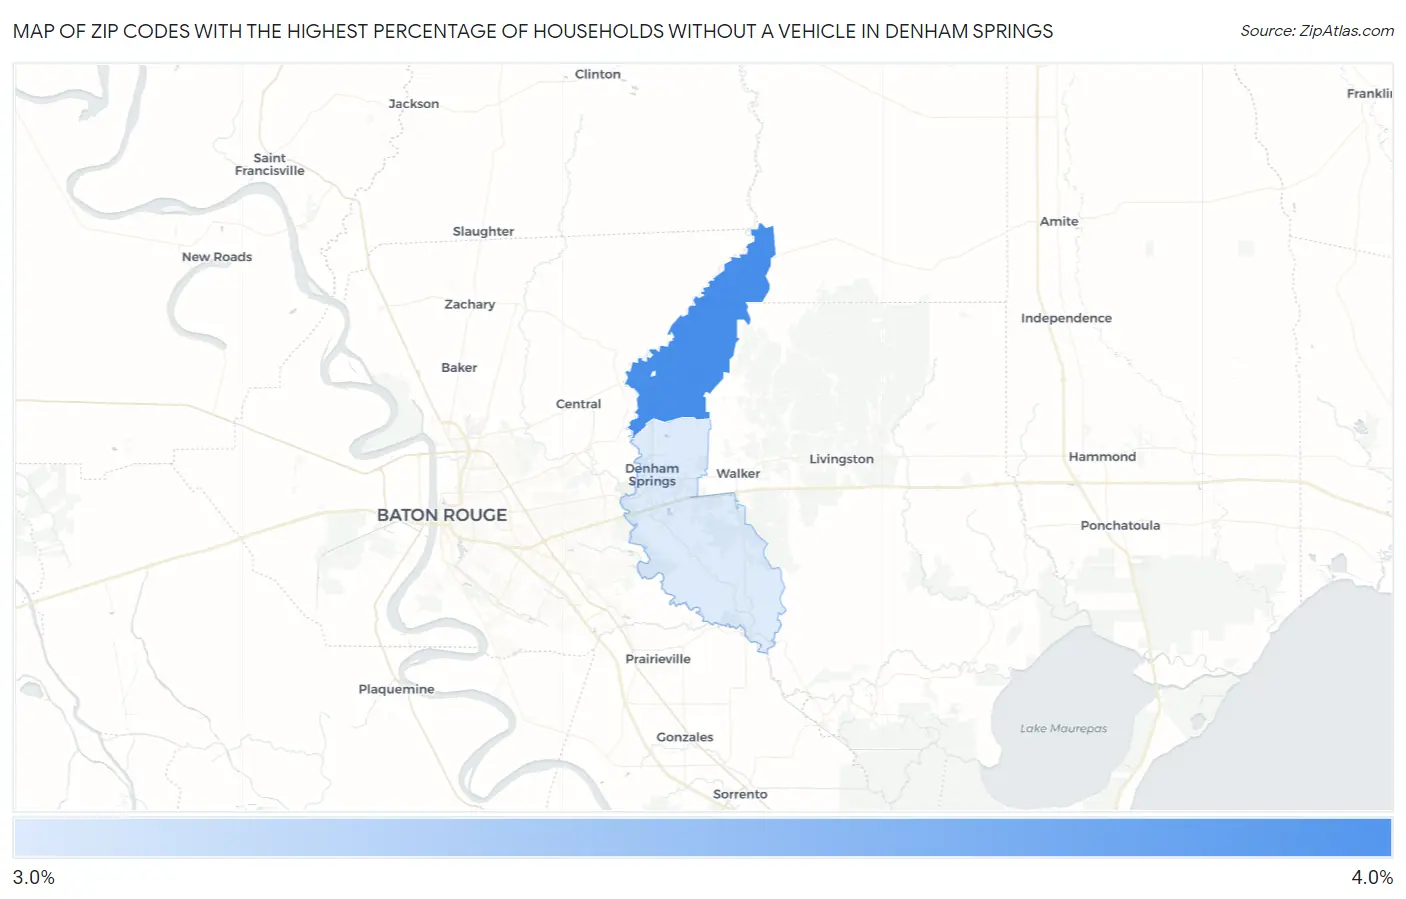
Map of Zip Codes with the Highest Percentage of Households Without a Vehicle in Denham Springs
3.8%
4.0%
Zip Codes with the Highest Percentage of Households Without a Vehicle in Denham Springs, LA
| Zip Code | Housholds Without a Car | vs State | vs National | |
| 1. | 70706 | 4.0% | 8.3%(-4.30)#327 | 8.3%(-4.30)#15,736 |
| 2. | 70726 | 3.8% | 8.3%(-4.50)#334 | 8.3%(-4.50)#16,308 |
1
Common Questions
What are the Top Zip Codes with the Highest Percentage of Households Without a Vehicle in Denham Springs, LA?
Top Zip Codes with the Highest Percentage of Households Without a Vehicle in Denham Springs, LA are:
What zip code has the Highest Percentage of Households Without a Vehicle in Denham Springs, LA?
70706 has the Highest Percentage of Households Without a Vehicle in Denham Springs, LA with 4.0%.
What is the Percentage of Households Without a Vehicle in Denham Springs, LA?
Percentage of Households Without a Vehicle in Denham Springs is 6.3%.
What is the Percentage of Households Without a Vehicle in Louisiana?
Percentage of Households Without a Vehicle in Louisiana is 8.3%.
What is the Percentage of Households Without a Vehicle in the United States?
Percentage of Households Without a Vehicle in the United States is 8.3%.