Zip Codes with the Highest Percentage of Self-Employed / Incorporated in Wichita, KS

RELATED REPORTS & OPTIONS

Self-Employed / Incorporated
Population
Families and Households
Female Fertility
Female Fertility (Unmarried)
Race (Community Size)
Race (Percentage)
Ancestry (Community Size)
AfricanAlaska NativeAmericanApacheArabArapahoArgentineanArmenianAustralianAustrianBangladeshiBarbadianBelgianBhutaneseBlackfeetBolivianBrazilianBritishBulgarianBurmeseCajunCanadianCelticCentral AmericanCentral American IndianCherokeeCheyenneChickasawChileanChippewaChoctawColombianComancheCosta RicanCreekCroatianCubanCzechCzechoslovakianDanishDelawareDominicanDutchDutch West IndianEastern EuropeanEcuadorianEgyptianEnglishEthiopianEuropeanFilipinoFinnishFrenchFrench American IndianFrench CanadianGermanGerman RussianGhanaianGreekGuamanian / ChamorroGuatemalanHaitianHonduranHungarianIcelanderIndian (Asian)IndonesianInupiatIranianIrishIroquoisItalianJamaicanJapaneseJordanianKenyanKiowaKoreanLaotianLebaneseLithuanianLuxembourgerMalaysianMexicanMexican American IndianMongolianMoroccanNative HawaiianNavajoNicaraguanNigerianNorthern EuropeanNorwegianOsageOttawaPakistaniPalestinianPanamanianParaguayanPennsylvania GermanPeruvianPimaPolishPortuguesePotawatomiPuebloPuerto RicanRomanianRussianSalvadoranSamoanScandinavianScotch-IrishScottishSeminoleSiouxSlavicSlovakSloveneSouth AfricanSouth AmericanSpaniardSpanishSpanish AmericanSpanish American IndianSri LankanSubsaharan AfricanSwedishSwissSyrianThaiTrinidadian and TobagonianTurkishUgandanUkrainianVenezuelanWelshWest IndianYugoslavian
Ancestry (Percentage)
AfricanAlaska NativeAmericanApacheArabArapahoArgentineanArmenianAustralianAustrianBangladeshiBarbadianBelgianBhutaneseBlackfeetBolivianBrazilianBritishBulgarianBurmeseCajunCanadianCelticCentral AmericanCentral American IndianCherokeeCheyenneChickasawChileanChippewaChoctawColombianComancheCosta RicanCreekCroatianCubanCzechCzechoslovakianDanishDelawareDominicanDutchDutch West IndianEastern EuropeanEcuadorianEgyptianEnglishEthiopianEuropeanFilipinoFinnishFrenchFrench American IndianFrench CanadianGermanGerman RussianGhanaianGreekGuamanian / ChamorroGuatemalanHaitianHonduranHungarianIcelanderIndian (Asian)IndonesianInupiatIranianIrishIroquoisItalianJamaicanJapaneseJordanianKenyanKiowaKoreanLaotianLebaneseLithuanianLuxembourgerMalaysianMexicanMexican American IndianMongolianMoroccanNative HawaiianNavajoNicaraguanNigerianNorthern EuropeanNorwegianOsageOttawaPakistaniPalestinianPanamanianParaguayanPennsylvania GermanPeruvianPimaPolishPortuguesePotawatomiPuebloPuerto RicanRomanianRussianSalvadoranSamoanScandinavianScotch-IrishScottishSeminoleSiouxSlavicSlovakSloveneSouth AfricanSouth AmericanSpaniardSpanishSpanish AmericanSpanish American IndianSri LankanSubsaharan AfricanSwedishSwissSyrianThaiTrinidadian and TobagonianTurkishUgandanUkrainianVenezuelanWelshWest IndianYugoslavian
Immigrant Origin (Total)
Immigrant Origin (Percentage)
Income
Income (Families)
Income (Households)
Poverty
Poverty (Families)
Unemployment
Employment Occupations
Employment Industries
Employer Class
Commute Time
Commute Means
School Enrollment
Education by Degree Field
Occupancy
Finances
Physical Characteristics
Wichita
Compare Zip Codes
Comparison Subject

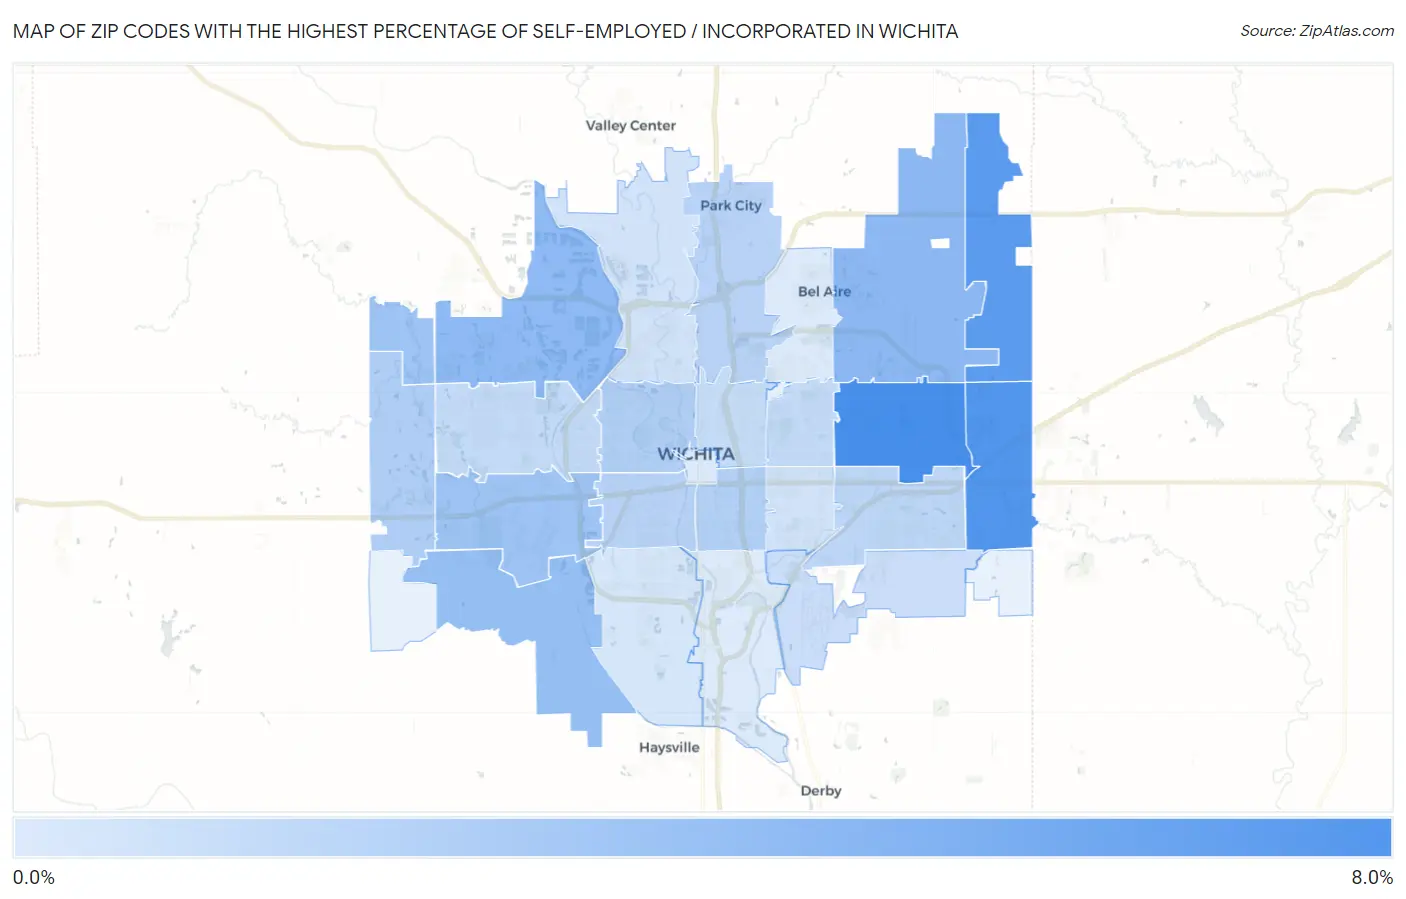
Map of Zip Codes with the Highest Percentage of Self-Employed / Incorporated in Wichita

0.0%
8.0%
Zip Codes with the Highest Percentage of Self-Employed / Incorporated in Wichita Map

Zip Codes with the Highest Percentage of Self-Employed / Incorporated in Wichita, KS

Zip Code % Self-Employed / Incorporated vs State vs National
1.672067.4%3.4%(+4.05)#1303.8%(+3.61)#4,239
2.672307.0%3.4%(+3.59)#1423.8%(+3.15)#4,809
3.672286.5%3.4%(+3.13)#1513.8%(+2.69)#5,474
4.672264.5%3.4%(+1.13)#2113.8%(+0.686)#10,089
5.672054.5%3.4%(+1.10)#2123.8%(+0.659)#10,182
6.672154.2%3.4%(+0.790)#2353.8%(+0.348)#11,291
7.672093.8%3.4%(+0.440)#2613.8%(-0.001)#12,692
8.672233.7%3.4%(+0.349)#2743.8%(-0.092)#13,086
9.672353.1%3.4%(-0.277)#3273.8%(-0.719)#15,896
10.672033.1%3.4%(-0.323)#3283.8%(-0.764)#16,116
11.672112.9%3.4%(-0.451)#3413.8%(-0.892)#16,777
12.672132.8%3.4%(-0.614)#3543.8%(-1.06)#17,565
13.672192.7%3.4%(-0.675)#3633.8%(-1.12)#17,876
14.672072.5%3.4%(-0.837)#3773.8%(-1.28)#18,714
15.672082.3%3.4%(-1.08)#4033.8%(-1.52)#19,899
16.672122.2%3.4%(-1.14)#4073.8%(-1.58)#20,170
17.672142.2%3.4%(-1.19)#4153.8%(-1.64)#20,469
18.672102.0%3.4%(-1.35)#4293.8%(-1.80)#21,266
19.672041.7%3.4%(-1.68)#4543.8%(-2.12)#22,677
20.672181.7%3.4%(-1.70)#4573.8%(-2.14)#22,794
21.672171.5%3.4%(-1.87)#4773.8%(-2.32)#23,479
22.672021.3%3.4%(-2.08)#4943.8%(-2.53)#24,289
23.672161.2%3.4%(-2.13)#4993.8%(-2.57)#24,442
24.672201.2%3.4%(-2.13)#5003.8%(-2.57)#24,447

Common Questions

What are the Top 10 Zip Codes with the Highest Percentage of Self-Employed / Incorporated in Wichita, KS?
Top 10 Zip Codes with the Highest Percentage of Self-Employed / Incorporated in Wichita, KS are:
#1
7.4%
#2
7.0%
#3
6.5%
#4
4.5%
#5
4.5%
#6
4.2%
#7
3.8%
#8
3.7%
#9
3.1%
#10
3.1%
What zip code has the Highest Percentage of Self-Employed / Incorporated in Wichita, KS?
67206 has the Highest Percentage of Self-Employed / Incorporated in Wichita, KS with 7.4%.
What is the Percentage of Self-Employed / Incorporated in Wichita, KS?
Percentage of Self-Employed / Incorporated in Wichita is 2.9%.
What is the Percentage of Self-Employed / Incorporated in Kansas?
Percentage of Self-Employed / Incorporated in Kansas is 3.4%.
What is the Percentage of Self-Employed / Incorporated in the United States?
Percentage of Self-Employed / Incorporated in the United States is 3.8%.