U.S. Virgin Islander vs Immigrants from Panama Wage/Income Gap

COMPARE

U.S. Virgin Islander
Race
Ancestry
AfghanAfricanAlaska NativeAlaskan AthabascanAlbanianAleutAlsatianAmericanApacheArabArapahoArgentineanArmenianAssyrian/Chaldean/SyriacAustralianAustrianBahamianBangladeshiBarbadianBasqueBelgianBelizeanBermudanBhutaneseBlackfeetBolivianBrazilianBritishBritish West IndianBulgarianBurmeseCajunCambodianCanadianCape VerdeanCarpatho RusynCelticCentral AmericanCentral American IndianCherokeeCheyenneChickasawChileanChineseChippewaChoctawColombianColvilleComancheCosta RicanCreeCreekCroatianCrowCubanCypriotCzechCzechoslovakianDanishDelawareDominicanDutchDutch West IndianEastern EuropeanEcuadorianEgyptianEnglishEstonianEthiopianEuropeanFijianFilipinoFinnishFrenchFrench American IndianFrench CanadianGermanGerman RussianGhanaianGreekGuamanian/ChamorroGuatemalanGuyaneseHaitianHmongHonduranHopiHoumaHungarianIcelanderIndian (Asian)IndonesianInupiatIranianIraqiIrishIroquoisIsraeliItalianJamaicanJapaneseJordanianKenyanKiowaKoreanLaotianLatvianLebaneseLiberianLithuanianLumbeeLuxembourgerMacedonianMalaysianMalteseMarshalleseMenomineeMexicanMexican American IndianMongolianMoroccanNative HawaiianNavajoNepaleseNew ZealanderNicaraguanNigerianNorthern EuropeanNorwegianOkinawanOsageOttawaPaiutePakistaniPalestinianPanamanianParaguayanPennsylvania GermanPeruvianPimaPolishPortuguesePotawatomiPuebloPuerto RicanPuget Sound SalishRomanianRussianSalvadoranSamoanScandinavianScotch-IrishScottishSeminoleSenegaleseSerbianShoshoneSierra LeoneanSiouxSlavicSlovakSloveneSomaliSouth AfricanSouth AmericanSouth American IndianSoviet UnionSpaniardSpanishSpanish AmericanSpanish American IndianSri LankanSubsaharan AfricanSudaneseSwedishSwissSyrianTaiwaneseThaiTlingit-HaidaTohono O'OdhamTonganTrinidadian and TobagonianTsimshianTurkishU.S. Virgin IslanderUgandanUkrainianUruguayanUteVenezuelanVietnameseWelshWest IndianYakamaYaquiYugoslavianYumanYup'ikZimbabwean
Immigration
NonimmigrantsImmigrantsAfghanistanAfricaAlbaniaArgentinaArmeniaAsiaAustraliaAustriaBahamasBangladeshBarbadosBelarusBelgiumBelizeBoliviaBosnia and HerzegovinaBrazilBulgariaBurma/MyanmarCabo VerdeCambodiaCameroonCanadaCaribbeanCentral AmericaChileChinaColombiaCongoCosta RicaCroatiaCubaCzechoslovakiaDenmarkDominicaDominican RepublicEastern AfricaEastern AsiaEastern EuropeEcuadorEgyptEl SalvadorEnglandEritreaEthiopiaEuropeFijiFranceGermanyGhanaGreeceGrenadaGuatemalaGuyanaHaitiHondurasHong KongHungaryIndiaIndonesiaIranIraqIrelandIsraelItalyJamaicaJapanJordanKazakhstanKenyaKoreaKuwaitLaosLatin AmericaLatviaLebanonLiberiaLithuaniaMalaysiaMexicoMicronesiaMiddle AfricaMoldovaMoroccoNepalNetherlandsNicaraguaNigeriaNorth AmericaNorth MacedoniaNorthern AfricaNorthern EuropeNorwayOceaniaPakistanPeruPhilippinesPolandPortugalRomaniaRussiaSaudi ArabiaScotlandSenegalSerbiaSierra LeoneSingaporeSomaliaSouth AfricaSouth AmericaSouth Central AsiaSouth Eastern AsiaSouthern EuropeSpainSri LankaSt. Vincent and the GrenadinesSudanSwedenSwitzerlandSyriaTaiwanThailandTrinidad and TobagoTurkeyUgandaUkraineUruguayUzbekistanVenezuelaVietnamWest IndiesWestern AfricaWestern AsiaWestern EuropeYemenZaireZimbabweAzores
Immigrants from Panama
Race
Ancestry
AfghanAfricanAlaska NativeAlaskan AthabascanAlbanianAleutAlsatianAmericanApacheArabArapahoArgentineanArmenianAssyrian/Chaldean/SyriacAustralianAustrianBahamianBangladeshiBarbadianBasqueBelgianBelizeanBermudanBhutaneseBlackfeetBolivianBrazilianBritishBritish West IndianBulgarianBurmeseCajunCambodianCanadianCape VerdeanCarpatho RusynCelticCentral AmericanCentral American IndianCherokeeCheyenneChickasawChileanChineseChippewaChoctawColombianColvilleComancheCosta RicanCreeCreekCroatianCrowCubanCypriotCzechCzechoslovakianDanishDelawareDominicanDutchDutch West IndianEastern EuropeanEcuadorianEgyptianEnglishEstonianEthiopianEuropeanFijianFilipinoFinnishFrenchFrench American IndianFrench CanadianGermanGerman RussianGhanaianGreekGuamanian/ChamorroGuatemalanGuyaneseHaitianHmongHonduranHopiHoumaHungarianIcelanderIndian (Asian)IndonesianInupiatIranianIraqiIrishIroquoisIsraeliItalianJamaicanJapaneseJordanianKenyanKiowaKoreanLaotianLatvianLebaneseLiberianLithuanianLumbeeLuxembourgerMacedonianMalaysianMalteseMarshalleseMenomineeMexicanMexican American IndianMongolianMoroccanNative HawaiianNavajoNepaleseNew ZealanderNicaraguanNigerianNorthern EuropeanNorwegianOkinawanOsageOttawaPaiutePakistaniPalestinianPanamanianParaguayanPennsylvania GermanPeruvianPimaPolishPortuguesePotawatomiPuebloPuerto RicanPuget Sound SalishRomanianRussianSalvadoranSamoanScandinavianScotch-IrishScottishSeminoleSenegaleseSerbianShoshoneSierra LeoneanSiouxSlavicSlovakSloveneSomaliSouth AfricanSouth AmericanSouth American IndianSoviet UnionSpaniardSpanishSpanish AmericanSpanish American IndianSri LankanSubsaharan AfricanSudaneseSwedishSwissSyrianTaiwaneseThaiTlingit-HaidaTohono O'OdhamTonganTrinidadian and TobagonianTsimshianTurkishUgandanUkrainianUruguayanUteVenezuelanVietnameseWelshWest IndianYakamaYaquiYugoslavianYumanYup'ikZimbabwean
Immigration
NonimmigrantsImmigrantsAfghanistanAfricaAlbaniaArgentinaArmeniaAsiaAustraliaAustriaBahamasBangladeshBarbadosBelarusBelgiumBelizeBoliviaBosnia and HerzegovinaBrazilBulgariaBurma/MyanmarCabo VerdeCambodiaCameroonCanadaCaribbeanCentral AmericaChileChinaColombiaCongoCosta RicaCroatiaCubaCzechoslovakiaDenmarkDominicaDominican RepublicEastern AfricaEastern AsiaEastern EuropeEcuadorEgyptEl SalvadorEnglandEritreaEthiopiaEuropeFijiFranceGermanyGhanaGreeceGrenadaGuatemalaGuyanaHaitiHondurasHong KongHungaryIndiaIndonesiaIranIraqIrelandIsraelItalyJamaicaJapanJordanKazakhstanKenyaKoreaKuwaitLaosLatin AmericaLatviaLebanonLiberiaLithuaniaMalaysiaMexicoMicronesiaMiddle AfricaMoldovaMoroccoNepalNetherlandsNicaraguaNigeriaNorth AmericaNorth MacedoniaNorthern AfricaNorthern EuropeNorwayOceaniaPakistanPanamaPeruPhilippinesPolandPortugalRomaniaRussiaSaudi ArabiaScotlandSenegalSerbiaSierra LeoneSingaporeSomaliaSouth AfricaSouth AmericaSouth Central AsiaSouth Eastern AsiaSouthern EuropeSpainSri LankaSt. Vincent and the GrenadinesSudanSwedenSwitzerlandSyriaTaiwanThailandTrinidad and TobagoTurkeyUgandaUkraineUruguayUzbekistanVenezuelaVietnamWest IndiesWestern AfricaWestern AsiaWestern EuropeYemenZaireZimbabweAzores
Wage/Income Gap
Income
Poverty
Unemployment
Labor Participation
Family Structure
Vehicle Availability
Education Level
Disability

Wage/Income Gap Comparison

U.S. Virgin Islanders

Immigrants from Panama

Exceptional
Exceptional
21.5%
WAGE/INCOME GAP
100.0/ 100
METRIC RATING
45th/ 347
METRIC RANK
23.4%
WAGE/INCOME GAP
99.6/ 100
METRIC RATING
88th/ 347
METRIC RANK

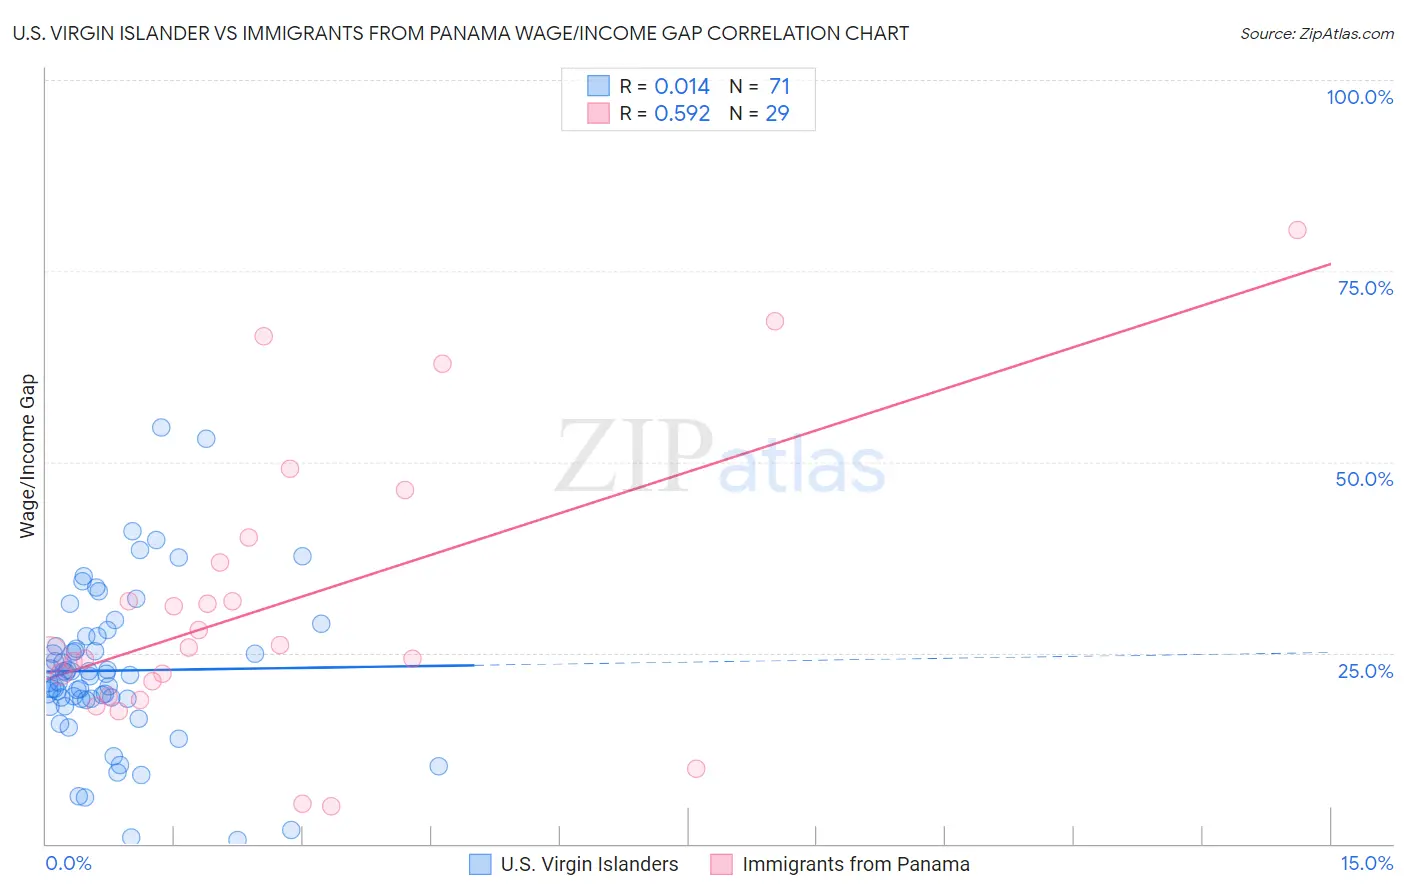
U.S. Virgin Islander vs Immigrants from Panama Wage/Income Gap Correlation Chart

The statistical analysis conducted on geographies consisting of 87,518,353 people shows no correlation between the proportion of U.S. Virgin Islanders and wage/income gap percentage in the United States with a correlation coefficient (R) of 0.014 and weighted average of 21.5%. Similarly, the statistical analysis conducted on geographies consisting of 221,125,355 people shows a substantial positive correlation between the proportion of Immigrants from Panama and wage/income gap percentage in the United States with a correlation coefficient (R) of 0.592 and weighted average of 23.4%, a difference of 8.7%.
U.S. Virgin Islander vs Immigrants from Panama Wage/Income Gap

Wage/Income Gap Correlation Summary

MeasurementU.S. Virgin IslanderImmigrants from Panama
Minimum0.43%5.0%
Maximum54.4%80.4%
Range54.0%75.4%
Mean22.7%31.5%
Median22.1%25.7%
Interquartile 25% (IQ1)18.9%20.3%
Interquartile 75% (IQ3)27.2%38.5%
Interquartile Range (IQR)8.2%18.2%
Standard Deviation (Sample)10.2%18.6%
Standard Deviation (Population)10.1%18.3%

Similar Demographics by Wage/Income Gap

Demographics Similar to U.S. Virgin Islanders by Wage/Income Gap

In terms of wage/income gap, the demographic groups most similar to U.S. Virgin Islanders are Immigrants from Ethiopia (21.6%, a difference of 0.12%), Immigrants from Eritrea (21.4%, a difference of 0.44%), Sierra Leonean (21.4%, a difference of 0.46%), Liberian (21.4%, a difference of 0.52%), and Immigrants from Sierra Leone (21.4%, a difference of 0.52%).
DemographicsRating | RankWage/Income Gap
Immigrants | Belize
100.0
/100
|
#38
Exceptional
21.3%
Colville
100.0
/100
|
#39
Exceptional
21.3%
Lumbee
100.0
/100
|
#40
Exceptional
21.3%
Liberians
100.0
/100
|
#41
Exceptional
21.4%
Immigrants | Sierra Leone
100.0
/100
|
#42
Exceptional
21.4%
Sierra Leoneans
100.0
/100
|
#43
Exceptional
21.4%
Immigrants | Eritrea
100.0
/100
|
#44
Exceptional
21.4%
U.S. Virgin Islanders
100.0
/100
|
#45
Exceptional
21.5%
Immigrants | Ethiopia
100.0
/100
|
#46
Exceptional
21.6%
Immigrants | Congo
100.0
/100
|
#47
Exceptional
21.7%
Blacks/African Americans
100.0
/100
|
#48
Exceptional
21.7%
Ethiopians
100.0
/100
|
#49
Exceptional
21.8%
Immigrants | Western Africa
100.0
/100
|
#50
Exceptional
22.0%
Tohono O'odham
100.0
/100
|
#51
Exceptional
22.1%
Immigrants | Cameroon
100.0
/100
|
#52
Exceptional
22.2%

Demographics Similar to Immigrants from Panama by Wage/Income Gap

In terms of wage/income gap, the demographic groups most similar to Immigrants from Panama are Marshallese (23.4%, a difference of 0.090%), Nicaraguan (23.4%, a difference of 0.10%), Arapaho (23.5%, a difference of 0.24%), Yuman (23.3%, a difference of 0.32%), and Cheyenne (23.3%, a difference of 0.37%).
DemographicsRating | RankWage/Income Gap
Bermudans
99.8
/100
|
#81
Exceptional
23.1%
Central Americans
99.8
/100
|
#82
Exceptional
23.1%
Immigrants | Africa
99.8
/100
|
#83
Exceptional
23.2%
Cubans
99.7
/100
|
#84
Exceptional
23.3%
Immigrants | Cambodia
99.7
/100
|
#85
Exceptional
23.3%
Cheyenne
99.7
/100
|
#86
Exceptional
23.3%
Yuman
99.7
/100
|
#87
Exceptional
23.3%
Immigrants | Panama
99.6
/100
|
#88
Exceptional
23.4%
Marshallese
99.6
/100
|
#89
Exceptional
23.4%
Nicaraguans
99.6
/100
|
#90
Exceptional
23.4%
Arapaho
99.6
/100
|
#91
Exceptional
23.5%
Immigrants | Honduras
99.5
/100
|
#92
Exceptional
23.5%
Immigrants | Cabo Verde
99.5
/100
|
#93
Exceptional
23.6%
Hondurans
99.5
/100
|
#94
Exceptional
23.6%
Cape Verdeans
99.4
/100
|
#95
Exceptional
23.6%