Zip Codes with the Highest Percentage of Population Employed in Arts, Media & Entertainment in Danville, IL
RELATED REPORTS & OPTIONS
Arts, Media & Entertainment
Danville
Compare Zip Codes
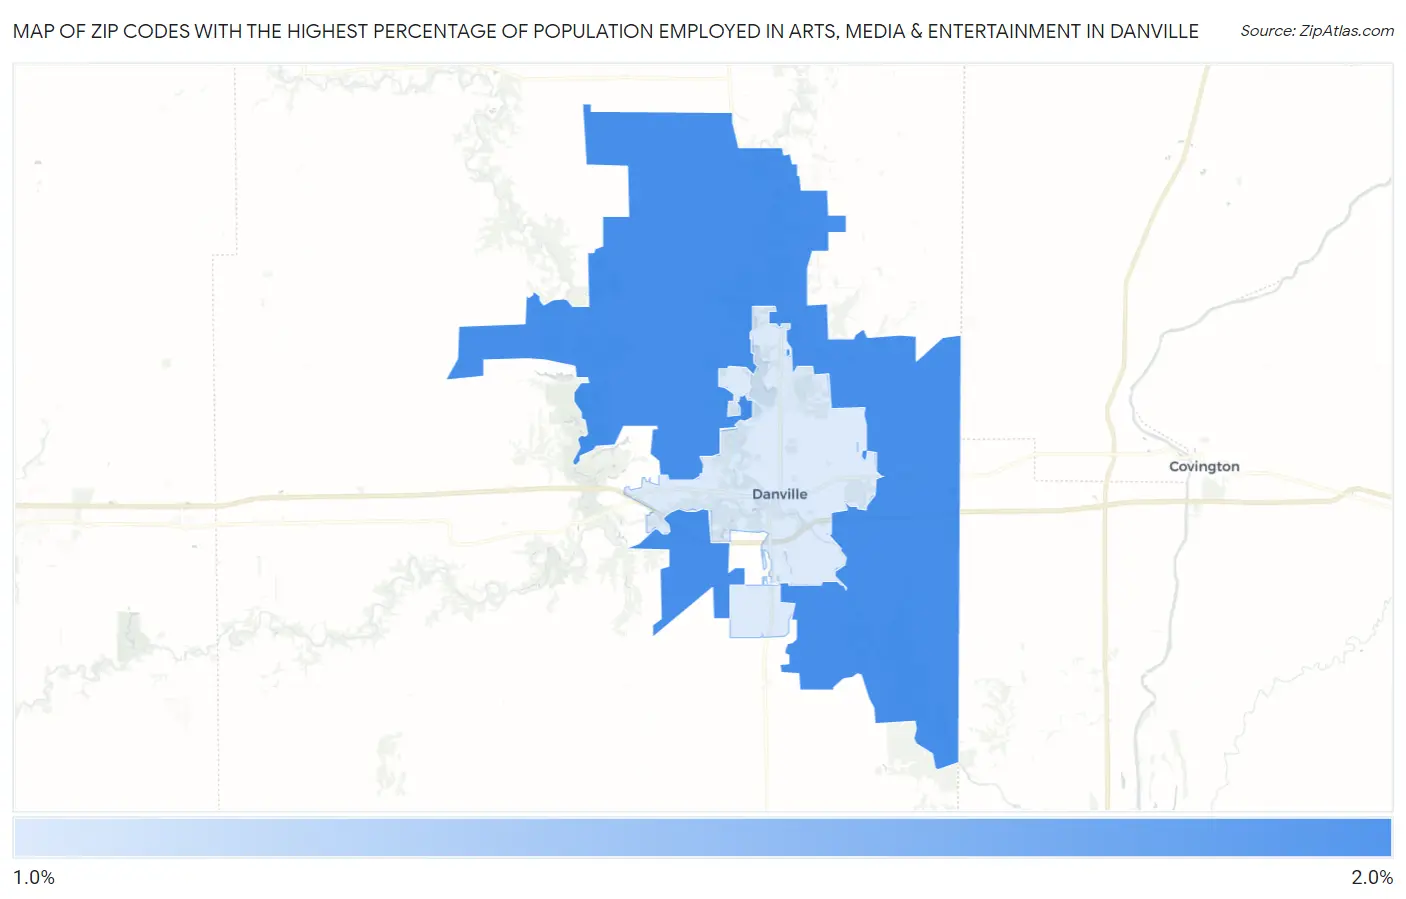
Map of Zip Codes with the Highest Percentage of Population Employed in Arts, Media & Entertainment in Danville
1.0%
1.7%
Zip Codes with the Highest Percentage of Population Employed in Arts, Media & Entertainment in Danville, IL
| Zip Code | % Employed | vs State | vs National | |
| 1. | 61834 | 1.7% | 1.9%(-0.262)#353 | 2.1%(-0.404)#9,944 |
| 2. | 61832 | 1.0% | 1.9%(-0.906)#567 | 2.1%(-1.05)#14,703 |
1
Common Questions
What are the Top Zip Codes with the Highest Percentage of Population Employed in Arts, Media & Entertainment in Danville, IL?
Top Zip Codes with the Highest Percentage of Population Employed in Arts, Media & Entertainment in Danville, IL are:
What zip code has the Highest Percentage of Population Employed in Arts, Media & Entertainment in Danville, IL?
61834 has the Highest Percentage of Population Employed in Arts, Media & Entertainment in Danville, IL with 1.7%.
What is the Percentage of Population Employed in Arts, Media & Entertainment in Danville, IL?
Percentage of Population Employed in Arts, Media & Entertainment in Danville is 1.2%.
What is the Percentage of Population Employed in Arts, Media & Entertainment in Illinois?
Percentage of Population Employed in Arts, Media & Entertainment in Illinois is 1.9%.
What is the Percentage of Population Employed in Arts, Media & Entertainment in the United States?
Percentage of Population Employed in Arts, Media & Entertainment in the United States is 2.1%.