Zip Codes with the Highest Percentage of Families with Income Above $100,000 in Danville, IL
RELATED REPORTS & OPTIONS
Family Income | $100k+
Danville
Compare Zip Codes
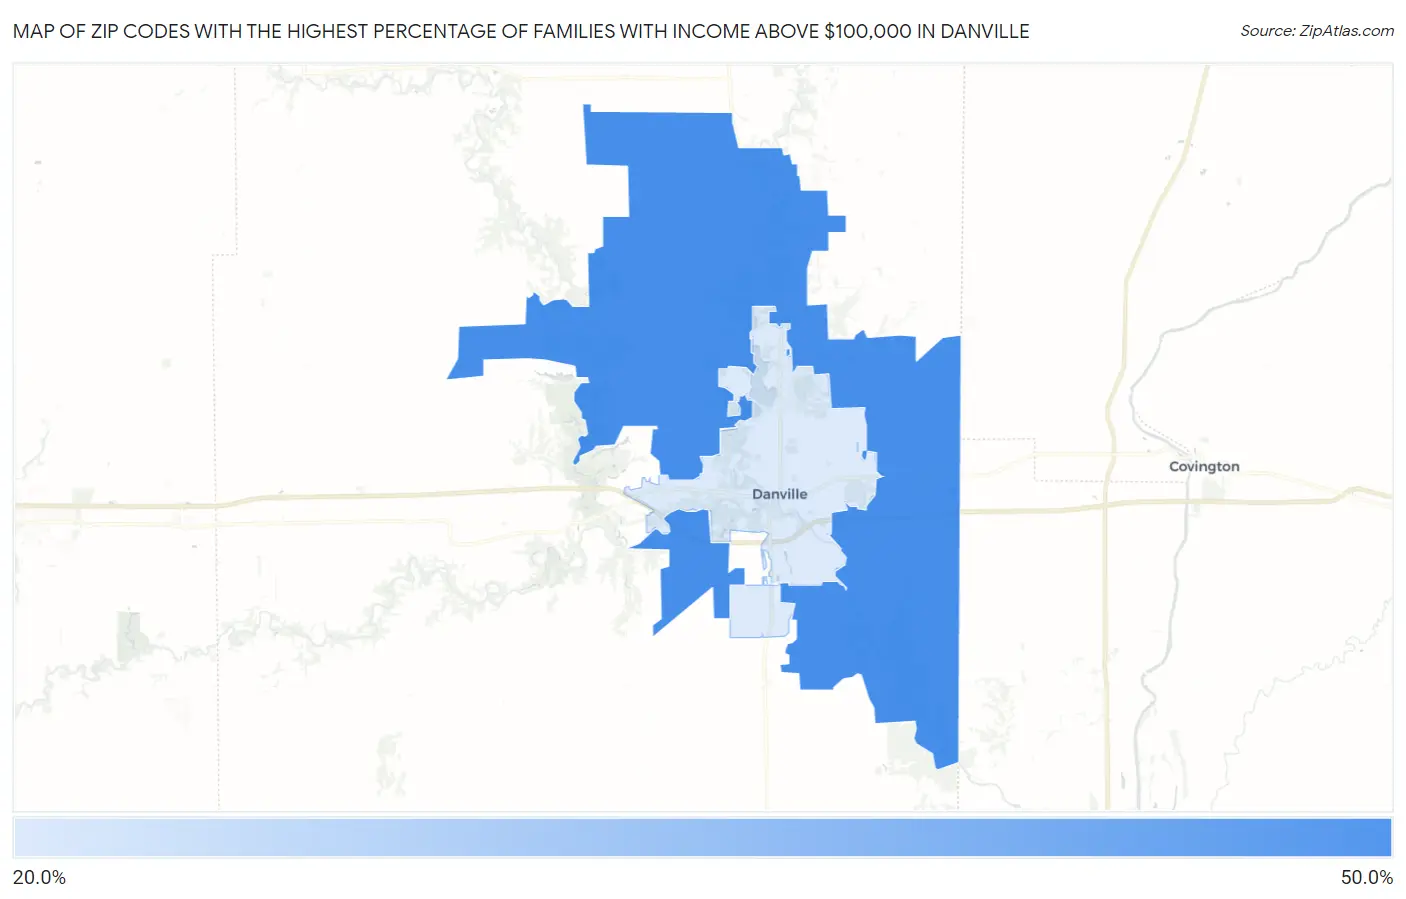
Map of Zip Codes with the Highest Percentage of Families with Income Above $100,000 in Danville
24.9%
41.5%
Zip Codes with the Highest Percentage of Families with Income Above $100,000 in Danville, IL
| Zip Code | Families with Income > $100k | vs State | vs National | |
| 1. | 61834 | 41.5% | 49.7%(-8.20)#655 | 46.1%(-4.60)#13,417 |
| 2. | 61832 | 24.9% | 49.7%(-24.8)#1,188 | 46.1%(-21.2)#24,775 |
1
Common Questions
What are the Top Zip Codes with the Highest Percentage of Families with Income Above $100,000 in Danville, IL?
Top Zip Codes with the Highest Percentage of Families with Income Above $100,000 in Danville, IL are:
What zip code has the Highest Percentage of Families with Income Above $100,000 in Danville, IL?
61834 has the Highest Percentage of Families with Income Above $100,000 in Danville, IL with 41.5%.
What is the Percentage of Families with Income Above $100,000 in Danville, IL?
Percentage of Families with Income Above $100,000 in Danville is 22.7%.
What is the Percentage of Families with Income Above $100,000 in Illinois?
Percentage of Families with Income Above $100,000 in Illinois is 49.7%.
What is the Percentage of Families with Income Above $100,000 in the United States?
Percentage of Families with Income Above $100,000 in the United States is 46.1%.