Zip Codes with the Highest Percentage of Population with a Degree in Education in Danville, IL
RELATED REPORTS & OPTIONS
Education
Danville
Compare Zip Codes
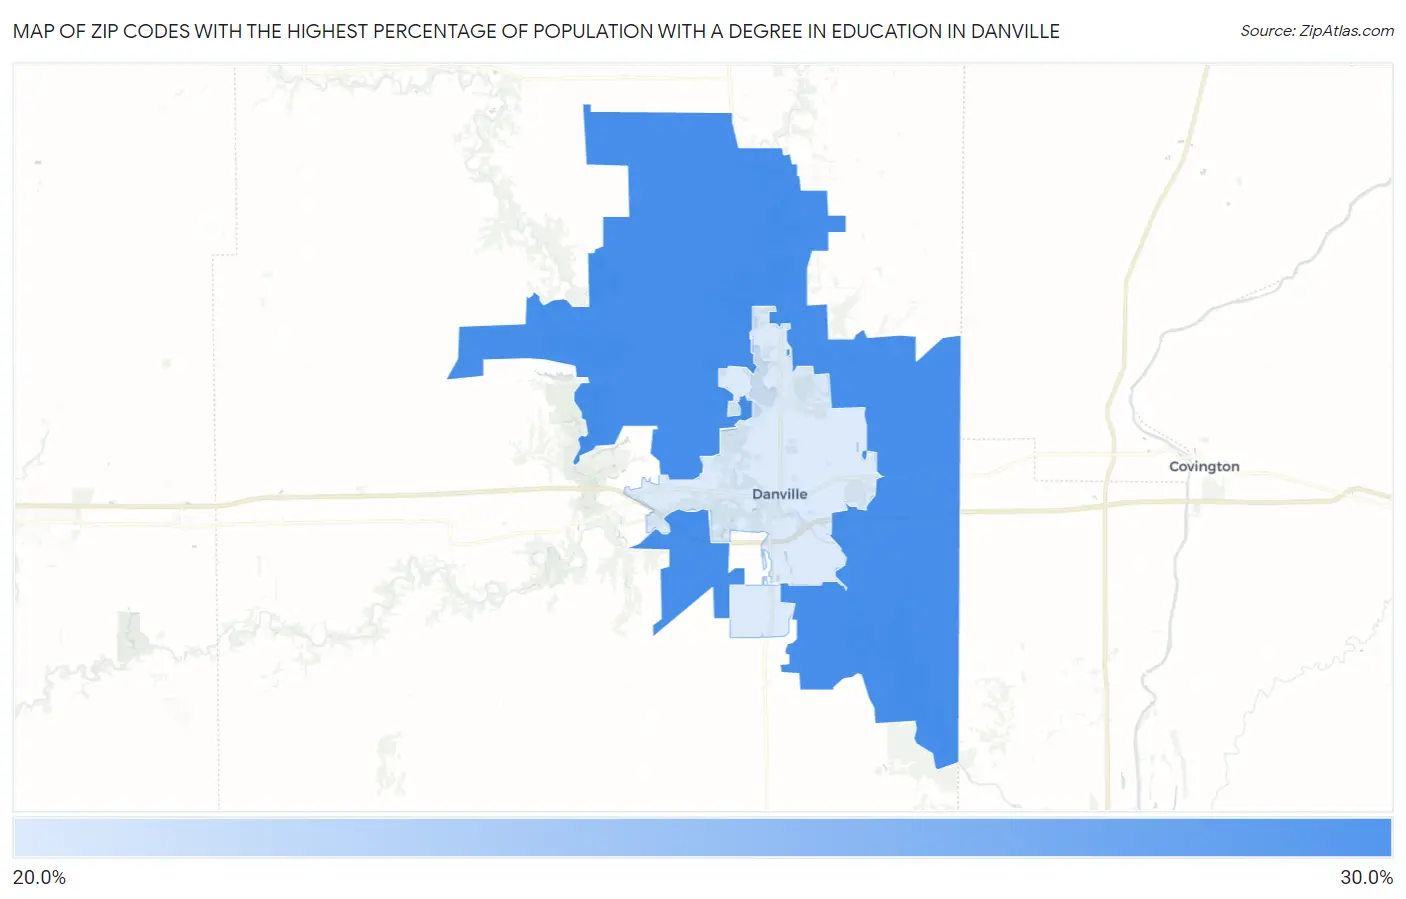
Map of Zip Codes with the Highest Percentage of Population with a Degree in Education in Danville
20.9%
25.1%
Zip Codes with the Highest Percentage of Population with a Degree in Education in Danville, IL
| Zip Code | % Graduates | vs State | vs National | |
| 1. | 61834 | 25.1% | 11.6%(+13.5)#327 | 11.1%(+14.0)#6,795 |
| 2. | 61832 | 20.9% | 11.6%(+9.30)#476 | 11.1%(+9.79)#9,837 |
1
Common Questions
What are the Top Zip Codes with the Highest Percentage of Population with a Degree in Education in Danville, IL?
Top Zip Codes with the Highest Percentage of Population with a Degree in Education in Danville, IL are:
What zip code has the Highest Percentage of Population with a Degree in Education in Danville, IL?
61834 has the Highest Percentage of Population with a Degree in Education in Danville, IL with 25.1%.
What is the Percentage of Population with a Degree in Education in Danville, IL?
Percentage of Population with a Degree in Education in Danville is 20.4%.
What is the Percentage of Population with a Degree in Education in Illinois?
Percentage of Population with a Degree in Education in Illinois is 11.6%.
What is the Percentage of Population with a Degree in Education in the United States?
Percentage of Population with a Degree in Education in the United States is 11.1%.