Zip Codes with the Highest Percentage of Population with a Degree in Business in Danville, IL
RELATED REPORTS & OPTIONS
Business
Danville
Compare Zip Codes
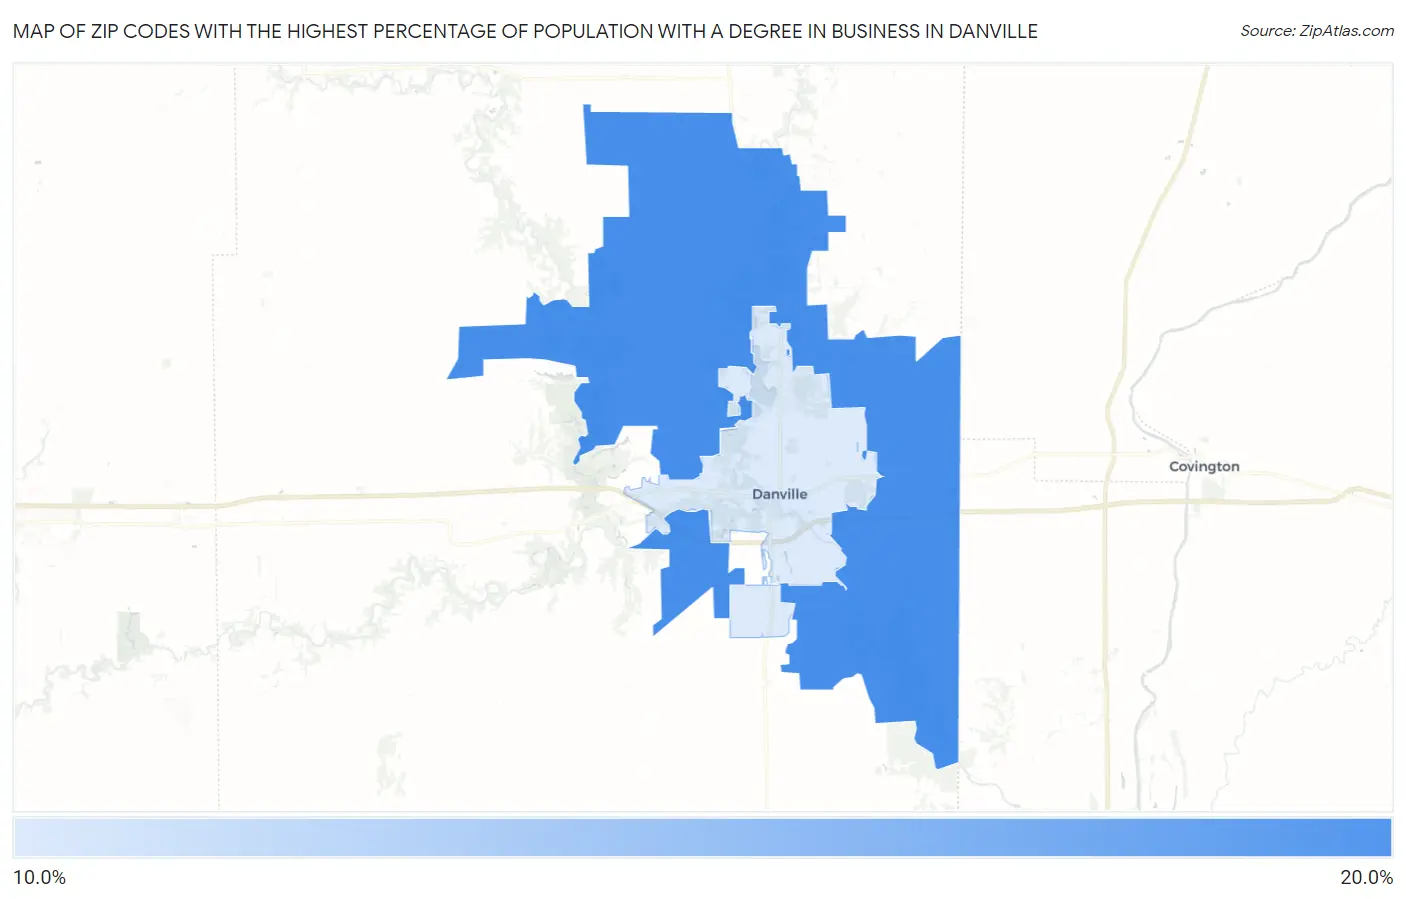
Map of Zip Codes with the Highest Percentage of Population with a Degree in Business in Danville
15.4%
17.5%
Zip Codes with the Highest Percentage of Population with a Degree in Business in Danville, IL
| Zip Code | % Graduates | vs State | vs National | |
| 1. | 61834 | 17.5% | 20.4%(-2.92)#674 | 19.5%(-2.03)#15,396 |
| 2. | 61832 | 15.4% | 20.4%(-5.01)#796 | 19.5%(-4.13)#18,463 |
1
Common Questions
What are the Top Zip Codes with the Highest Percentage of Population with a Degree in Business in Danville, IL?
Top Zip Codes with the Highest Percentage of Population with a Degree in Business in Danville, IL are:
What zip code has the Highest Percentage of Population with a Degree in Business in Danville, IL?
61834 has the Highest Percentage of Population with a Degree in Business in Danville, IL with 17.5%.
What is the Percentage of Population with a Degree in Business in Danville, IL?
Percentage of Population with a Degree in Business in Danville is 15.8%.
What is the Percentage of Population with a Degree in Business in Illinois?
Percentage of Population with a Degree in Business in Illinois is 20.4%.
What is the Percentage of Population with a Degree in Business in the United States?
Percentage of Population with a Degree in Business in the United States is 19.5%.