Zip Codes with the Highest Percentage of Population Employed in Health Diagnosing & Treating in Danville, IL
RELATED REPORTS & OPTIONS
Health Diagnosing & Treating
Danville
Compare Zip Codes
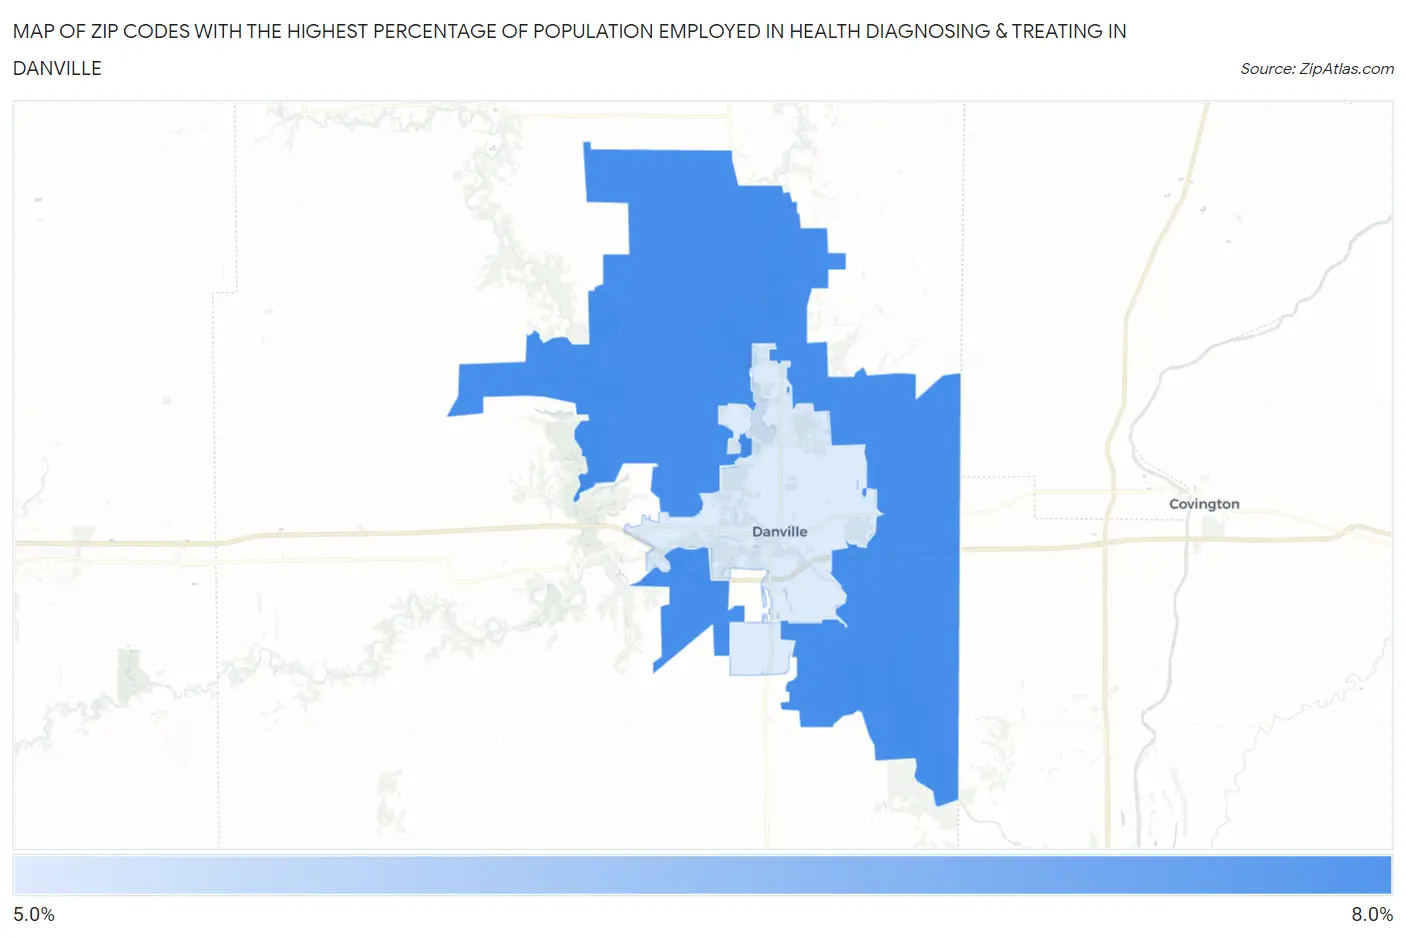
Map of Zip Codes with the Highest Percentage of Population Employed in Health Diagnosing & Treating in Danville
5.7%
6.1%
Zip Codes with the Highest Percentage of Population Employed in Health Diagnosing & Treating in Danville, IL
| Zip Code | % Employed | vs State | vs National | |
| 1. | 61834 | 6.1% | 6.2%(-0.172)#634 | 6.2%(-0.180)#13,629 |
| 2. | 61832 | 5.7% | 6.2%(-0.580)#705 | 6.2%(-0.589)#15,150 |
1
Common Questions
What are the Top Zip Codes with the Highest Percentage of Population Employed in Health Diagnosing & Treating in Danville, IL?
Top Zip Codes with the Highest Percentage of Population Employed in Health Diagnosing & Treating in Danville, IL are:
What zip code has the Highest Percentage of Population Employed in Health Diagnosing & Treating in Danville, IL?
61834 has the Highest Percentage of Population Employed in Health Diagnosing & Treating in Danville, IL with 6.1%.
What is the Percentage of Population Employed in Health Diagnosing & Treating in Danville, IL?
Percentage of Population Employed in Health Diagnosing & Treating in Danville is 5.5%.
What is the Percentage of Population Employed in Health Diagnosing & Treating in Illinois?
Percentage of Population Employed in Health Diagnosing & Treating in Illinois is 6.2%.
What is the Percentage of Population Employed in Health Diagnosing & Treating in the United States?
Percentage of Population Employed in Health Diagnosing & Treating in the United States is 6.2%.