Zip Codes with the Highest Percentage of Population Employed in Education, Arts & Media in Danville, IL
RELATED REPORTS & OPTIONS
Education, Arts & Media
Danville
Compare Zip Codes
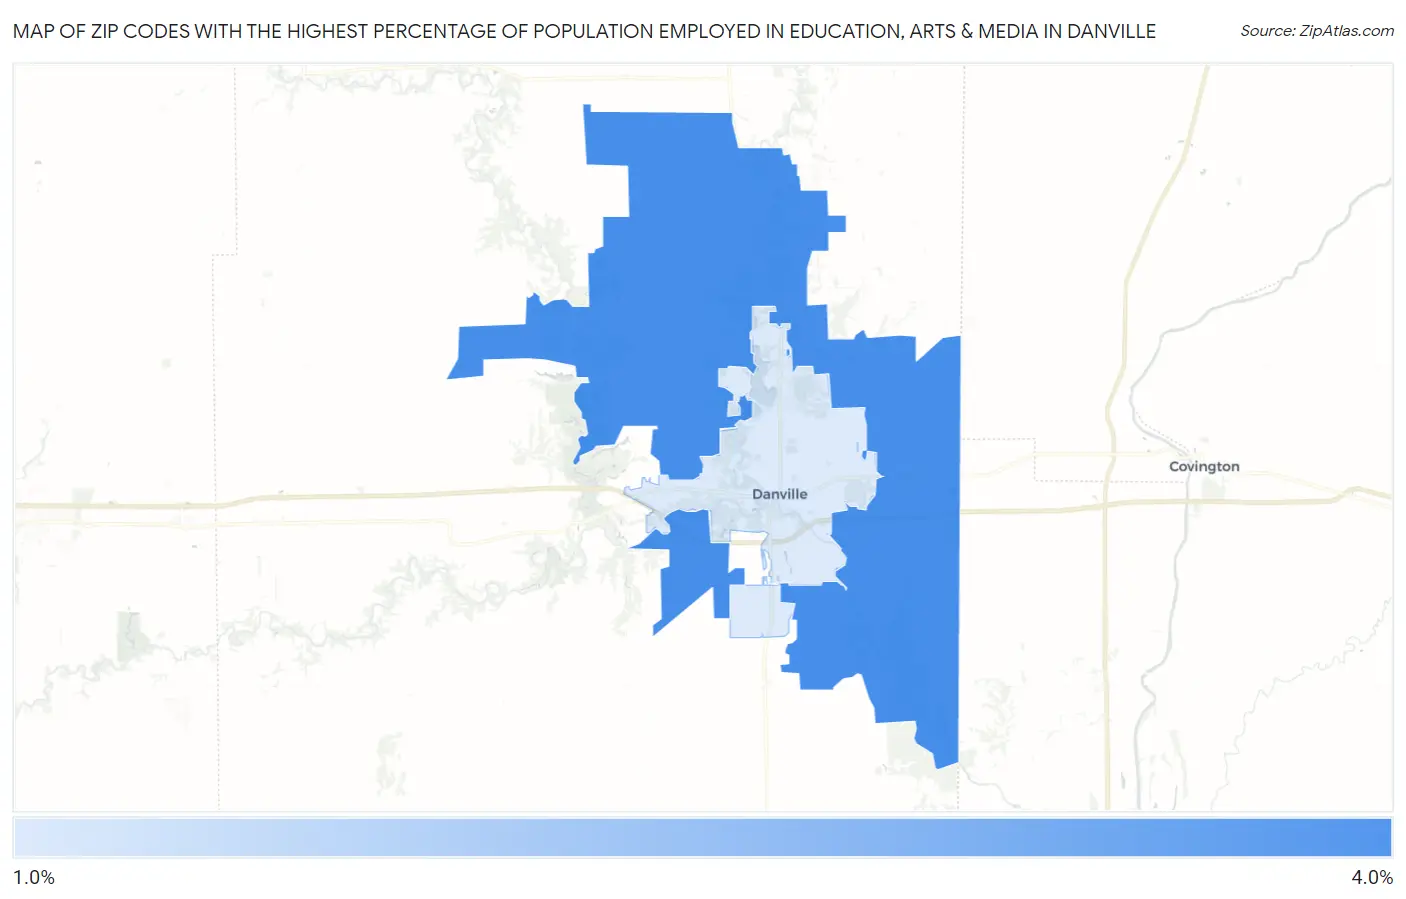
Map of Zip Codes with the Highest Percentage of Population Employed in Education, Arts & Media in Danville
1.9%
3.7%
Zip Codes with the Highest Percentage of Population Employed in Education, Arts & Media in Danville, IL
| Zip Code | % Employed | vs State | vs National | |
| 1. | 61834 | 3.7% | 1.7%(+1.95)#110 | 1.8%(+1.88)#2,980 |
| 2. | 61832 | 1.9% | 1.7%(+0.185)#388 | 1.8%(+0.115)#10,341 |
1
Common Questions
What are the Top Zip Codes with the Highest Percentage of Population Employed in Education, Arts & Media in Danville, IL?
Top Zip Codes with the Highest Percentage of Population Employed in Education, Arts & Media in Danville, IL are:
What zip code has the Highest Percentage of Population Employed in Education, Arts & Media in Danville, IL?
61834 has the Highest Percentage of Population Employed in Education, Arts & Media in Danville, IL with 3.7%.
What is the Percentage of Population Employed in Education, Arts & Media in Danville, IL?
Percentage of Population Employed in Education, Arts & Media in Danville is 2.2%.
What is the Percentage of Population Employed in Education, Arts & Media in Illinois?
Percentage of Population Employed in Education, Arts & Media in Illinois is 1.7%.
What is the Percentage of Population Employed in Education, Arts & Media in the United States?
Percentage of Population Employed in Education, Arts & Media in the United States is 1.8%.