Zip Codes with the Highest Percentage of Population with a Degree in Science and Engineering in Danville, IL
RELATED REPORTS & OPTIONS
Science and Engineering
Danville
Compare Zip Codes
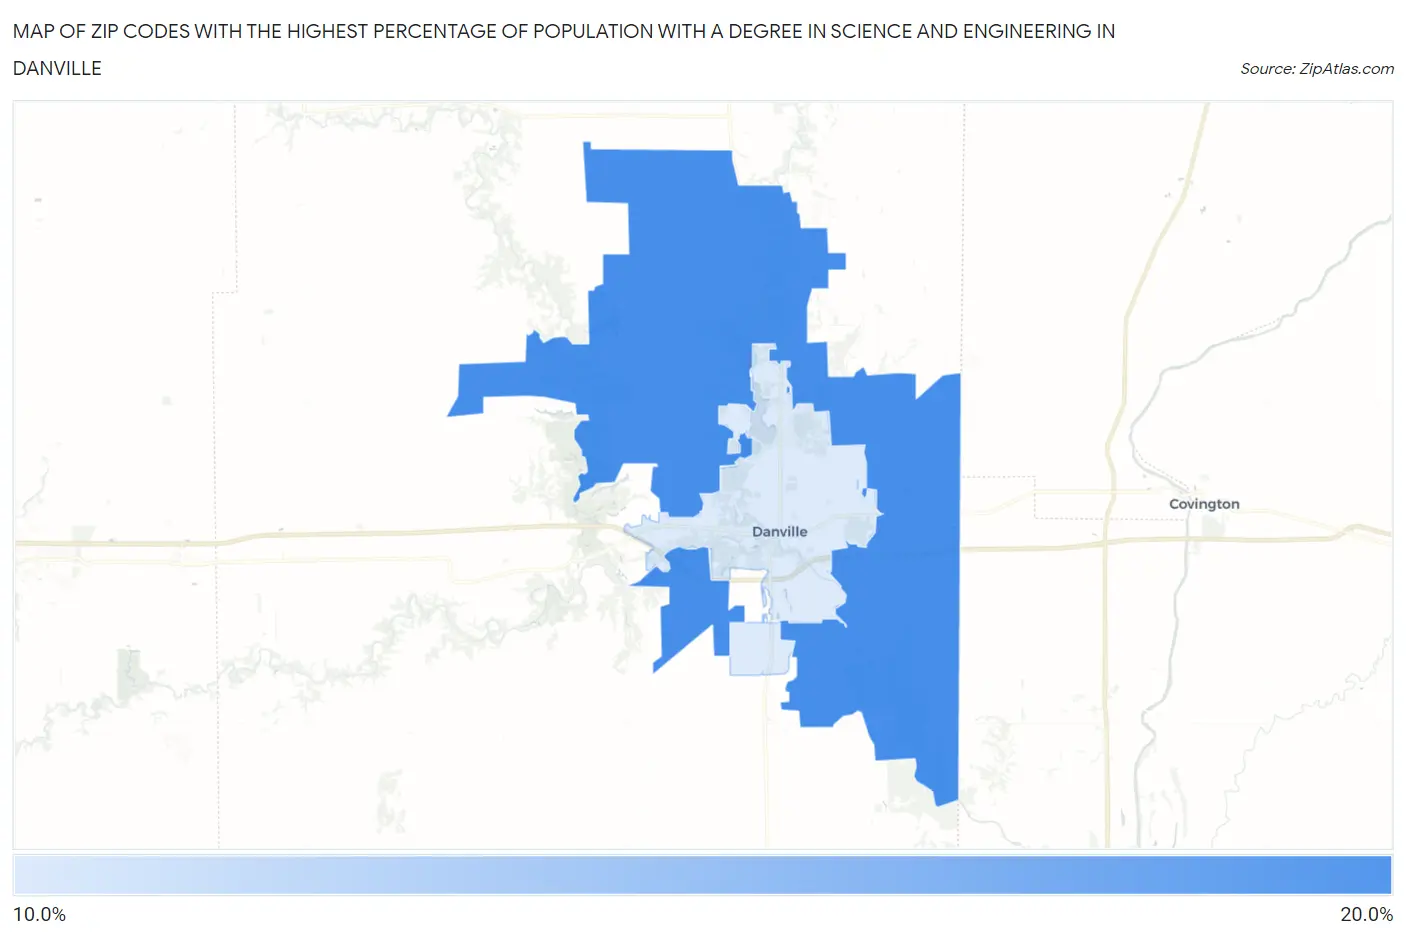
Map of Zip Codes with the Highest Percentage of Population with a Degree in Science and Engineering in Danville
10.6%
16.7%
Zip Codes with the Highest Percentage of Population with a Degree in Science and Engineering in Danville, IL
| Zip Code | % Graduates | vs State | vs National | |
| 1. | 61834 | 16.7% | 9.8%(+6.88)#278 | 9.8%(+6.94)#5,179 |
| 2. | 61832 | 10.6% | 9.8%(+0.723)#702 | 9.8%(+0.782)#13,812 |
1
Common Questions
What are the Top Zip Codes with the Highest Percentage of Population with a Degree in Science and Engineering in Danville, IL?
Top Zip Codes with the Highest Percentage of Population with a Degree in Science and Engineering in Danville, IL are:
What zip code has the Highest Percentage of Population with a Degree in Science and Engineering in Danville, IL?
61834 has the Highest Percentage of Population with a Degree in Science and Engineering in Danville, IL with 16.7%.
What is the Percentage of Population with a Degree in Science and Engineering in Danville, IL?
Percentage of Population with a Degree in Science and Engineering in Danville is 10.0%.
What is the Percentage of Population with a Degree in Science and Engineering in Illinois?
Percentage of Population with a Degree in Science and Engineering in Illinois is 9.8%.
What is the Percentage of Population with a Degree in Science and Engineering in the United States?
Percentage of Population with a Degree in Science and Engineering in the United States is 9.8%.