Zip Codes with the Largest Black / African American Community in Danville, IL
RELATED REPORTS & OPTIONS
Black / African American
Danville
Compare Zip Codes
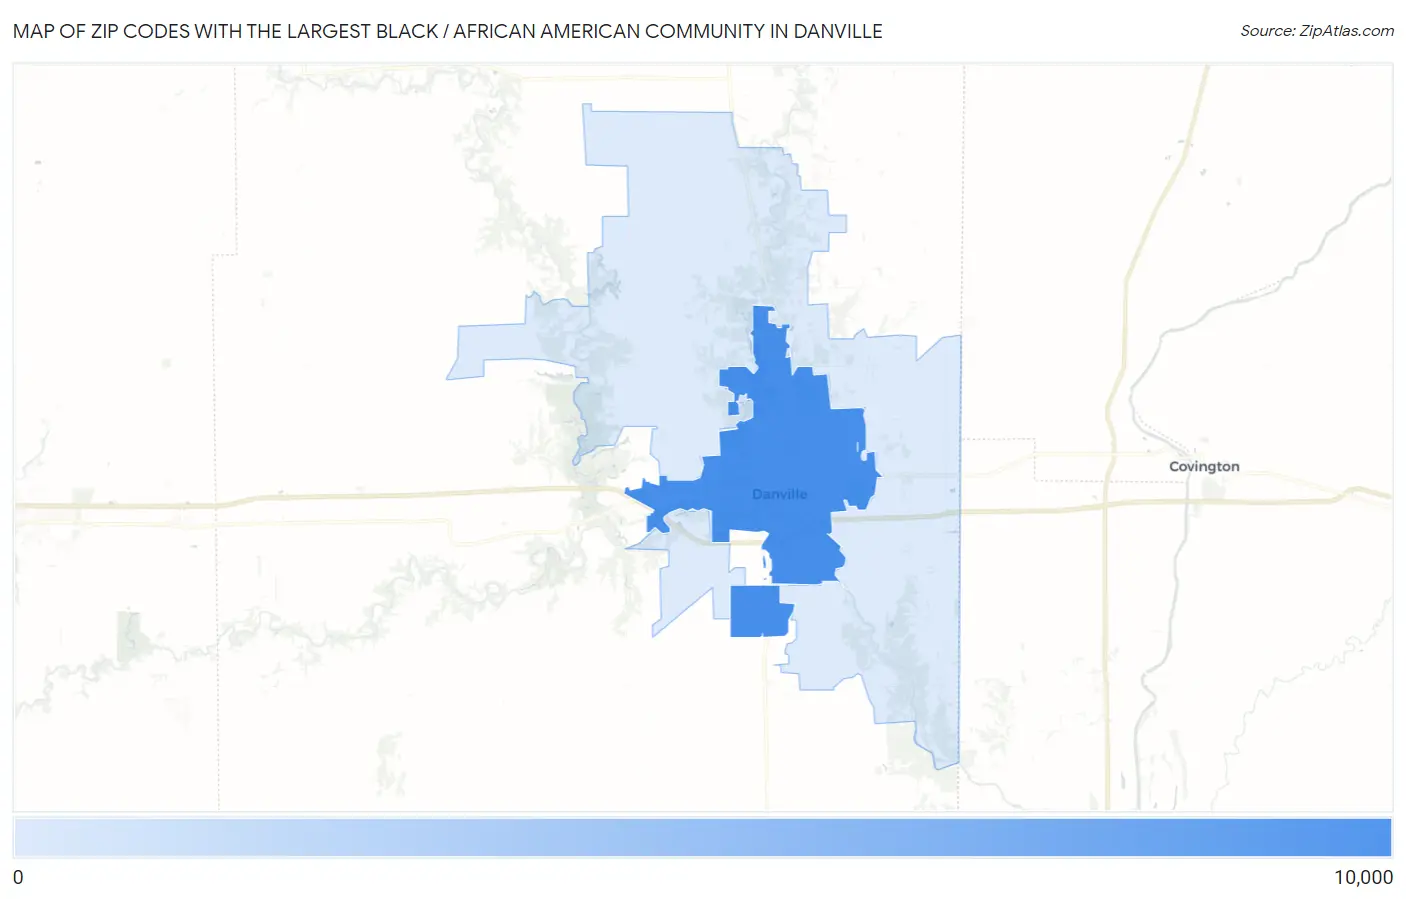
Map of Zip Codes with the Largest Black / African American Community in Danville
967
8,988
Zip Codes with the Largest Black / African American Community in Danville, IL
| Zip Code | Black / African American | vs State | vs National | |
| 1. | 61832 | 8,988 | 1,774,605(0.51%)#44 | 41,288,572(0.02%)#1,176 |
| 2. | 61834 | 967 | 1,774,605(0.05%)#256 | 41,288,572(0.00%)#6,926 |
1
Common Questions
What are the Top Zip Codes with the Largest Black / African American Community in Danville, IL?
Top Zip Codes with the Largest Black / African American Community in Danville, IL are:
What zip code has the Largest Black / African American Community in Danville, IL?
61832 has the Largest Black / African American Community in Danville, IL with 8,988.
What is the Total Black / African American Population in Danville, IL?
Total Black / African American Population in Danville is 9,627.
What is the Total Black / African American Population in Illinois?
Total Black / African American Population in Illinois is 1,774,605.
What is the Total Black / African American Population in the United States?
Total Black / African American Population in the United States is 41,288,572.