Zip Codes with the Highest Percentage of Households Heated by Bottled Gas / Liquid Propane in Tarpon Springs, FL
RELATED REPORTS & OPTIONS
Bottled Gas / LP Heating
Tarpon Springs
Compare Zip Codes
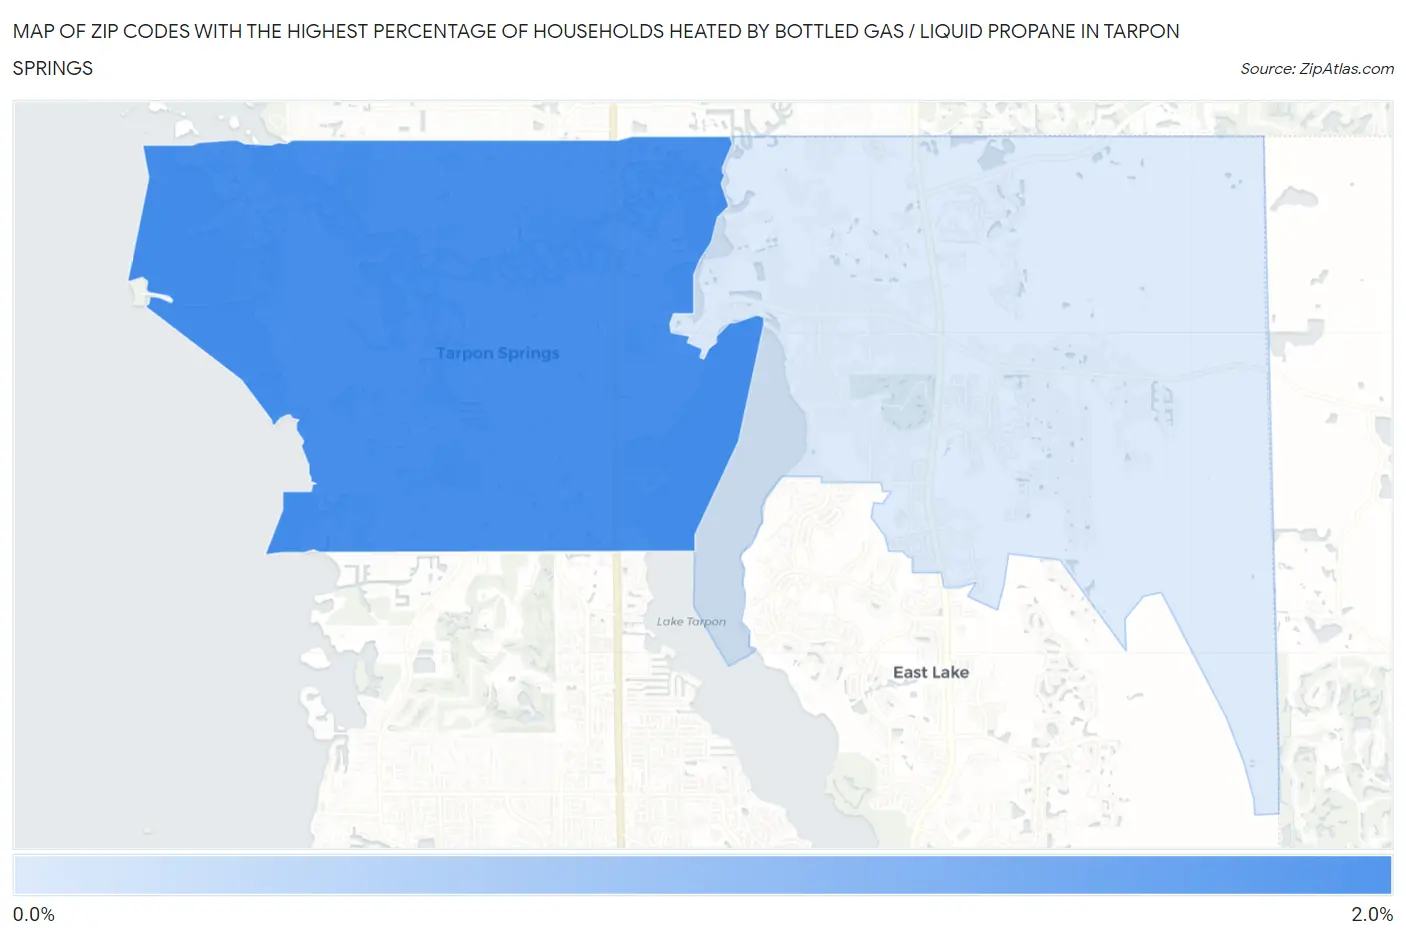
Map of Zip Codes with the Highest Percentage of Households Heated by Bottled Gas / Liquid Propane in Tarpon Springs
0.20%
1.9%
Zip Codes with the Highest Percentage of Households Heated by Bottled Gas / Liquid Propane in Tarpon Springs, FL
| Zip Code | Bottled Gas / LP Heating | vs State | vs National | |
| 1. | 34689 | 1.9% | 0.90%(+1.000)#207 | 4.9%(-3.00)#23,476 |
| 2. | 34688 | 0.20% | 0.90%(-0.700)#800 | 4.9%(-4.70)#29,476 |
1
Common Questions
What are the Top Zip Codes with the Highest Percentage of Households Heated by Bottled Gas / Liquid Propane in Tarpon Springs, FL?
Top Zip Codes with the Highest Percentage of Households Heated by Bottled Gas / Liquid Propane in Tarpon Springs, FL are:
What zip code has the Highest Percentage of Households Heated by Bottled Gas / Liquid Propane in Tarpon Springs, FL?
34689 has the Highest Percentage of Households Heated by Bottled Gas / Liquid Propane in Tarpon Springs, FL with 1.9%.
What is the Percentage of Households Heated by Bottled Gas / Liquid Propane in Tarpon Springs, FL?
Percentage of Households Heated by Bottled Gas / Liquid Propane in Tarpon Springs is 2.1%.
What is the Percentage of Households Heated by Bottled Gas / Liquid Propane in Florida?
Percentage of Households Heated by Bottled Gas / Liquid Propane in Florida is 0.90%.
What is the Percentage of Households Heated by Bottled Gas / Liquid Propane in the United States?
Percentage of Households Heated by Bottled Gas / Liquid Propane in the United States is 4.9%.