Punta Gorda, FL Map & Demographics
Punta Gorda Map
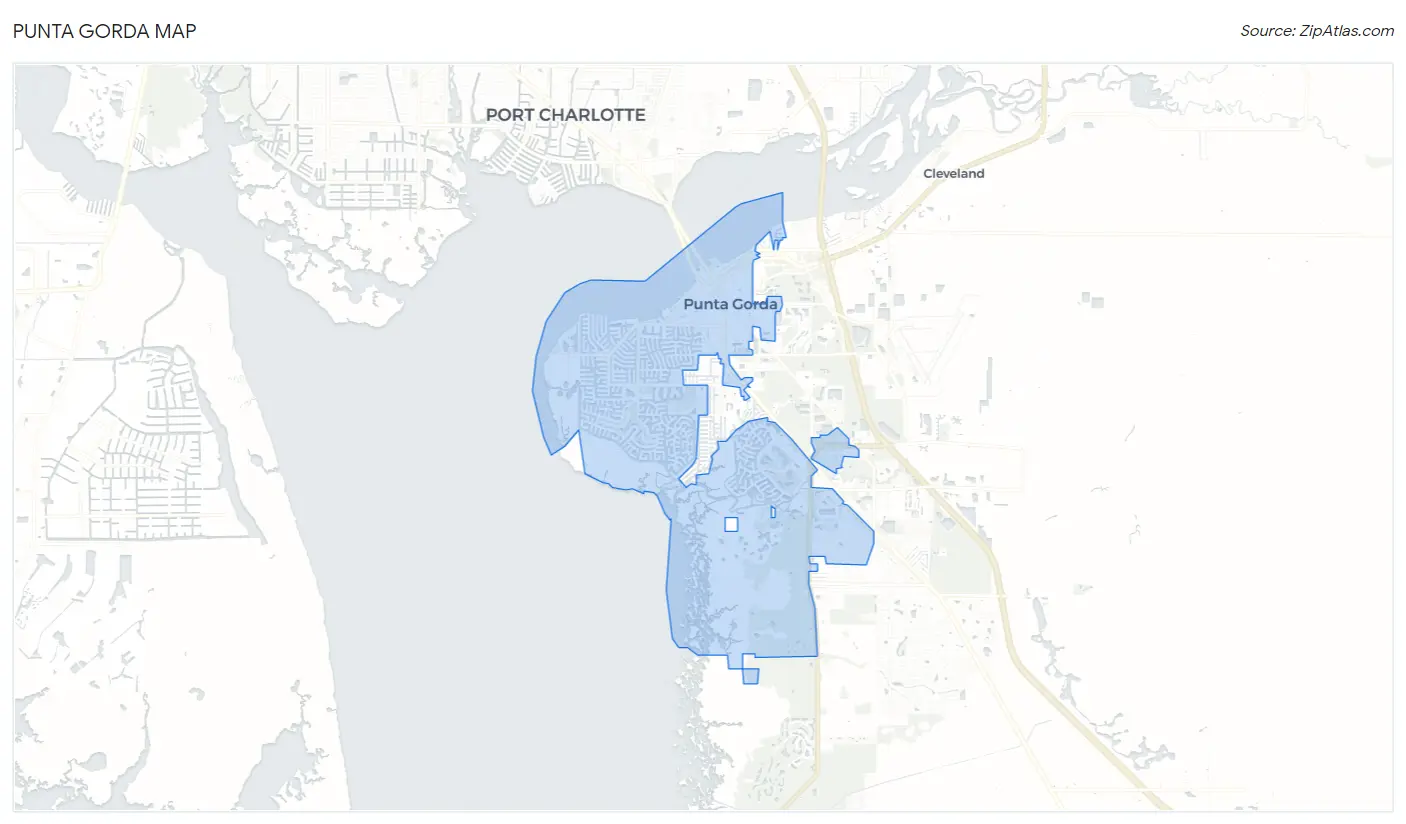
Punta Gorda Overview
$54,606
PER CAPITA INCOME
$96,154
AVG FAMILY INCOME
$75,898
AVG HOUSEHOLD INCOME
26.2%
WAGE / INCOME GAP [ % ]
73.8¢/ $1
WAGE / INCOME GAP [ $ ]
0.47
INEQUALITY / GINI INDEX
19,605
TOTAL POPULATION
9,559
MALE POPULATION
10,046
FEMALE POPULATION
95.15
MALES / 100 FEMALES
105.09
FEMALES / 100 MALES
66.3
MEDIAN AGE
2.4
AVG FAMILY SIZE
2.0
AVG HOUSEHOLD SIZE
5,757
LABOR FORCE [ PEOPLE ]
31.8%
PERCENT IN LABOR FORCE
4.9%
UNEMPLOYMENT RATE
Punta Gorda Area Codes
Income in Punta Gorda
Income Overview in Punta Gorda
Per Capita Income in Punta Gorda is $54,606, while median incomes of families and households are $96,154 and $75,898 respectively.
| Characteristic | Number | Measure |
| Per Capita Income | 19,605 | $54,606 |
| Median Family Income | 6,440 | $96,154 |
| Mean Family Income | 6,440 | $125,168 |
| Median Household Income | 9,827 | $75,898 |
| Mean Household Income | 9,827 | $106,809 |
| Income Deficit | 6,440 | $0 |
| Wage / Income Gap (%) | 19,605 | 26.23% |
| Wage / Income Gap ($) | 19,605 | 73.77¢ per $1 |
| Gini / Inequality Index | 19,605 | 0.47 |
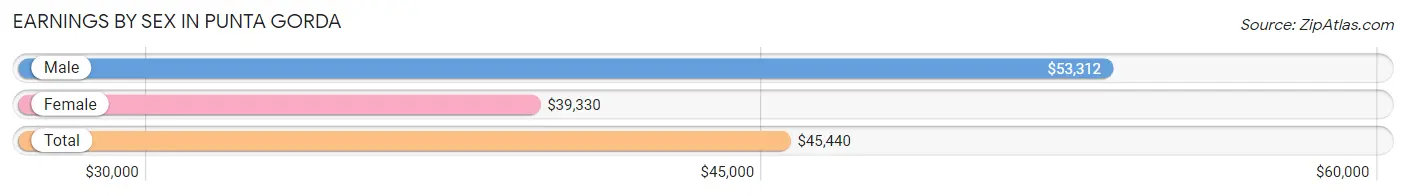
Earnings by Sex in Punta Gorda
Average Earnings in Punta Gorda are $45,440, $53,312 for men and $39,330 for women, a difference of 26.2%.
| Sex | Number | Average Earnings |
| Male | 3,435 (54.8%) | $53,312 |
| Female | 2,829 (45.2%) | $39,330 |
| Total | 6,264 (100.0%) | $45,440 |
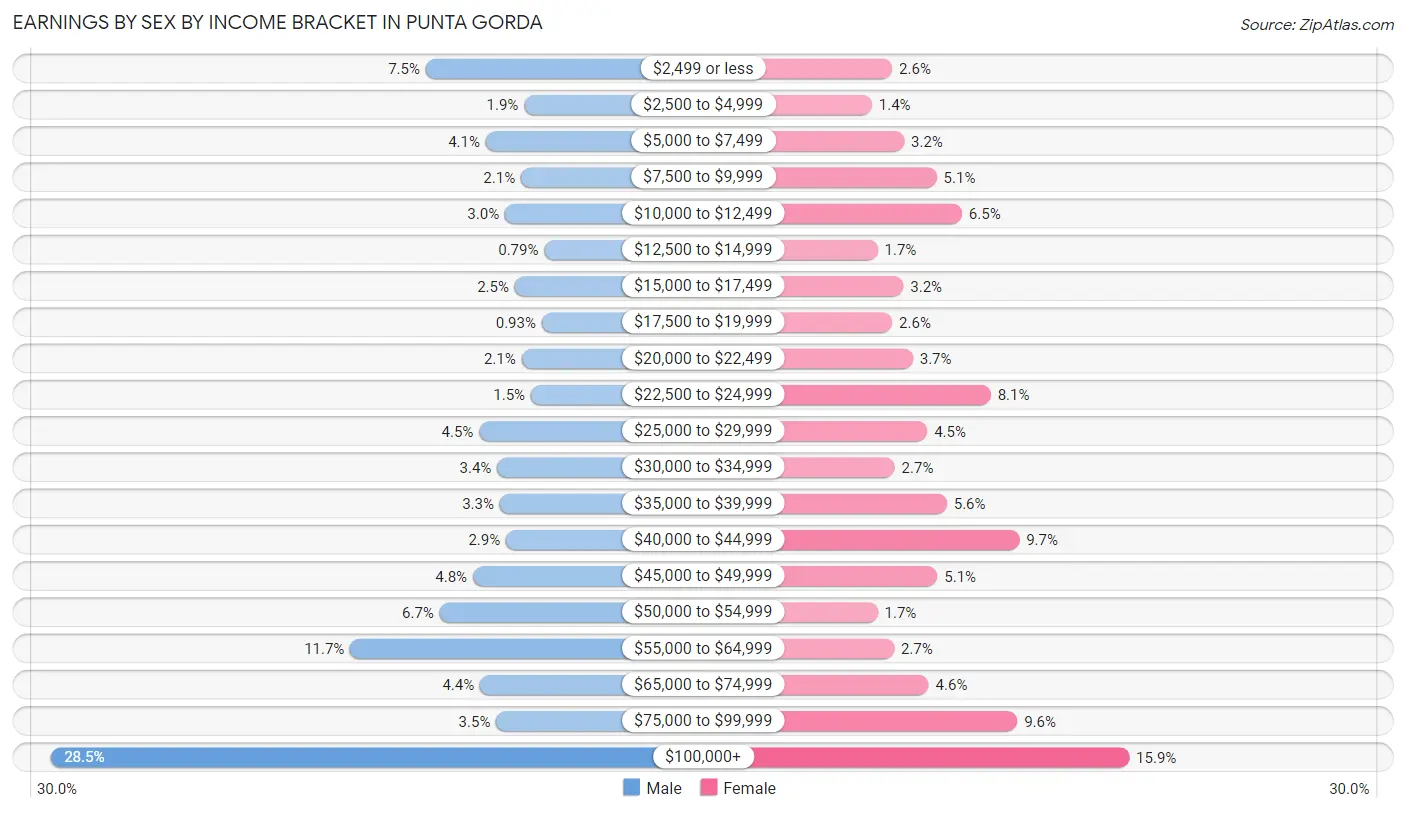
Earnings by Sex by Income Bracket in Punta Gorda
The most common earnings brackets in Punta Gorda are $100,000+ for men (979 | 28.5%) and $100,000+ for women (449 | 15.9%).
| Income | Male | Female |
| $2,499 or less | 256 (7.4%) | 72 (2.5%) |
| $2,500 to $4,999 | 66 (1.9%) | 40 (1.4%) |
| $5,000 to $7,499 | 140 (4.1%) | 91 (3.2%) |
| $7,500 to $9,999 | 72 (2.1%) | 143 (5.1%) |
| $10,000 to $12,499 | 103 (3.0%) | 183 (6.5%) |
| $12,500 to $14,999 | 27 (0.8%) | 49 (1.7%) |
| $15,000 to $17,499 | 84 (2.5%) | 90 (3.2%) |
| $17,500 to $19,999 | 32 (0.9%) | 72 (2.5%) |
| $20,000 to $22,499 | 71 (2.1%) | 105 (3.7%) |
| $22,500 to $24,999 | 53 (1.5%) | 229 (8.1%) |
| $25,000 to $29,999 | 153 (4.4%) | 128 (4.5%) |
| $30,000 to $34,999 | 118 (3.4%) | 76 (2.7%) |
| $35,000 to $39,999 | 113 (3.3%) | 159 (5.6%) |
| $40,000 to $44,999 | 101 (2.9%) | 274 (9.7%) |
| $45,000 to $49,999 | 165 (4.8%) | 144 (5.1%) |
| $50,000 to $54,999 | 229 (6.7%) | 49 (1.7%) |
| $55,000 to $64,999 | 402 (11.7%) | 75 (2.6%) |
| $65,000 to $74,999 | 151 (4.4%) | 130 (4.6%) |
| $75,000 to $99,999 | 120 (3.5%) | 271 (9.6%) |
| $100,000+ | 979 (28.5%) | 449 (15.9%) |
| Total | 3,435 (100.0%) | 2,829 (100.0%) |
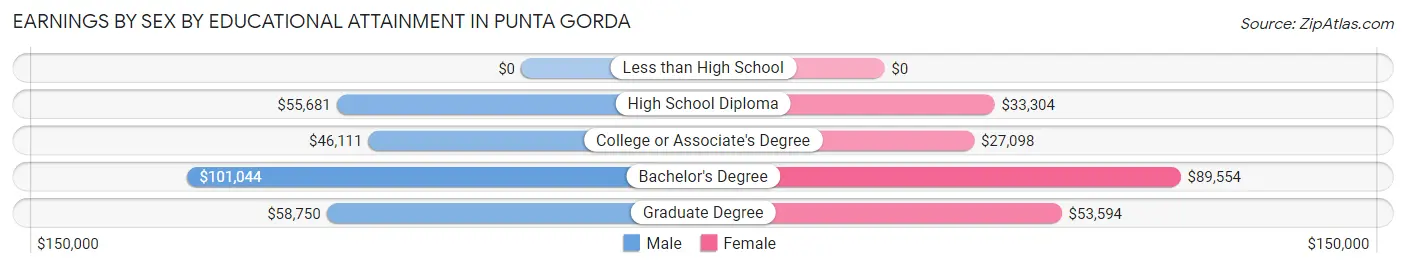
Earnings by Sex by Educational Attainment in Punta Gorda
Average earnings in Punta Gorda are $55,899 for men and $40,404 for women, a difference of 27.7%. Men with an educational attainment of bachelor's degree enjoy the highest average annual earnings of $101,044, while those with college or associate's degree education earn the least with $46,111. Women with an educational attainment of bachelor's degree earn the most with the average annual earnings of $89,554, while those with college or associate's degree education have the smallest earnings of $27,098.
| Educational Attainment | Male Income | Female Income |
| Less than High School | - | - |
| High School Diploma | $55,681 | $33,304 |
| College or Associate's Degree | $46,111 | $27,098 |
| Bachelor's Degree | $101,044 | $89,554 |
| Graduate Degree | $58,750 | $53,594 |
| Total | $55,899 | $40,404 |
Family Income in Punta Gorda
Family Income Brackets in Punta Gorda
According to the Punta Gorda family income data, there are 1,494 families falling into the $100,000 to $149,999 income range, which is the most common income bracket and makes up 23.2% of all families. Conversely, the $10,000 to $14,999 income bracket is the least frequent group with only 77 families (1.2%) belonging to this category.
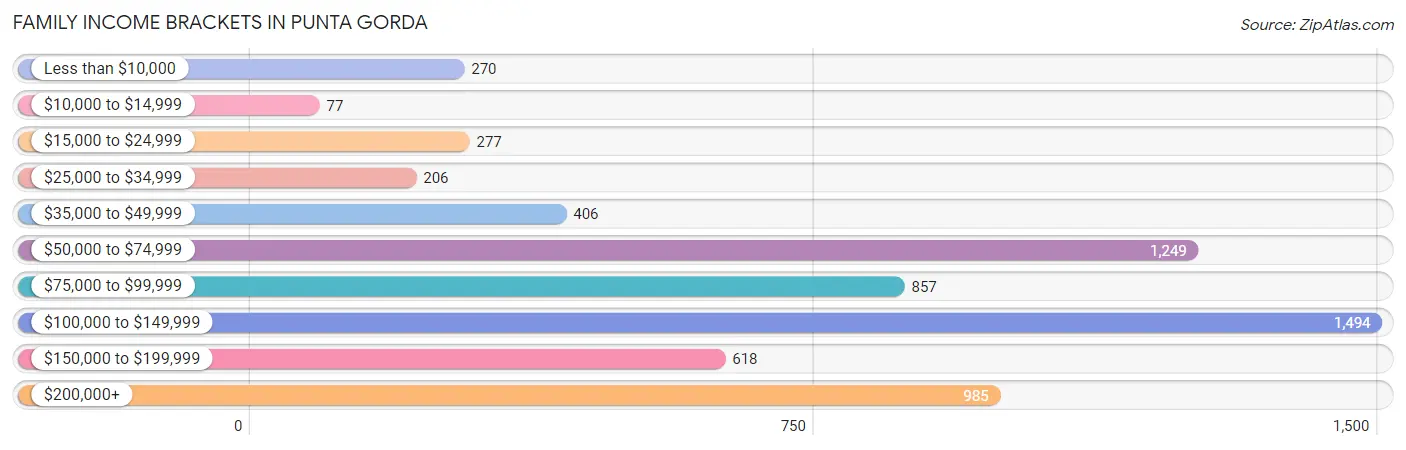
| Income Bracket | # Families | % Families |
| Less than $10,000 | 270 | 4.2% |
| $10,000 to $14,999 | 77 | 1.2% |
| $15,000 to $24,999 | 277 | 4.3% |
| $25,000 to $34,999 | 206 | 3.2% |
| $35,000 to $49,999 | 406 | 6.3% |
| $50,000 to $74,999 | 1,249 | 19.4% |
| $75,000 to $99,999 | 857 | 13.3% |
| $100,000 to $149,999 | 1,494 | 23.2% |
| $150,000 to $199,999 | 618 | 9.6% |
| $200,000+ | 985 | 15.3% |
Family Income by Famaliy Size in Punta Gorda
4-person families (353 | 5.5%) account for the highest median family income in Punta Gorda with $192,760 per family, while 4-person families (353 | 5.5%) have the highest median income of $48,190 per family member.
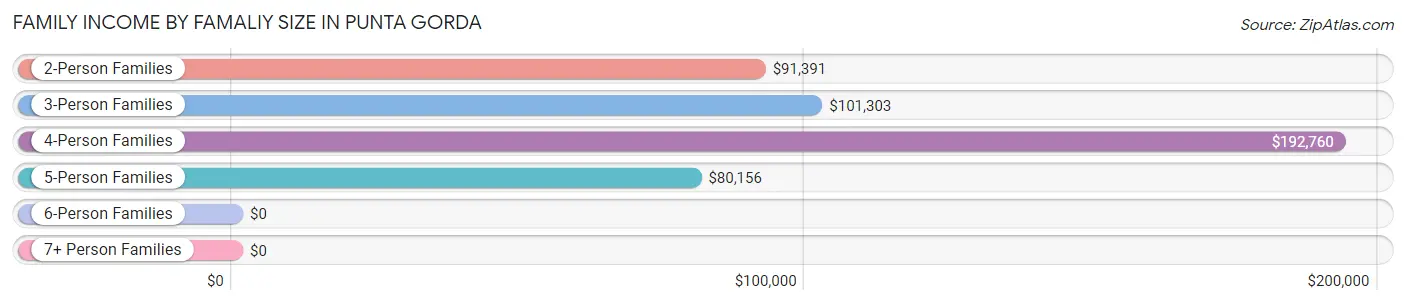
| Income Bracket | # Families | Median Income |
| 2-Person Families | 5,267 (81.8%) | $91,391 |
| 3-Person Families | 689 (10.7%) | $101,303 |
| 4-Person Families | 353 (5.5%) | $192,760 |
| 5-Person Families | 95 (1.5%) | $80,156 |
| 6-Person Families | 15 (0.2%) | $0 |
| 7+ Person Families | 21 (0.3%) | $0 |
| Total | 6,440 (100.0%) | $96,154 |
Family Income by Number of Earners in Punta Gorda
The median family income in Punta Gorda is $96,154, with families comprising 3+ earners (349) having the highest median family income of $194,601, while families with no earners (3,333) have the lowest median family income of $85,095, accounting for 5.4% and 51.7% of families, respectively.
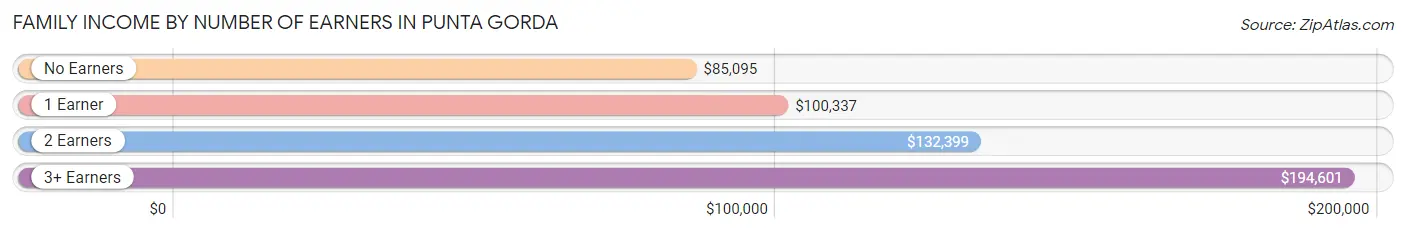
| Number of Earners | # Families | Median Income |
| No Earners | 3,333 (51.7%) | $85,095 |
| 1 Earner | 1,768 (27.5%) | $100,337 |
| 2 Earners | 990 (15.4%) | $132,399 |
| 3+ Earners | 349 (5.4%) | $194,601 |
| Total | 6,440 (100.0%) | $96,154 |
Household Income in Punta Gorda
Household Income Brackets in Punta Gorda
With 1,956 households falling in the category, the $50,000 to $74,999 income range is the most frequent in Punta Gorda, accounting for 19.9% of all households. In contrast, only 256 households (2.6%) fall into the $10,000 to $14,999 income bracket, making it the least populous group.
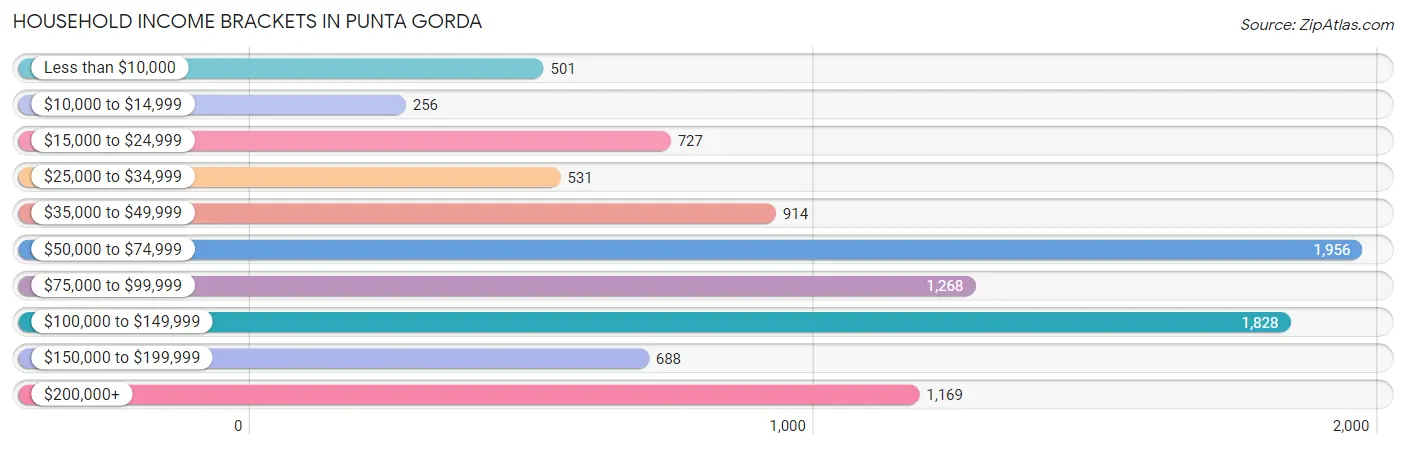
| Income Bracket | # Households | % Households |
| Less than $10,000 | 501 | 5.1% |
| $10,000 to $14,999 | 256 | 2.6% |
| $15,000 to $24,999 | 727 | 7.4% |
| $25,000 to $34,999 | 531 | 5.4% |
| $35,000 to $49,999 | 914 | 9.3% |
| $50,000 to $74,999 | 1,956 | 19.9% |
| $75,000 to $99,999 | 1,268 | 12.9% |
| $100,000 to $149,999 | 1,828 | 18.6% |
| $150,000 to $199,999 | 688 | 7.0% |
| $200,000+ | 1,169 | 11.9% |
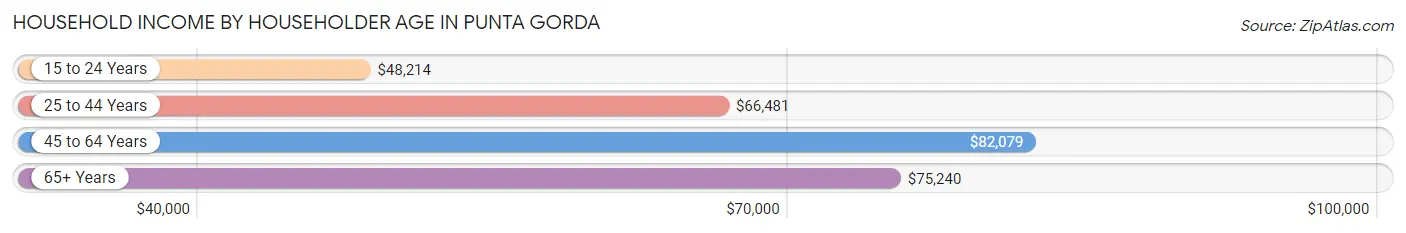
Household Income by Householder Age in Punta Gorda
The median household income in Punta Gorda is $75,898, with the highest median household income of $82,079 found in the 45 to 64 years age bracket for the primary householder. A total of 2,962 households (30.1%) fall into this category. Meanwhile, the 15 to 24 years age bracket for the primary householder has the lowest median household income of $48,214, with 84 households (0.9%) in this group.
| Income Bracket | # Households | Median Income |
| 15 to 24 Years | 84 (0.9%) | $48,214 |
| 25 to 44 Years | 688 (7.0%) | $66,481 |
| 45 to 64 Years | 2,962 (30.1%) | $82,079 |
| 65+ Years | 6,093 (62.0%) | $75,240 |
| Total | 9,827 (100.0%) | $75,898 |
Poverty in Punta Gorda
Income Below Poverty by Sex and Age in Punta Gorda
With 7.0% poverty level for males and 10.5% for females among the residents of Punta Gorda, 18 to 24 year old males and 5 year old females are the most vulnerable to poverty, with 97 males (21.6%) and 16 females (100.0%) in their respective age groups living below the poverty level.
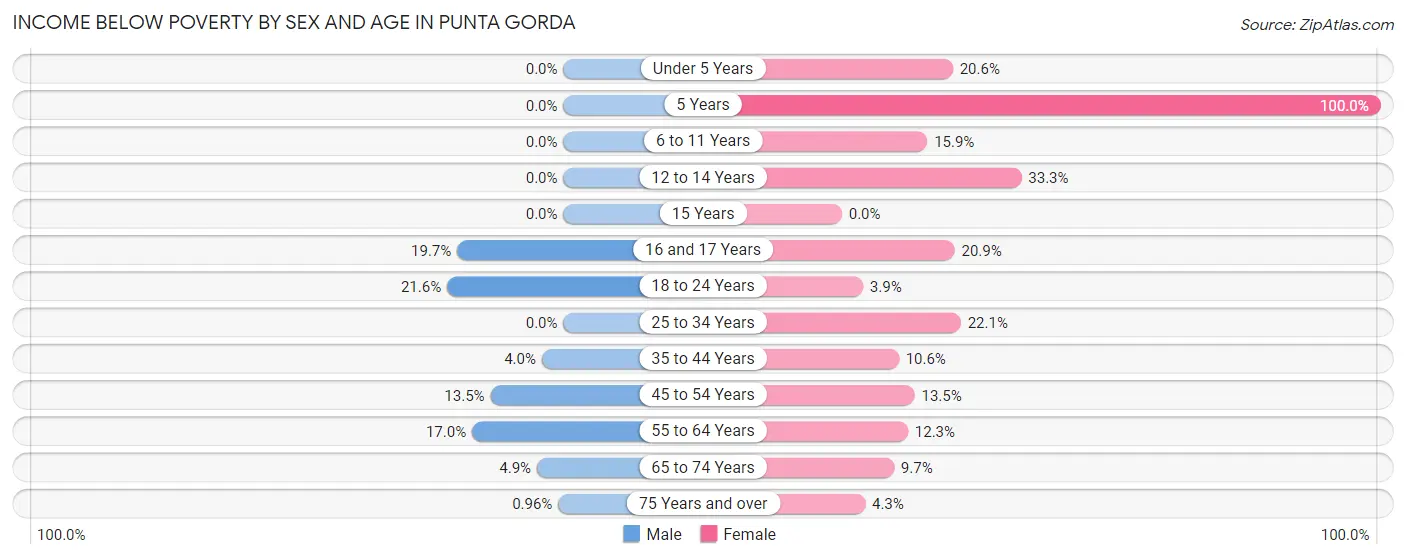
| Age Bracket | Male | Female |
| Under 5 Years | 0 (0.0%) | 49 (20.6%) |
| 5 Years | 0 (0.0%) | 16 (100.0%) |
| 6 to 11 Years | 0 (0.0%) | 45 (15.9%) |
| 12 to 14 Years | 0 (0.0%) | 59 (33.3%) |
| 15 Years | 0 (0.0%) | 0 (0.0%) |
| 16 and 17 Years | 43 (19.7%) | 27 (20.9%) |
| 18 to 24 Years | 97 (21.6%) | 12 (3.9%) |
| 25 to 34 Years | 0 (0.0%) | 68 (22.1%) |
| 35 to 44 Years | 15 (4.0%) | 49 (10.6%) |
| 45 to 54 Years | 111 (13.5%) | 113 (13.5%) |
| 55 to 64 Years | 266 (17.0%) | 241 (12.3%) |
| 65 to 74 Years | 115 (4.9%) | 250 (9.7%) |
| 75 Years and over | 26 (1.0%) | 106 (4.3%) |
| Total | 673 (7.0%) | 1,035 (10.5%) |
Income Above Poverty by Sex and Age in Punta Gorda
According to the poverty statistics in Punta Gorda, males aged under 5 years and females aged 15 years are the age groups that are most secure financially, with 100.0% of males and 100.0% of females in these age groups living above the poverty line.
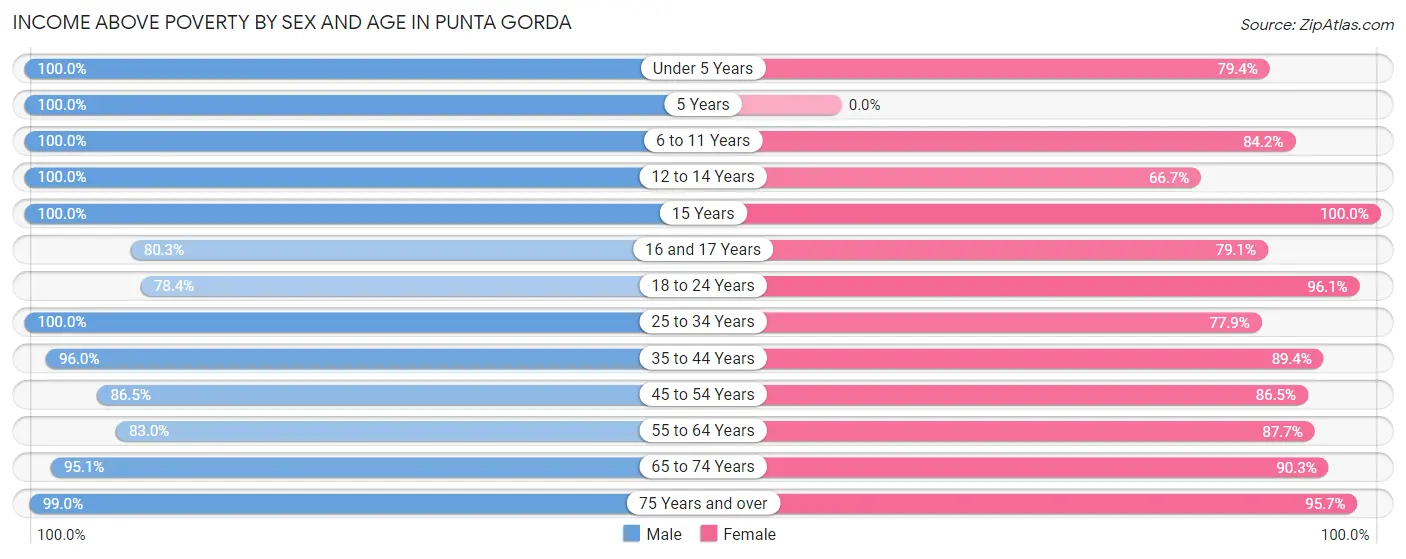
| Age Bracket | Male | Female |
| Under 5 Years | 161 (100.0%) | 189 (79.4%) |
| 5 Years | 21 (100.0%) | 0 (0.0%) |
| 6 to 11 Years | 285 (100.0%) | 239 (84.2%) |
| 12 to 14 Years | 210 (100.0%) | 118 (66.7%) |
| 15 Years | 7 (100.0%) | 103 (100.0%) |
| 16 and 17 Years | 175 (80.3%) | 102 (79.1%) |
| 18 to 24 Years | 352 (78.4%) | 294 (96.1%) |
| 25 to 34 Years | 364 (100.0%) | 240 (77.9%) |
| 35 to 44 Years | 360 (96.0%) | 415 (89.4%) |
| 45 to 54 Years | 709 (86.5%) | 724 (86.5%) |
| 55 to 64 Years | 1,302 (83.0%) | 1,725 (87.7%) |
| 65 to 74 Years | 2,230 (95.1%) | 2,334 (90.3%) |
| 75 Years and over | 2,692 (99.0%) | 2,356 (95.7%) |
| Total | 8,868 (92.9%) | 8,839 (89.5%) |
Income Below Poverty Among Married-Couple Families in Punta Gorda
The poverty statistics for married-couple families in Punta Gorda show that 5.0% or 287 of the total 5,702 families live below the poverty line. Families with 1 or 2 children have the highest poverty rate of 9.8%, comprising of 51 families. On the other hand, families with 3 or 4 children have the lowest poverty rate of 0.0%, which includes 0 families.
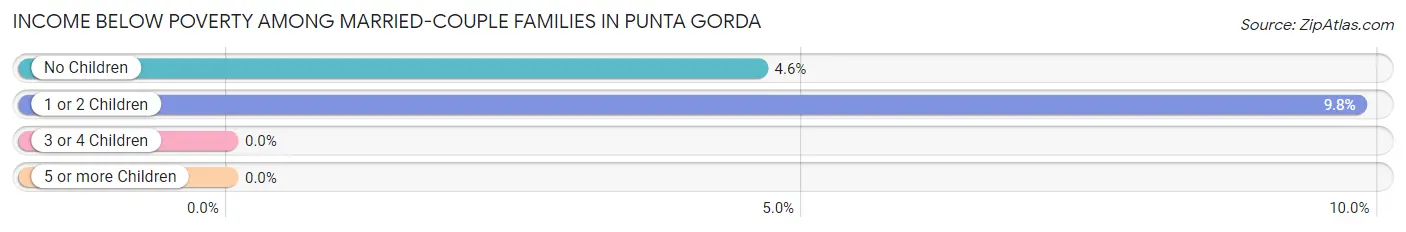
| Children | Above Poverty | Below Poverty |
| No Children | 4,883 (95.4%) | 236 (4.6%) |
| 1 or 2 Children | 468 (90.2%) | 51 (9.8%) |
| 3 or 4 Children | 43 (100.0%) | 0 (0.0%) |
| 5 or more Children | 21 (100.0%) | 0 (0.0%) |
| Total | 5,415 (95.0%) | 287 (5.0%) |
Income Below Poverty Among Single-Parent Households in Punta Gorda
According to the poverty data in Punta Gorda, 19.3% or 55 single-father households and 19.9% or 90 single-mother households are living below the poverty line. Among single-father households, those with 1 or 2 children have the highest poverty rate, with 55 households (31.8%) experiencing poverty. Likewise, among single-mother households, those with 1 or 2 children have the highest poverty rate, with 90 households (26.6%) falling below the poverty line.
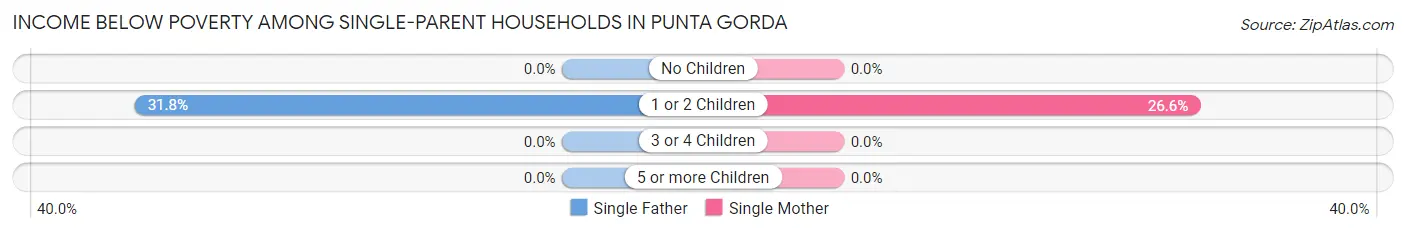
| Children | Single Father | Single Mother |
| No Children | 0 (0.0%) | 0 (0.0%) |
| 1 or 2 Children | 55 (31.8%) | 90 (26.6%) |
| 3 or 4 Children | 0 (0.0%) | 0 (0.0%) |
| 5 or more Children | 0 (0.0%) | 0 (0.0%) |
| Total | 55 (19.3%) | 90 (19.9%) |
Income Below Poverty Among Married-Couple vs Single-Parent Households in Punta Gorda
The poverty data for Punta Gorda shows that 287 of the married-couple family households (5.0%) and 145 of the single-parent households (19.7%) are living below the poverty level. Within the married-couple family households, those with 1 or 2 children have the highest poverty rate, with 51 households (9.8%) falling below the poverty line. Among the single-parent households, those with 1 or 2 children have the highest poverty rate, with 145 household (28.3%) living below poverty.
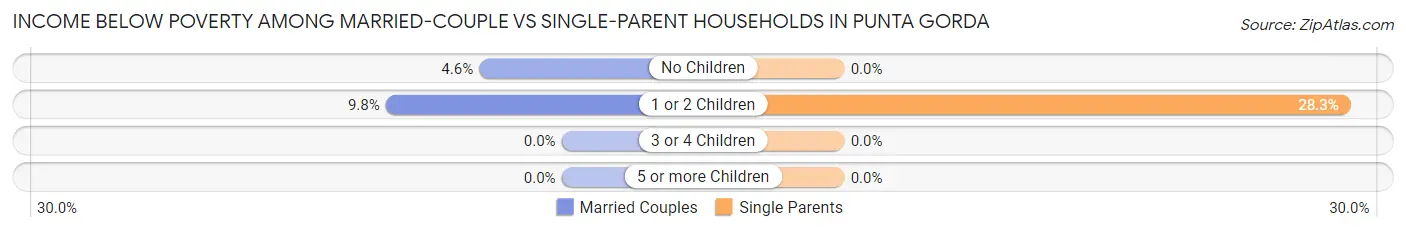
| Children | Married-Couple Families | Single-Parent Households |
| No Children | 236 (4.6%) | 0 (0.0%) |
| 1 or 2 Children | 51 (9.8%) | 145 (28.3%) |
| 3 or 4 Children | 0 (0.0%) | 0 (0.0%) |
| 5 or more Children | 0 (0.0%) | 0 (0.0%) |
| Total | 287 (5.0%) | 145 (19.7%) |
Race in Punta Gorda
The most populous races in Punta Gorda are White / Caucasian (17,563 | 89.6%), Two or more Races (1,154 | 5.9%), and Hispanic or Latino (810 | 4.1%).
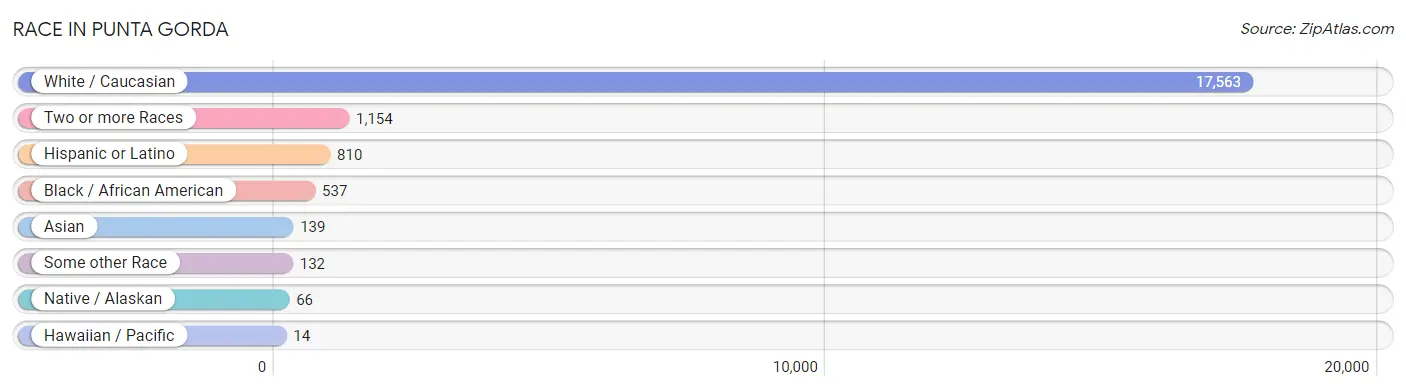
| Race | # Population | % Population |
| Asian | 139 | 0.7% |
| Black / African American | 537 | 2.7% |
| Hawaiian / Pacific | 14 | 0.1% |
| Hispanic or Latino | 810 | 4.1% |
| Native / Alaskan | 66 | 0.3% |
| White / Caucasian | 17,563 | 89.6% |
| Two or more Races | 1,154 | 5.9% |
| Some other Race | 132 | 0.7% |
| Total | 19,605 | 100.0% |
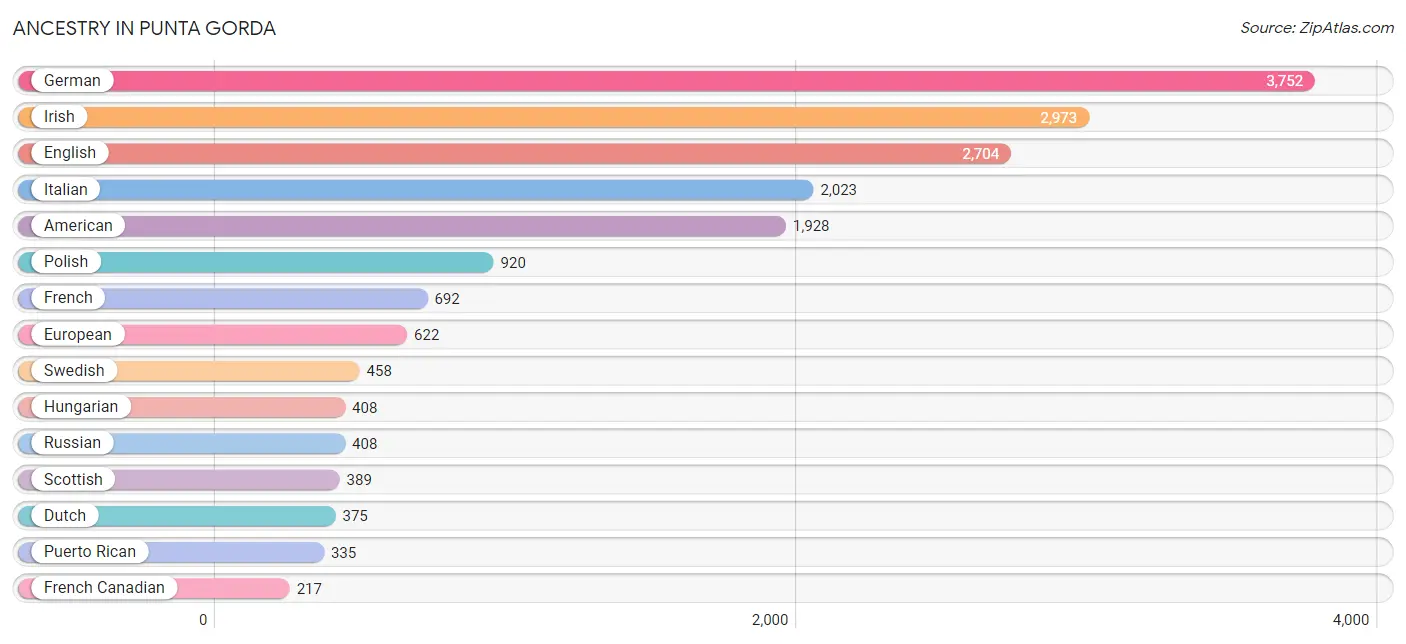
Ancestry in Punta Gorda
The most populous ancestries reported in Punta Gorda are German (3,752 | 19.1%), Irish (2,973 | 15.2%), English (2,704 | 13.8%), Italian (2,023 | 10.3%), and American (1,928 | 9.8%), together accounting for 68.2% of all Punta Gorda residents.
| Ancestry | # Population | % Population |
| African | 60 | 0.3% |
| Albanian | 20 | 0.1% |
| American | 1,928 | 9.8% |
| Arab | 123 | 0.6% |
| Australian | 25 | 0.1% |
| Austrian | 47 | 0.2% |
| Belgian | 10 | 0.1% |
| Bhutanese | 14 | 0.1% |
| Brazilian | 40 | 0.2% |
| British | 179 | 0.9% |
| Bulgarian | 14 | 0.1% |
| Burmese | 25 | 0.1% |
| Cajun | 42 | 0.2% |
| Canadian | 215 | 1.1% |
| Cape Verdean | 9 | 0.1% |
| Central American | 80 | 0.4% |
| Central American Indian | 12 | 0.1% |
| Cherokee | 5 | 0.0% |
| Chilean | 26 | 0.1% |
| Colombian | 19 | 0.1% |
| Costa Rican | 12 | 0.1% |
| Croatian | 16 | 0.1% |
| Cuban | 113 | 0.6% |
| Czech | 139 | 0.7% |
| Czechoslovakian | 8 | 0.0% |
| Danish | 121 | 0.6% |
| Dominican | 29 | 0.2% |
| Dutch | 375 | 1.9% |
| Eastern European | 107 | 0.5% |
| Ecuadorian | 26 | 0.1% |
| Egyptian | 91 | 0.5% |
| English | 2,704 | 13.8% |
| European | 622 | 3.2% |
| Finnish | 31 | 0.2% |
| French | 692 | 3.5% |
| French American Indian | 19 | 0.1% |
| French Canadian | 217 | 1.1% |
| German | 3,752 | 19.1% |
| Greek | 145 | 0.7% |
| Guatemalan | 37 | 0.2% |
| Guyanese | 77 | 0.4% |
| Hungarian | 408 | 2.1% |
| Icelander | 11 | 0.1% |
| Iranian | 70 | 0.4% |
| Irish | 2,973 | 15.2% |
| Israeli | 19 | 0.1% |
| Italian | 2,023 | 10.3% |
| Jamaican | 15 | 0.1% |
| Korean | 85 | 0.4% |
| Latvian | 15 | 0.1% |
| Lebanese | 7 | 0.0% |
| Lithuanian | 43 | 0.2% |
| Mexican | 34 | 0.2% |
| Native Hawaiian | 14 | 0.1% |
| New Zealander | 9 | 0.1% |
| Northern European | 36 | 0.2% |
| Norwegian | 201 | 1.0% |
| Pakistani | 39 | 0.2% |
| Palestinian | 17 | 0.1% |
| Pennsylvania German | 10 | 0.1% |
| Polish | 920 | 4.7% |
| Portuguese | 148 | 0.7% |
| Puerto Rican | 335 | 1.7% |
| Russian | 408 | 2.1% |
| Salvadoran | 31 | 0.2% |
| Scandinavian | 96 | 0.5% |
| Scotch-Irish | 130 | 0.7% |
| Scottish | 389 | 2.0% |
| Serbian | 18 | 0.1% |
| Slovak | 68 | 0.4% |
| Slovene | 8 | 0.0% |
| South African | 11 | 0.1% |
| South American | 148 | 0.7% |
| Spaniard | 66 | 0.3% |
| Subsaharan African | 80 | 0.4% |
| Swedish | 458 | 2.3% |
| Swiss | 8 | 0.0% |
| Thai | 7 | 0.0% |
| Tongan | 14 | 0.1% |
| Ukrainian | 84 | 0.4% |
| Welsh | 136 | 0.7% |
| Yugoslavian | 79 | 0.4% | View All 82 Rows |
Immigrants in Punta Gorda
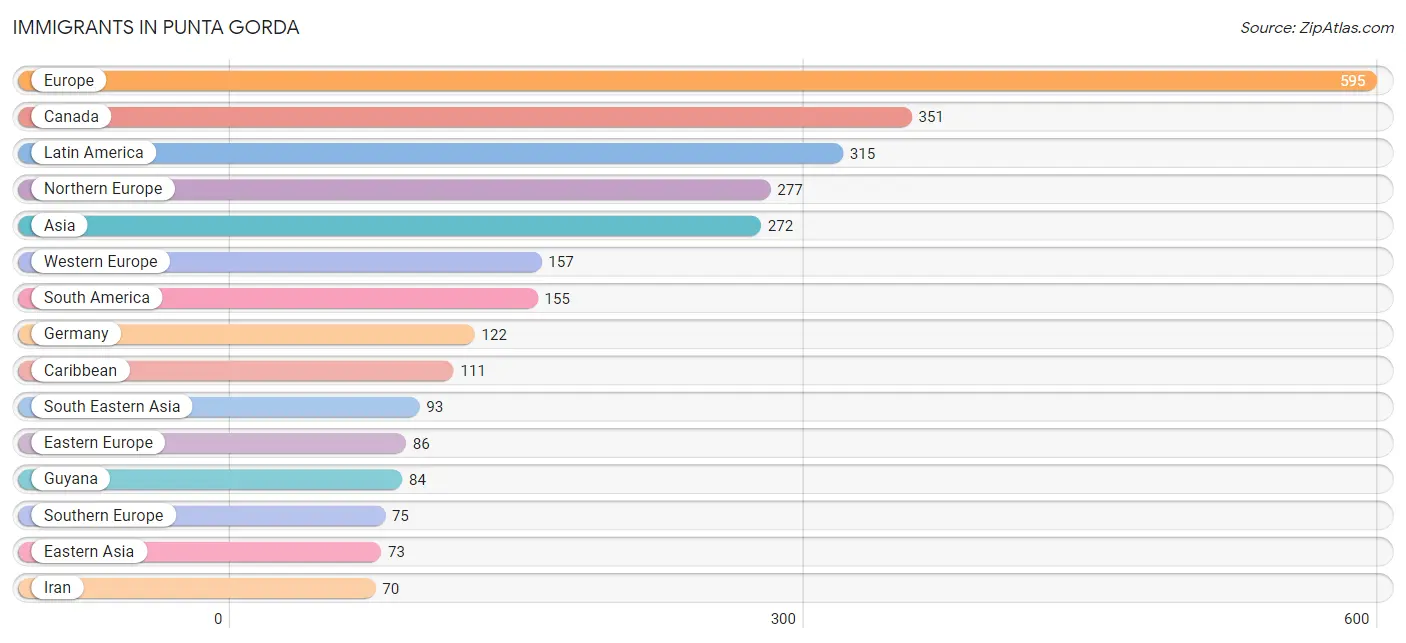
The most numerous immigrant groups reported in Punta Gorda came from Europe (595 | 3.0%), Canada (351 | 1.8%), Latin America (315 | 1.6%), Northern Europe (277 | 1.4%), and Asia (272 | 1.4%), together accounting for 9.2% of all Punta Gorda residents.
| Immigration Origin | # Population | % Population |
| Africa | 39 | 0.2% |
| Asia | 272 | 1.4% |
| Australia | 25 | 0.1% |
| Belize | 12 | 0.1% |
| Bosnia and Herzegovina | 17 | 0.1% |
| Brazil | 19 | 0.1% |
| Bulgaria | 14 | 0.1% |
| Canada | 351 | 1.8% |
| Caribbean | 111 | 0.6% |
| Central America | 49 | 0.3% |
| Chile | 26 | 0.1% |
| Cuba | 67 | 0.3% |
| Czechoslovakia | 10 | 0.1% |
| Dominican Republic | 29 | 0.2% |
| Eastern Asia | 73 | 0.4% |
| Eastern Europe | 86 | 0.4% |
| Ecuador | 26 | 0.1% |
| Egypt | 28 | 0.1% |
| England | 62 | 0.3% |
| Europe | 595 | 3.0% |
| France | 8 | 0.0% |
| Germany | 122 | 0.6% |
| Greece | 24 | 0.1% |
| Guatemala | 37 | 0.2% |
| Guyana | 84 | 0.4% |
| Hungary | 9 | 0.1% |
| Iran | 70 | 0.4% |
| Ireland | 57 | 0.3% |
| Israel | 19 | 0.1% |
| Italy | 51 | 0.3% |
| Jamaica | 15 | 0.1% |
| Japan | 53 | 0.3% |
| Korea | 20 | 0.1% |
| Latin America | 315 | 1.6% |
| Netherlands | 19 | 0.1% |
| Northern Africa | 28 | 0.1% |
| Northern Europe | 277 | 1.4% |
| Oceania | 34 | 0.2% |
| Philippines | 54 | 0.3% |
| Poland | 11 | 0.1% |
| Russia | 17 | 0.1% |
| South Africa | 11 | 0.1% |
| South America | 155 | 0.8% |
| South Central Asia | 70 | 0.4% |
| South Eastern Asia | 93 | 0.5% |
| Southern Europe | 75 | 0.4% |
| Sweden | 50 | 0.3% |
| Switzerland | 8 | 0.0% |
| Thailand | 39 | 0.2% |
| Ukraine | 8 | 0.0% |
| Western Asia | 19 | 0.1% |
| Western Europe | 157 | 0.8% | View All 52 Rows |
Sex and Age in Punta Gorda
Sex and Age in Punta Gorda
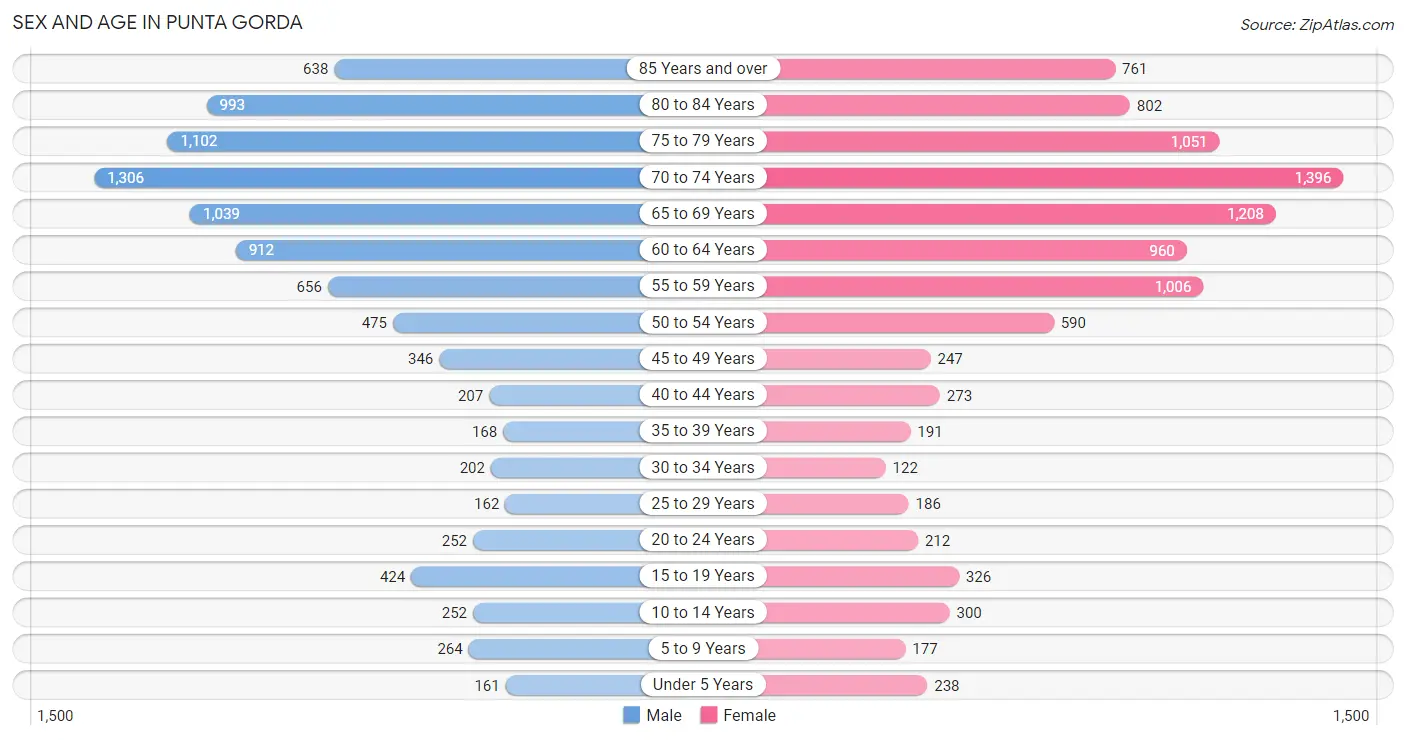
The most populous age groups in Punta Gorda are 70 to 74 Years (1,306 | 13.7%) for men and 70 to 74 Years (1,396 | 13.9%) for women.
| Age Bracket | Male | Female |
| Under 5 Years | 161 (1.7%) | 238 (2.4%) |
| 5 to 9 Years | 264 (2.8%) | 177 (1.8%) |
| 10 to 14 Years | 252 (2.6%) | 300 (3.0%) |
| 15 to 19 Years | 424 (4.4%) | 326 (3.3%) |
| 20 to 24 Years | 252 (2.6%) | 212 (2.1%) |
| 25 to 29 Years | 162 (1.7%) | 186 (1.8%) |
| 30 to 34 Years | 202 (2.1%) | 122 (1.2%) |
| 35 to 39 Years | 168 (1.8%) | 191 (1.9%) |
| 40 to 44 Years | 207 (2.2%) | 273 (2.7%) |
| 45 to 49 Years | 346 (3.6%) | 247 (2.5%) |
| 50 to 54 Years | 475 (5.0%) | 590 (5.9%) |
| 55 to 59 Years | 656 (6.9%) | 1,006 (10.0%) |
| 60 to 64 Years | 912 (9.5%) | 960 (9.6%) |
| 65 to 69 Years | 1,039 (10.9%) | 1,208 (12.0%) |
| 70 to 74 Years | 1,306 (13.7%) | 1,396 (13.9%) |
| 75 to 79 Years | 1,102 (11.5%) | 1,051 (10.5%) |
| 80 to 84 Years | 993 (10.4%) | 802 (8.0%) |
| 85 Years and over | 638 (6.7%) | 761 (7.6%) |
| Total | 9,559 (100.0%) | 10,046 (100.0%) |
Families and Households in Punta Gorda
Median Family Size in Punta Gorda
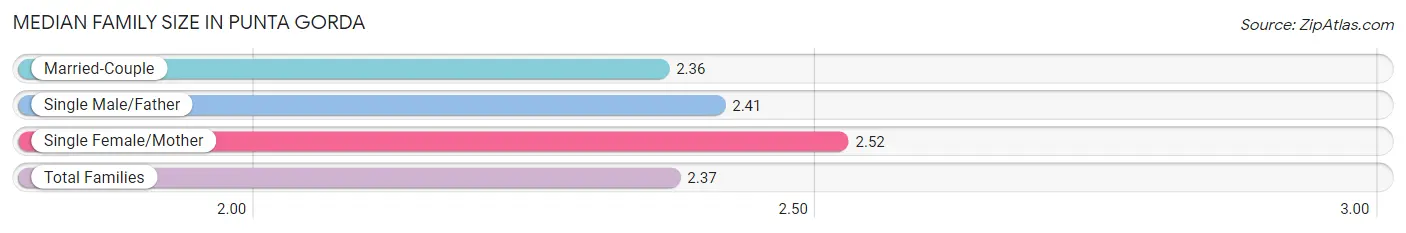
The median family size in Punta Gorda is 2.37 persons per family, with single female/mother families (453 | 7.0%) accounting for the largest median family size of 2.52 persons per family. On the other hand, married-couple families (5,702 | 88.5%) represent the smallest median family size with 2.36 persons per family.
| Family Type | # Families | Family Size |
| Married-Couple | 5,702 (88.5%) | 2.36 |
| Single Male/Father | 285 (4.4%) | 2.41 |
| Single Female/Mother | 453 (7.0%) | 2.52 |
| Total Families | 6,440 (100.0%) | 2.37 |
Median Household Size in Punta Gorda
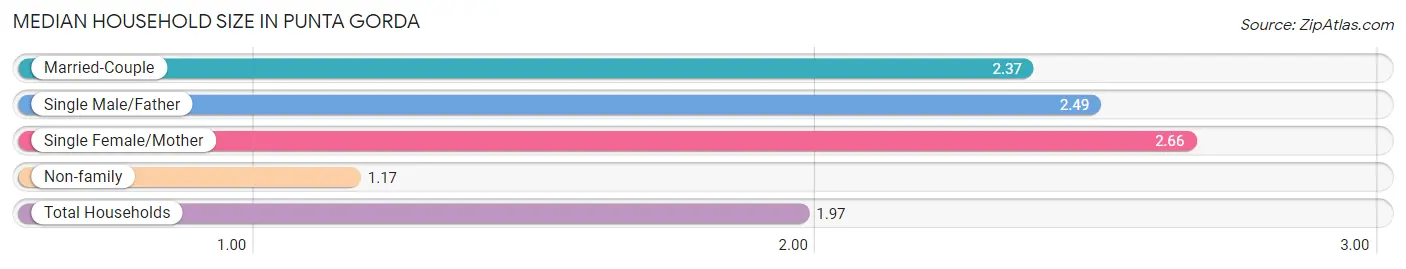
The median household size in Punta Gorda is 1.97 persons per household, with single female/mother households (453 | 4.6%) accounting for the largest median household size of 2.66 persons per household. non-family households (3,387 | 34.5%) represent the smallest median household size with 1.17 persons per household.
| Household Type | # Households | Household Size |
| Married-Couple | 5,702 (58.0%) | 2.37 |
| Single Male/Father | 285 (2.9%) | 2.49 |
| Single Female/Mother | 453 (4.6%) | 2.66 |
| Non-family | 3,387 (34.5%) | 1.17 |
| Total Households | 9,827 (100.0%) | 1.97 |
Household Size by Marriage Status in Punta Gorda
Out of a total of 9,827 households in Punta Gorda, 6,440 (65.5%) are family households, while 3,387 (34.5%) are nonfamily households. The most numerous type of family households are 2-person households, comprising 5,164, and the most common type of nonfamily households are 1-person households, comprising 2,845.
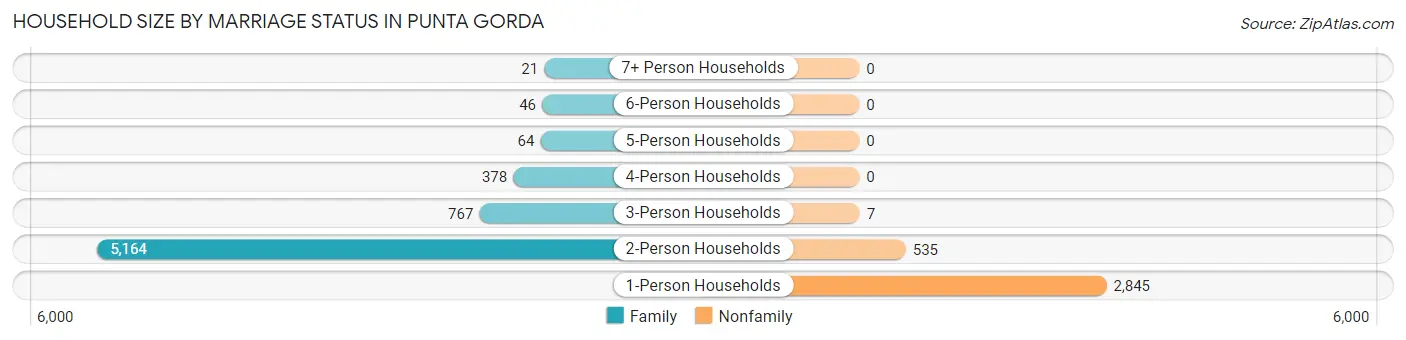
| Household Size | Family Households | Nonfamily Households |
| 1-Person Households | - | 2,845 (28.9%) |
| 2-Person Households | 5,164 (52.5%) | 535 (5.4%) |
| 3-Person Households | 767 (7.8%) | 7 (0.1%) |
| 4-Person Households | 378 (3.8%) | 0 (0.0%) |
| 5-Person Households | 64 (0.6%) | 0 (0.0%) |
| 6-Person Households | 46 (0.5%) | 0 (0.0%) |
| 7+ Person Households | 21 (0.2%) | 0 (0.0%) |
| Total | 6,440 (65.5%) | 3,387 (34.5%) |
Female Fertility in Punta Gorda
Fertility by Age in Punta Gorda
Average fertility rate in Punta Gorda is 16.0 births per 1,000 women. Women in the age bracket of 35 to 50 years have the highest fertility rate with 31.0 births per 1,000 women. Women in the age bracket of 35 to 50 years acount for 100.0% of all women with births.
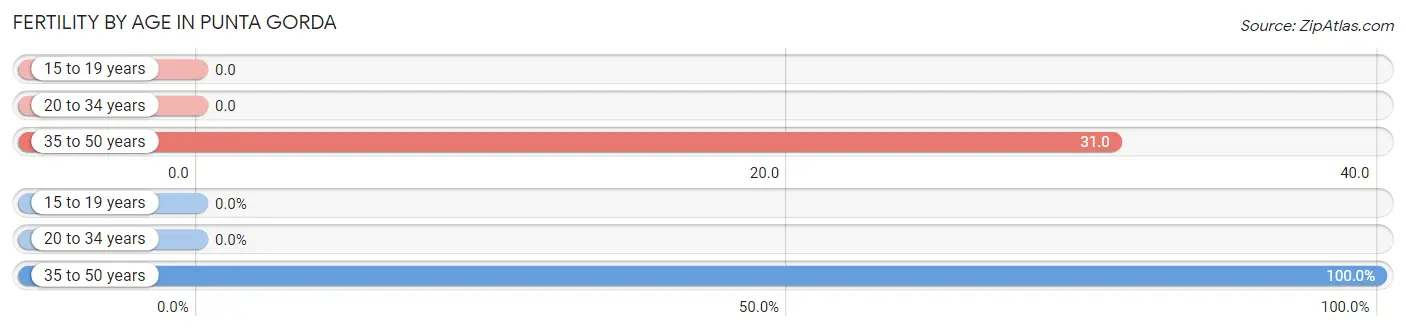
| Age Bracket | Women with Births | Births / 1,000 Women |
| 15 to 19 years | 0 (0.0%) | 0.0 |
| 20 to 34 years | 0 (0.0%) | 0.0 |
| 35 to 50 years | 26 (100.0%) | 31.0 |
| Total | 26 (100.0%) | 16.0 |
Fertility by Age by Marriage Status in Punta Gorda
84.6% of women with births (26) in Punta Gorda are married. The highest percentage of unmarried women with births falls into 35 to 50 years age bracket with 15.4% of them unmarried at the time of birth, while the lowest percentage of unmarried women with births belong to 35 to 50 years age bracket with 15.4% of them unmarried.
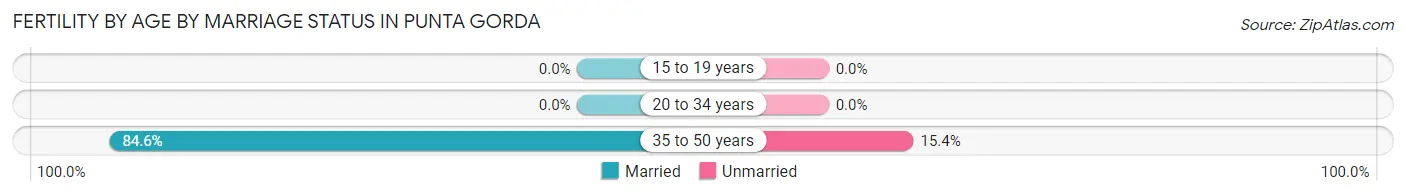
| Age Bracket | Married | Unmarried |
| 15 to 19 years | 0 (0.0%) | 0 (0.0%) |
| 20 to 34 years | 0 (0.0%) | 0 (0.0%) |
| 35 to 50 years | 22 (84.6%) | 4 (15.4%) |
| Total | 22 (84.6%) | 4 (15.4%) |
Fertility by Education in Punta Gorda
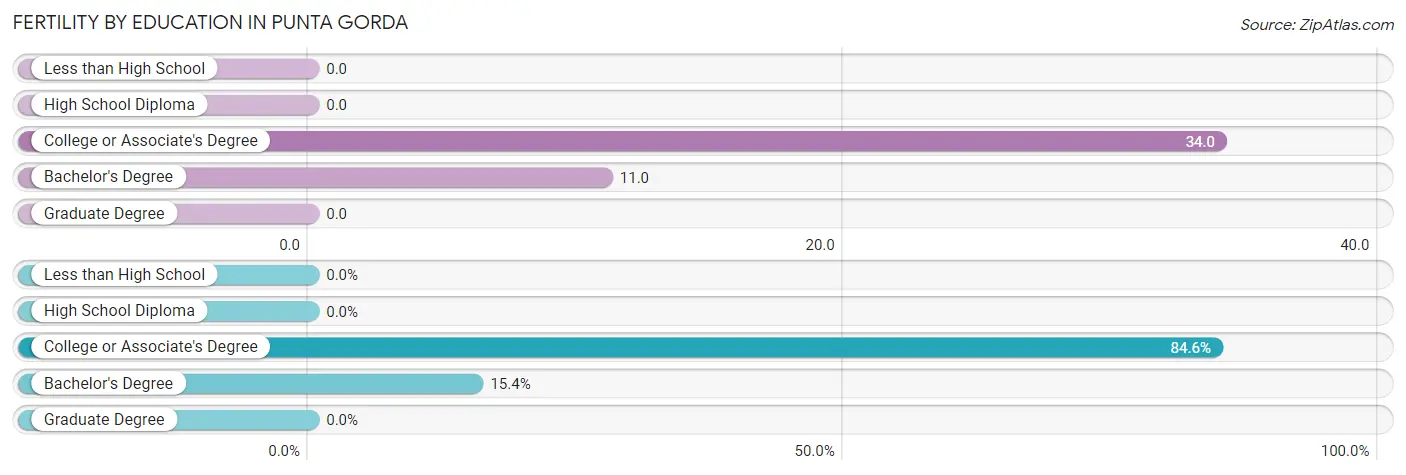
| Educational Attainment | Women with Births | Births / 1,000 Women |
| Less than High School | 0 (0.0%) | 0.0 |
| High School Diploma | 0 (0.0%) | 0.0 |
| College or Associate's Degree | 22 (84.6%) | 34.0 |
| Bachelor's Degree | 4 (15.4%) | 11.0 |
| Graduate Degree | 0 (0.0%) | 0.0 |
| Total | 26 (100.0%) | 16.0 |
Fertility by Education by Marriage Status in Punta Gorda
15.4% of women with births in Punta Gorda are unmarried. Women with the educational attainment of college or associate's degree are most likely to be married with 100.0% of them married at childbirth, while women with the educational attainment of bachelor's degree are least likely to be married with 100.0% of them unmarried at childbirth.
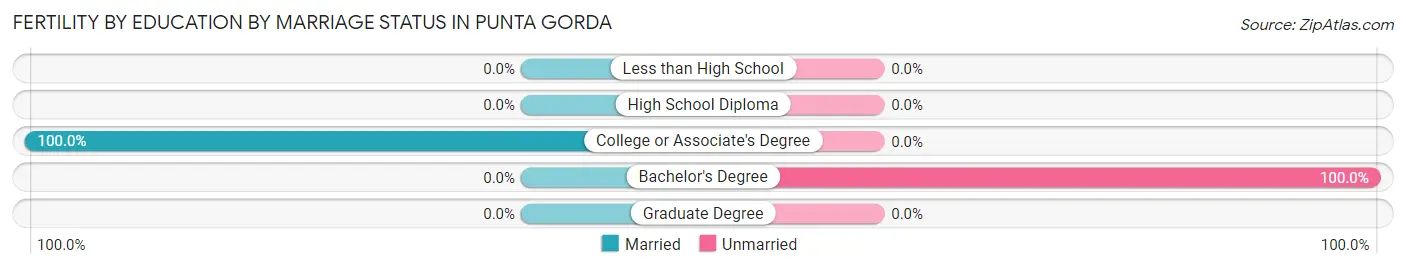
| Educational Attainment | Married | Unmarried |
| Less than High School | 0 (0.0%) | 0 (0.0%) |
| High School Diploma | 0 (0.0%) | 0 (0.0%) |
| College or Associate's Degree | 22 (100.0%) | 0 (0.0%) |
| Bachelor's Degree | 0 (0.0%) | 4 (100.0%) |
| Graduate Degree | 0 (0.0%) | 0 (0.0%) |
| Total | 22 (84.6%) | 4 (15.4%) |
Employment Characteristics in Punta Gorda
Employment by Class of Employer in Punta Gorda
Among the 5,330 employed individuals in Punta Gorda, private company employees (3,340 | 62.7%), local government employees (559 | 10.5%), and self-employed (not incorporated) (501 | 9.4%) make up the most common classes of employment.
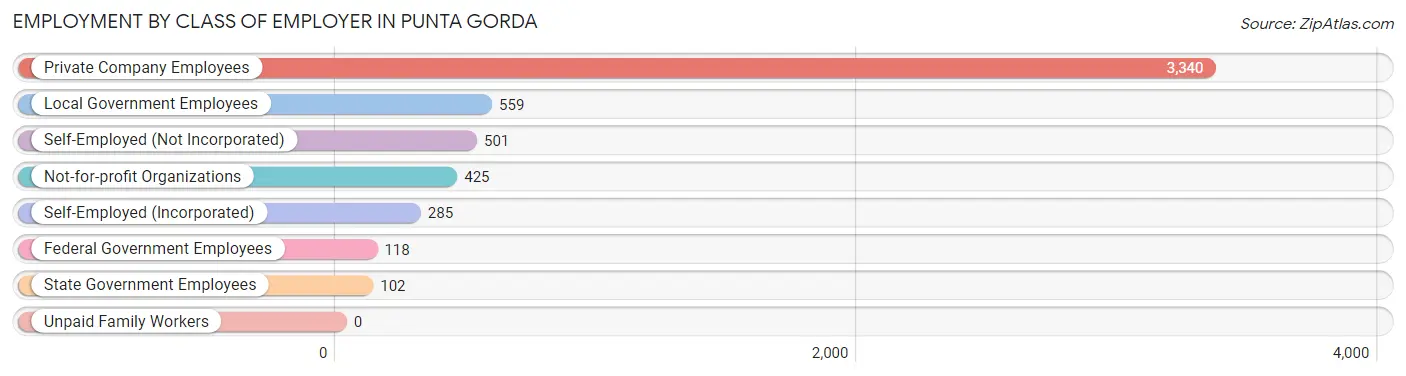
| Employer Class | # Employees | % Employees |
| Private Company Employees | 3,340 | 62.7% |
| Self-Employed (Incorporated) | 285 | 5.3% |
| Self-Employed (Not Incorporated) | 501 | 9.4% |
| Not-for-profit Organizations | 425 | 8.0% |
| Local Government Employees | 559 | 10.5% |
| State Government Employees | 102 | 1.9% |
| Federal Government Employees | 118 | 2.2% |
| Unpaid Family Workers | 0 | 0.0% |
| Total | 5,330 | 100.0% |
Employment Status by Age in Punta Gorda
According to the labor force statistics for Punta Gorda, out of the total population over 16 years of age (18,103), 31.8% or 5,757 individuals are in the labor force, with 4.9% or 282 of them unemployed. The age group with the highest labor force participation rate is 25 to 29 years, with 100.0% or 348 individuals in the labor force. Within the labor force, the 16 to 19 years age range has the highest percentage of unemployed individuals, with 23.9% or 68 of them being unemployed.
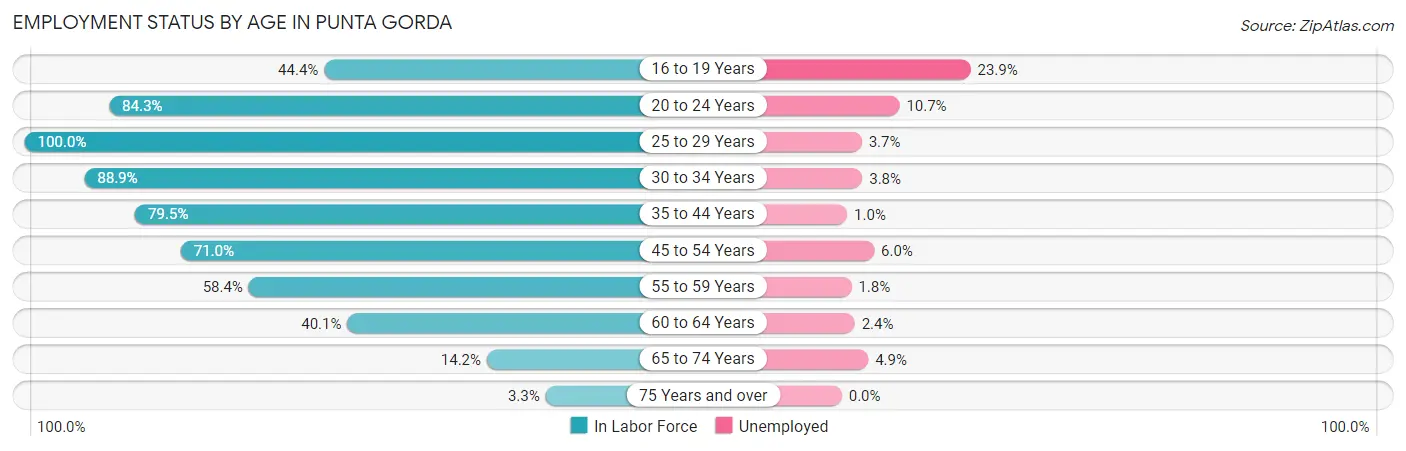
| Age Bracket | In Labor Force | Unemployed |
| 16 to 19 Years | 284 (44.4%) | 68 (23.9%) |
| 20 to 24 Years | 391 (84.3%) | 42 (10.7%) |
| 25 to 29 Years | 348 (100.0%) | 13 (3.7%) |
| 30 to 34 Years | 288 (88.9%) | 11 (3.8%) |
| 35 to 44 Years | 667 (79.5%) | 7 (1.0%) |
| 45 to 54 Years | 1,177 (71.0%) | 71 (6.0%) |
| 55 to 59 Years | 971 (58.4%) | 17 (1.8%) |
| 60 to 64 Years | 751 (40.1%) | 18 (2.4%) |
| 65 to 74 Years | 703 (14.2%) | 34 (4.9%) |
| 75 Years and over | 176 (3.3%) | 0 (0.0%) |
| Total | 5,757 (31.8%) | 282 (4.9%) |
Employment Status by Educational Attainment in Punta Gorda
According to labor force statistics for Punta Gorda, 62.7% of individuals (4,203) out of the total population between 25 and 64 years of age (6,703) are in the labor force, with 3.3% or 139 of them being unemployed. The group with the highest labor force participation rate are those with the educational attainment of bachelor's degree or higher, with 65.5% or 1,653 individuals in the labor force. Within the labor force, individuals with less than high school education have the highest percentage of unemployment, with 5.9% or 7 of them being unemployed.
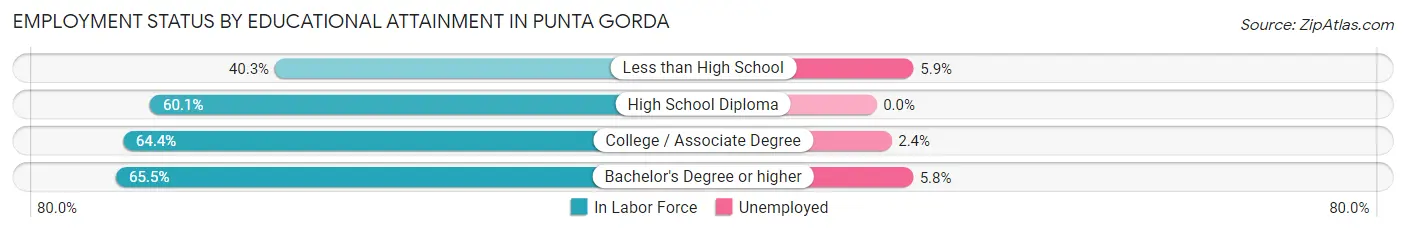
| Educational Attainment | In Labor Force | Unemployed |
| Less than High School | 118 (40.3%) | 17 (5.9%) |
| High School Diploma | 984 (60.1%) | 0 (0.0%) |
| College / Associate Degree | 1,448 (64.4%) | 54 (2.4%) |
| Bachelor's Degree or higher | 1,653 (65.5%) | 146 (5.8%) |
| Total | 4,203 (62.7%) | 221 (3.3%) |
Employment Occupations by Sex in Punta Gorda
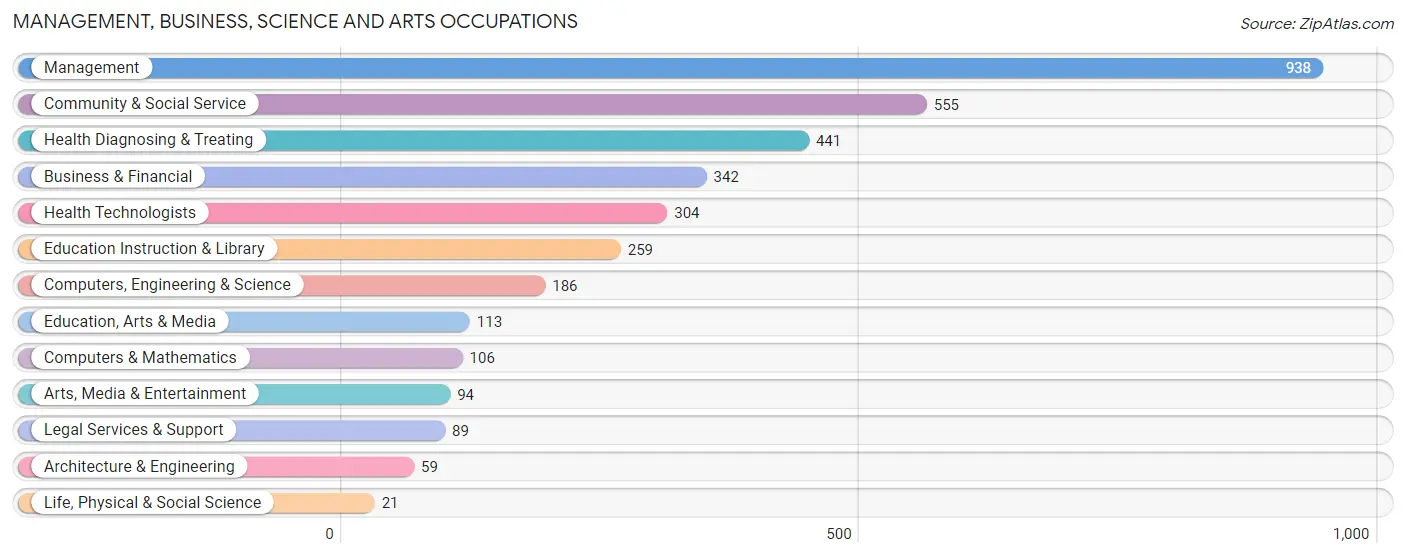
Management, Business, Science and Arts Occupations
The most common Management, Business, Science and Arts occupations in Punta Gorda are Management (938 | 17.1%), Community & Social Service (555 | 10.1%), Health Diagnosing & Treating (441 | 8.1%), Business & Financial (342 | 6.2%), and Health Technologists (304 | 5.6%).
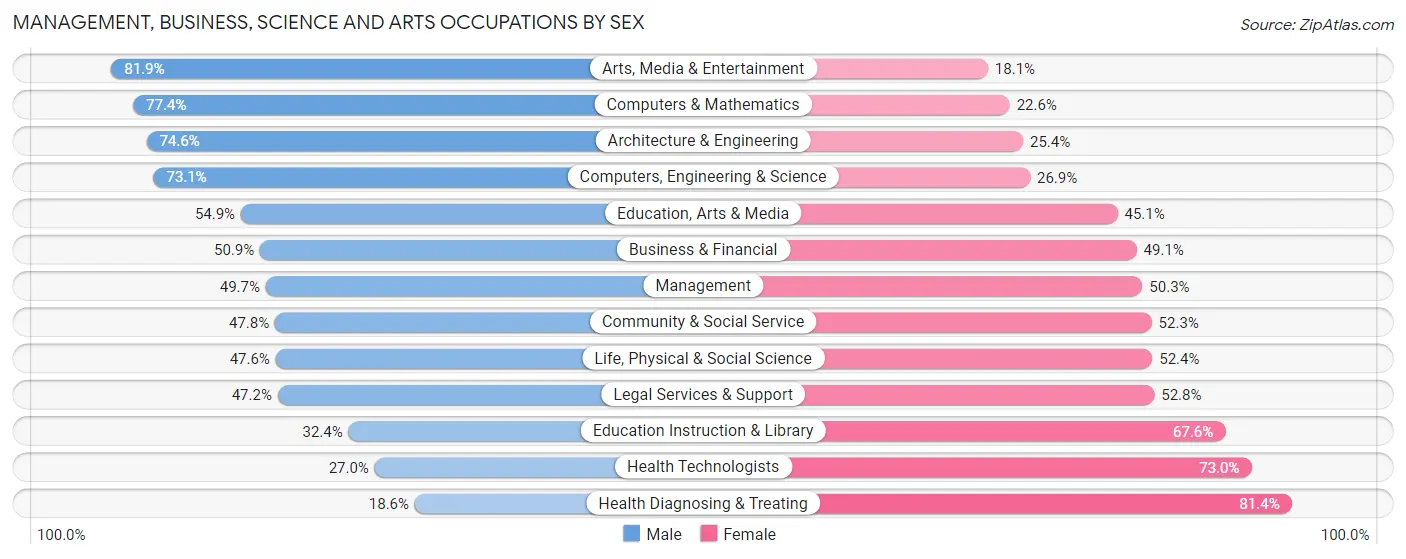
Management, Business, Science and Arts Occupations by Sex
Within the Management, Business, Science and Arts occupations in Punta Gorda, the most male-oriented occupations are Arts, Media & Entertainment (81.9%), Computers & Mathematics (77.4%), and Architecture & Engineering (74.6%), while the most female-oriented occupations are Health Diagnosing & Treating (81.4%), Health Technologists (73.0%), and Education Instruction & Library (67.6%).
| Occupation | Male | Female |
| Management | 466 (49.7%) | 472 (50.3%) |
| Business & Financial | 174 (50.9%) | 168 (49.1%) |
| Computers, Engineering & Science | 136 (73.1%) | 50 (26.9%) |
| Computers & Mathematics | 82 (77.4%) | 24 (22.6%) |
| Architecture & Engineering | 44 (74.6%) | 15 (25.4%) |
| Life, Physical & Social Science | 10 (47.6%) | 11 (52.4%) |
| Community & Social Service | 265 (47.7%) | 290 (52.2%) |
| Education, Arts & Media | 62 (54.9%) | 51 (45.1%) |
| Legal Services & Support | 42 (47.2%) | 47 (52.8%) |
| Education Instruction & Library | 84 (32.4%) | 175 (67.6%) |
| Arts, Media & Entertainment | 77 (81.9%) | 17 (18.1%) |
| Health Diagnosing & Treating | 82 (18.6%) | 359 (81.4%) |
| Health Technologists | 82 (27.0%) | 222 (73.0%) |
| Total (Category) | 1,123 (45.6%) | 1,339 (54.4%) |
| Total (Overall) | 2,968 (54.2%) | 2,505 (45.8%) |
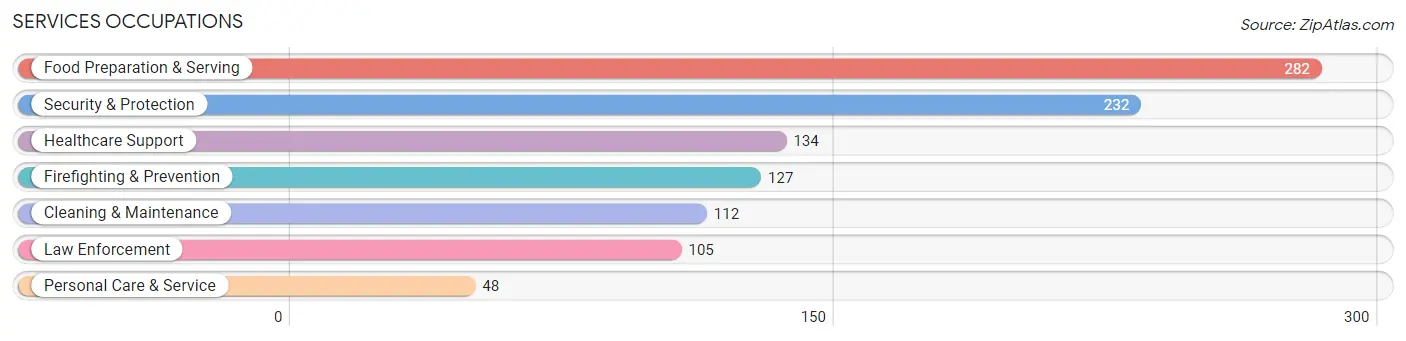
Services Occupations
The most common Services occupations in Punta Gorda are Food Preparation & Serving (282 | 5.1%), Security & Protection (232 | 4.2%), Healthcare Support (134 | 2.5%), Firefighting & Prevention (127 | 2.3%), and Cleaning & Maintenance (112 | 2.1%).
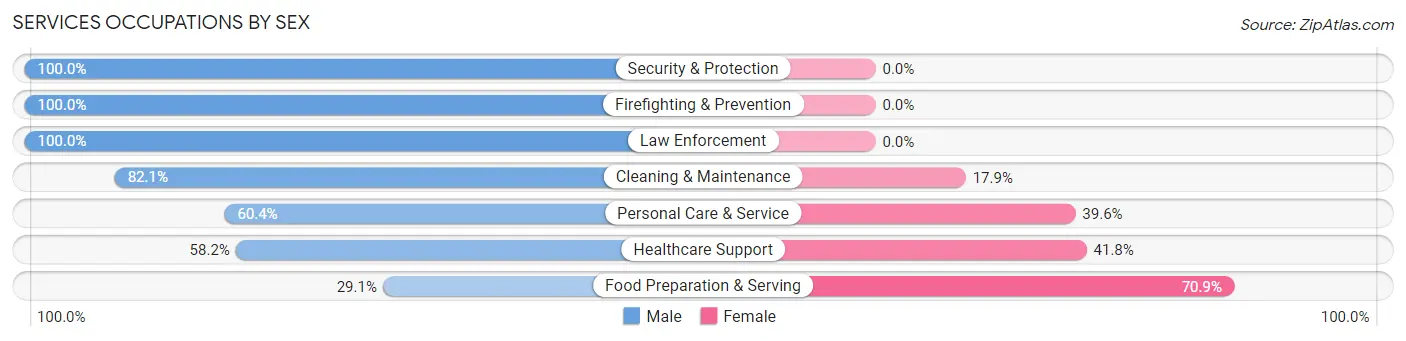
Services Occupations by Sex
Within the Services occupations in Punta Gorda, the most male-oriented occupations are Security & Protection (100.0%), Firefighting & Prevention (100.0%), and Law Enforcement (100.0%), while the most female-oriented occupations are Food Preparation & Serving (70.9%), Healthcare Support (41.8%), and Personal Care & Service (39.6%).
| Occupation | Male | Female |
| Healthcare Support | 78 (58.2%) | 56 (41.8%) |
| Security & Protection | 232 (100.0%) | 0 (0.0%) |
| Firefighting & Prevention | 127 (100.0%) | 0 (0.0%) |
| Law Enforcement | 105 (100.0%) | 0 (0.0%) |
| Food Preparation & Serving | 82 (29.1%) | 200 (70.9%) |
| Cleaning & Maintenance | 92 (82.1%) | 20 (17.9%) |
| Personal Care & Service | 29 (60.4%) | 19 (39.6%) |
| Total (Category) | 513 (63.5%) | 295 (36.5%) |
| Total (Overall) | 2,968 (54.2%) | 2,505 (45.8%) |
Sales and Office Occupations
The most common Sales and Office occupations in Punta Gorda are Sales & Related (1,139 | 20.8%), and Office & Administration (544 | 9.9%).

Sales and Office Occupations by Sex

| Occupation | Male | Female |
| Sales & Related | 831 (73.0%) | 308 (27.0%) |
| Office & Administration | 101 (18.6%) | 443 (81.4%) |
| Total (Category) | 932 (55.4%) | 751 (44.6%) |
| Total (Overall) | 2,968 (54.2%) | 2,505 (45.8%) |
Natural Resources, Construction and Maintenance Occupations
The most common Natural Resources, Construction and Maintenance occupations in Punta Gorda are Construction & Extraction (106 | 1.9%), Installation, Maintenance & Repair (31 | 0.6%), and Farming, Fishing & Forestry (12 | 0.2%).

Natural Resources, Construction and Maintenance Occupations by Sex

| Occupation | Male | Female |
| Farming, Fishing & Forestry | 0 (0.0%) | 12 (100.0%) |
| Construction & Extraction | 96 (90.6%) | 10 (9.4%) |
| Installation, Maintenance & Repair | 31 (100.0%) | 0 (0.0%) |
| Total (Category) | 127 (85.2%) | 22 (14.8%) |
| Total (Overall) | 2,968 (54.2%) | 2,505 (45.8%) |
Production, Transportation and Moving Occupations
The most common Production, Transportation and Moving occupations in Punta Gorda are Transportation (207 | 3.8%), Material Moving (124 | 2.3%), and Production (40 | 0.7%).
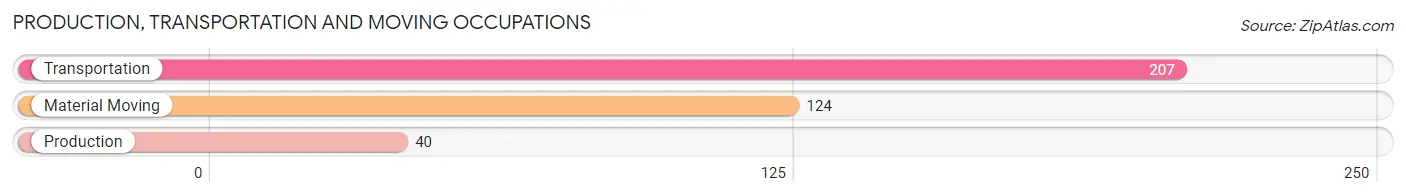
Production, Transportation and Moving Occupations by Sex

| Occupation | Male | Female |
| Production | 32 (80.0%) | 8 (20.0%) |
| Transportation | 138 (66.7%) | 69 (33.3%) |
| Material Moving | 103 (83.1%) | 21 (16.9%) |
| Total (Category) | 273 (73.6%) | 98 (26.4%) |
| Total (Overall) | 2,968 (54.2%) | 2,505 (45.8%) |
Employment Industries by Sex in Punta Gorda
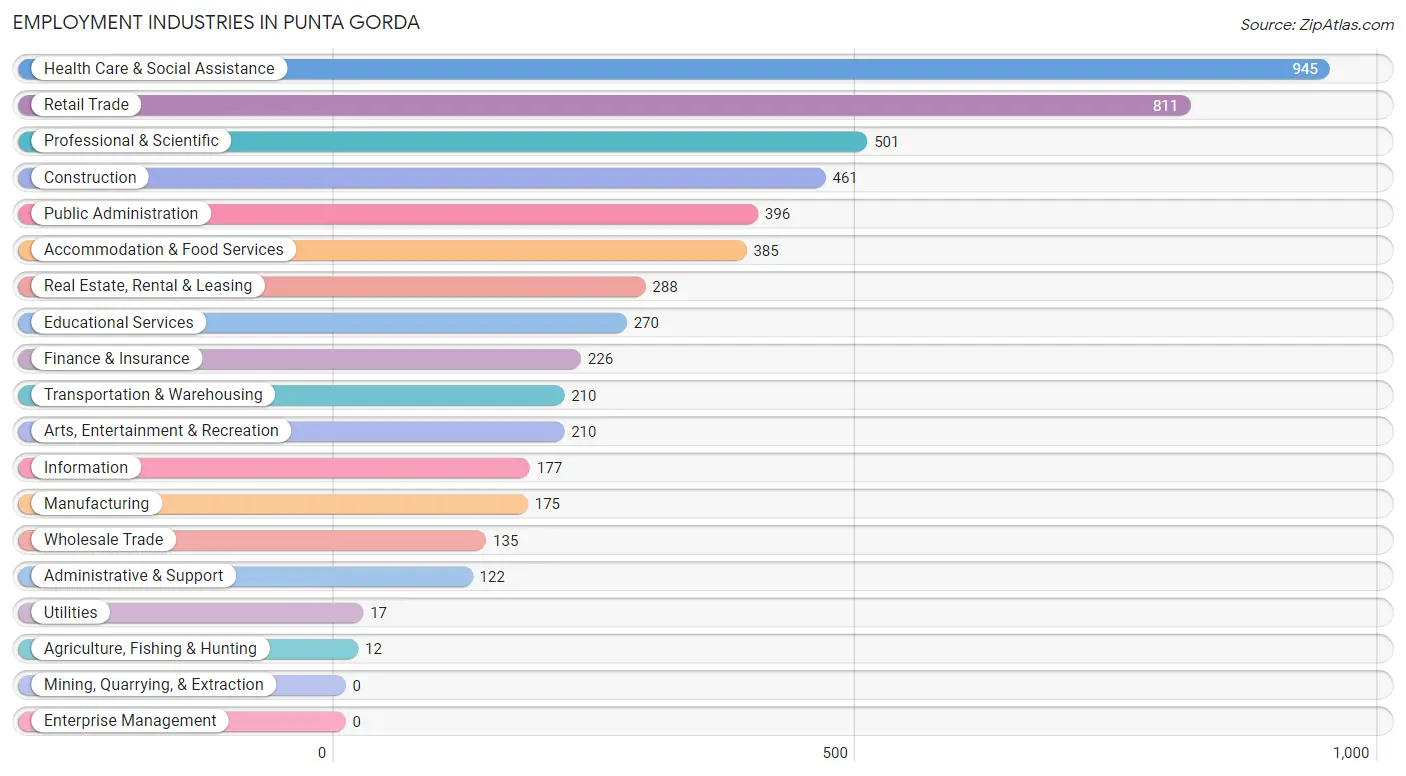
Employment Industries in Punta Gorda
The major employment industries in Punta Gorda include Health Care & Social Assistance (945 | 17.3%), Retail Trade (811 | 14.8%), Professional & Scientific (501 | 9.1%), Construction (461 | 8.4%), and Public Administration (396 | 7.2%).
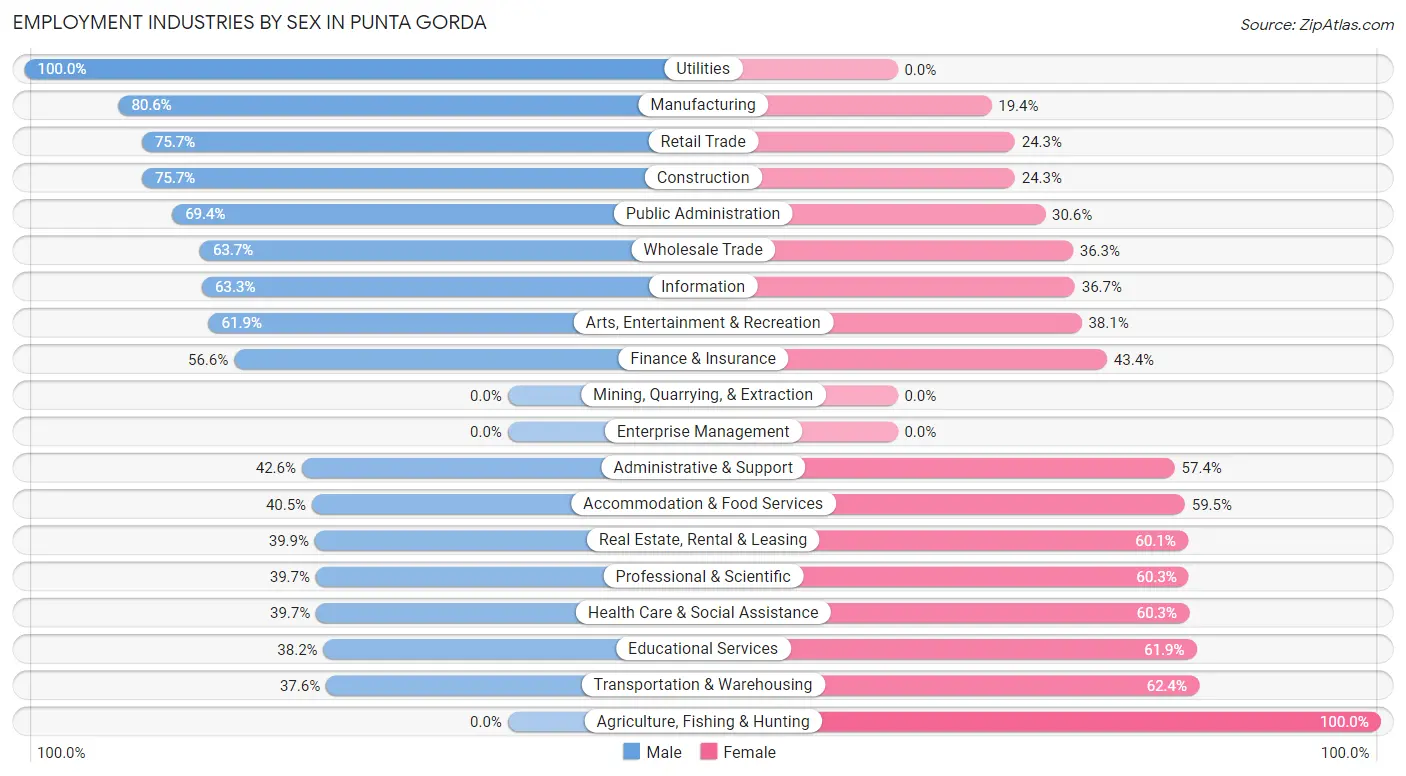
Employment Industries by Sex in Punta Gorda
The Punta Gorda industries that see more men than women are Utilities (100.0%), Manufacturing (80.6%), and Retail Trade (75.7%), whereas the industries that tend to have a higher number of women are Agriculture, Fishing & Hunting (100.0%), Transportation & Warehousing (62.4%), and Educational Services (61.9%).
| Industry | Male | Female |
| Agriculture, Fishing & Hunting | 0 (0.0%) | 12 (100.0%) |
| Mining, Quarrying, & Extraction | 0 (0.0%) | 0 (0.0%) |
| Construction | 349 (75.7%) | 112 (24.3%) |
| Manufacturing | 141 (80.6%) | 34 (19.4%) |
| Wholesale Trade | 86 (63.7%) | 49 (36.3%) |
| Retail Trade | 614 (75.7%) | 197 (24.3%) |
| Transportation & Warehousing | 79 (37.6%) | 131 (62.4%) |
| Utilities | 17 (100.0%) | 0 (0.0%) |
| Information | 112 (63.3%) | 65 (36.7%) |
| Finance & Insurance | 128 (56.6%) | 98 (43.4%) |
| Real Estate, Rental & Leasing | 115 (39.9%) | 173 (60.1%) |
| Professional & Scientific | 199 (39.7%) | 302 (60.3%) |
| Enterprise Management | 0 (0.0%) | 0 (0.0%) |
| Administrative & Support | 52 (42.6%) | 70 (57.4%) |
| Educational Services | 103 (38.2%) | 167 (61.9%) |
| Health Care & Social Assistance | 375 (39.7%) | 570 (60.3%) |
| Arts, Entertainment & Recreation | 130 (61.9%) | 80 (38.1%) |
| Accommodation & Food Services | 156 (40.5%) | 229 (59.5%) |
| Public Administration | 275 (69.4%) | 121 (30.6%) |
| Total | 2,968 (54.2%) | 2,505 (45.8%) |
Education in Punta Gorda
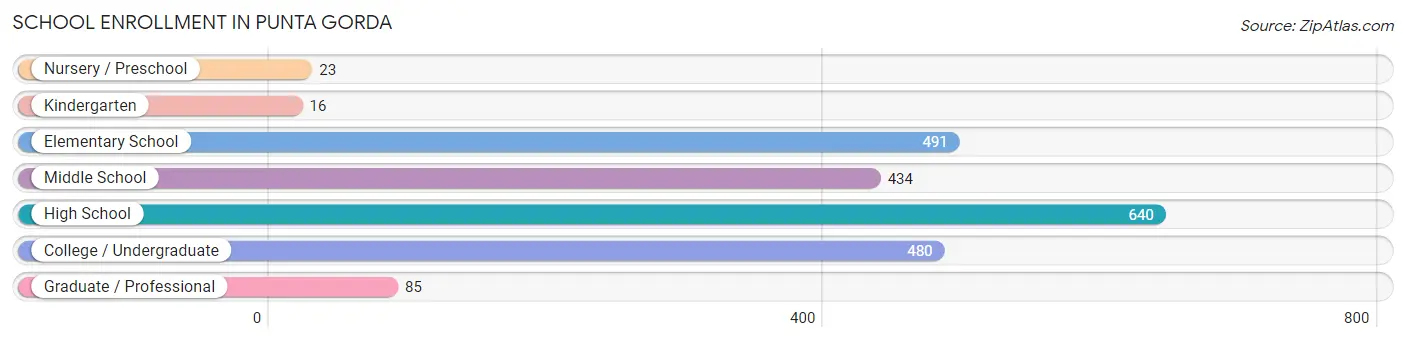
School Enrollment in Punta Gorda
The most common levels of schooling among the 2,169 students in Punta Gorda are high school (640 | 29.5%), elementary school (491 | 22.6%), and college / undergraduate (480 | 22.1%).
| School Level | # Students | % Students |
| Nursery / Preschool | 23 | 1.1% |
| Kindergarten | 16 | 0.7% |
| Elementary School | 491 | 22.6% |
| Middle School | 434 | 20.0% |
| High School | 640 | 29.5% |
| College / Undergraduate | 480 | 22.1% |
| Graduate / Professional | 85 | 3.9% |
| Total | 2,169 | 100.0% |
School Enrollment by Age by Funding Source in Punta Gorda
Out of a total of 2,169 students who are enrolled in schools in Punta Gorda, 252 (11.6%) attend a private institution, while the remaining 1,917 (88.4%) are enrolled in public schools. The age group of 35 years and over has the highest likelihood of being enrolled in private schools, with 38 (22.9% in the age bracket) enrolled. Conversely, the age group of 3 to 4 year olds has the lowest likelihood of being enrolled in a private school, with 23 (100.0% in the age bracket) attending a public institution.
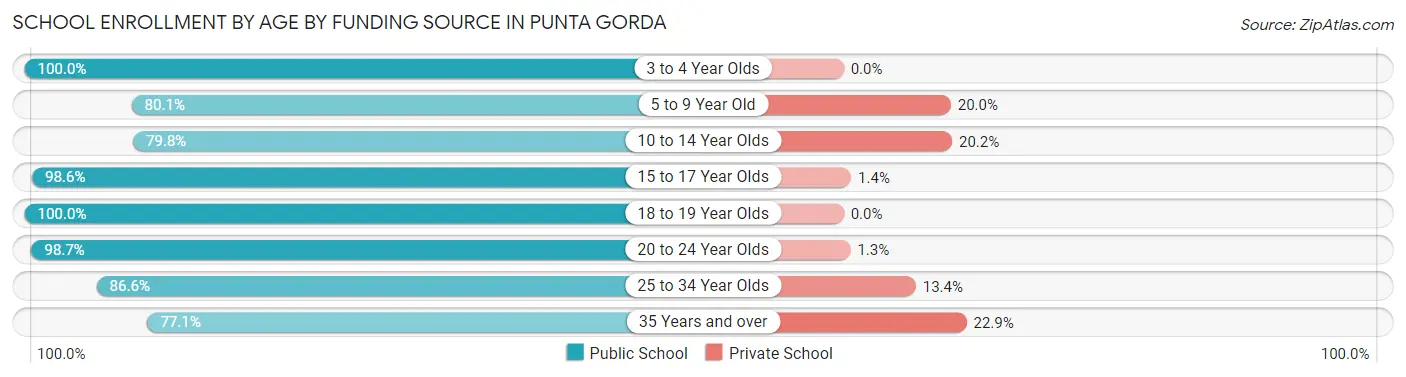
| Age Bracket | Public School | Private School |
| 3 to 4 Year Olds | 23 (100.0%) | 0 (0.0%) |
| 5 to 9 Year Old | 353 (80.0%) | 88 (20.0%) |
| 10 to 14 Year Olds | 423 (79.8%) | 107 (20.2%) |
| 15 to 17 Year Olds | 427 (98.6%) | 6 (1.4%) |
| 18 to 19 Year Olds | 195 (100.0%) | 0 (0.0%) |
| 20 to 24 Year Olds | 310 (98.7%) | 4 (1.3%) |
| 25 to 34 Year Olds | 58 (86.6%) | 9 (13.4%) |
| 35 Years and over | 128 (77.1%) | 38 (22.9%) |
| Total | 1,917 (88.4%) | 252 (11.6%) |
Educational Attainment by Field of Study in Punta Gorda
Business (1,809 | 25.7%), education (1,178 | 16.7%), engineering (800 | 11.4%), science & technology (665 | 9.4%), and arts & humanities (488 | 6.9%) are the most common fields of study among 7,041 individuals in Punta Gorda who have obtained a bachelor's degree or higher.
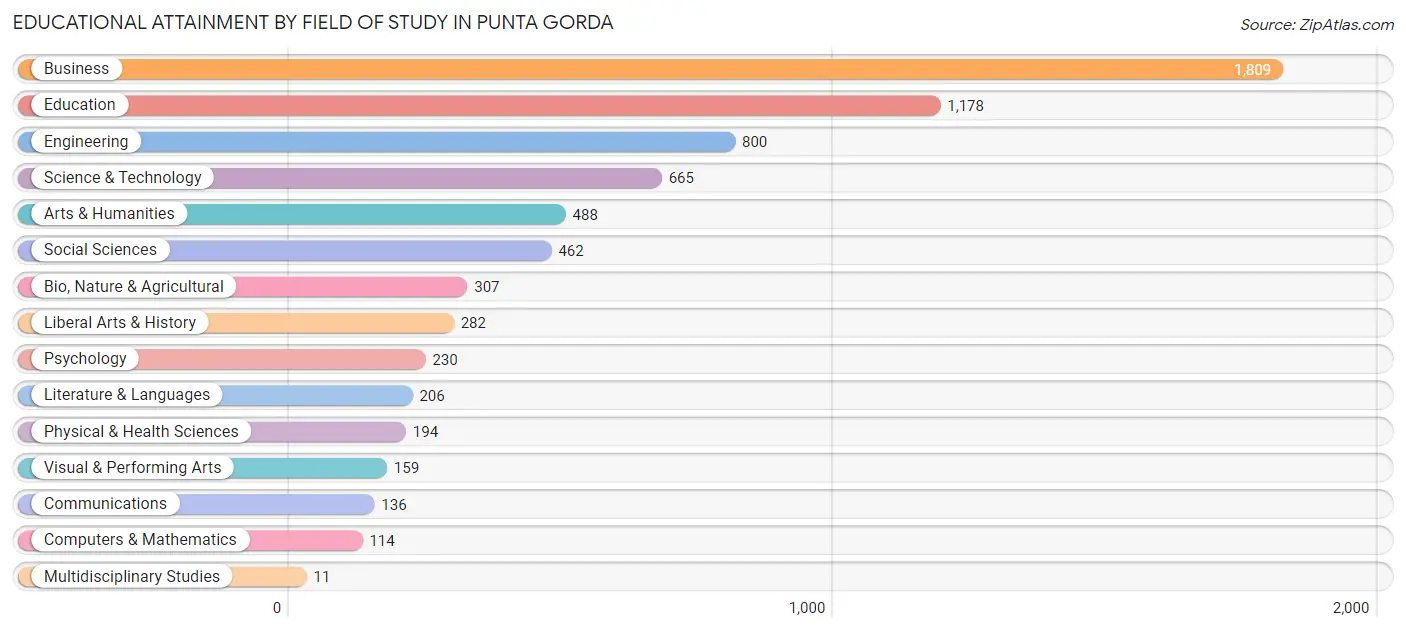
| Field of Study | # Graduates | % Graduates |
| Computers & Mathematics | 114 | 1.6% |
| Bio, Nature & Agricultural | 307 | 4.4% |
| Physical & Health Sciences | 194 | 2.8% |
| Psychology | 230 | 3.3% |
| Social Sciences | 462 | 6.6% |
| Engineering | 800 | 11.4% |
| Multidisciplinary Studies | 11 | 0.2% |
| Science & Technology | 665 | 9.4% |
| Business | 1,809 | 25.7% |
| Education | 1,178 | 16.7% |
| Literature & Languages | 206 | 2.9% |
| Liberal Arts & History | 282 | 4.0% |
| Visual & Performing Arts | 159 | 2.3% |
| Communications | 136 | 1.9% |
| Arts & Humanities | 488 | 6.9% |
| Total | 7,041 | 100.0% |
Transportation & Commute in Punta Gorda
Vehicle Availability by Sex in Punta Gorda
The most prevalent vehicle ownership categories in Punta Gorda are males with 2 vehicles (1,206, accounting for 41.9%) and females with 2 vehicles (980, making up 49.2%).
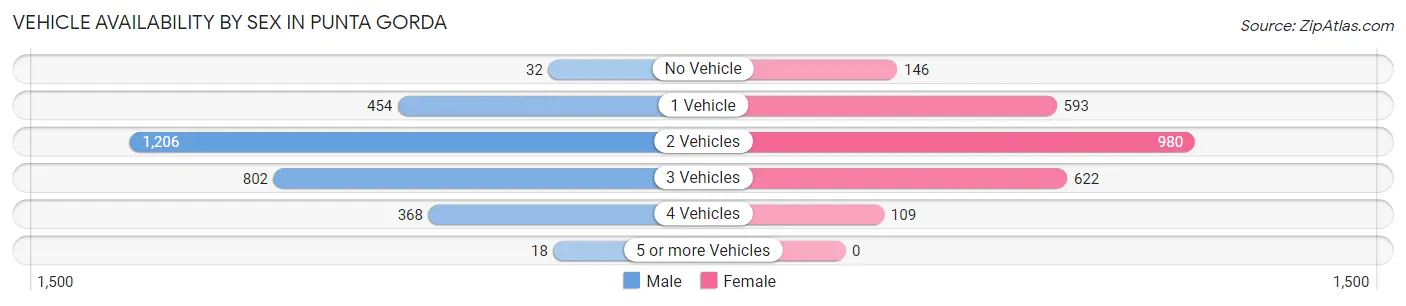
| Vehicles Available | Male | Female |
| No Vehicle | 32 (1.1%) | 146 (6.0%) |
| 1 Vehicle | 454 (15.8%) | 593 (24.2%) |
| 2 Vehicles | 1,206 (41.9%) | 980 (40.0%) |
| 3 Vehicles | 802 (27.9%) | 622 (25.4%) |
| 4 Vehicles | 368 (12.8%) | 109 (4.4%) |
| 5 or more Vehicles | 18 (0.6%) | 0 (0.0%) |
| Total | 2,880 (100.0%) | 2,450 (100.0%) |
Commute Time in Punta Gorda
The most frequently occuring commute durations in Punta Gorda are 10 to 14 minutes (1,071 commuters, 23.4%), 15 to 19 minutes (654 commuters, 14.3%), and 5 to 9 minutes (569 commuters, 12.4%).
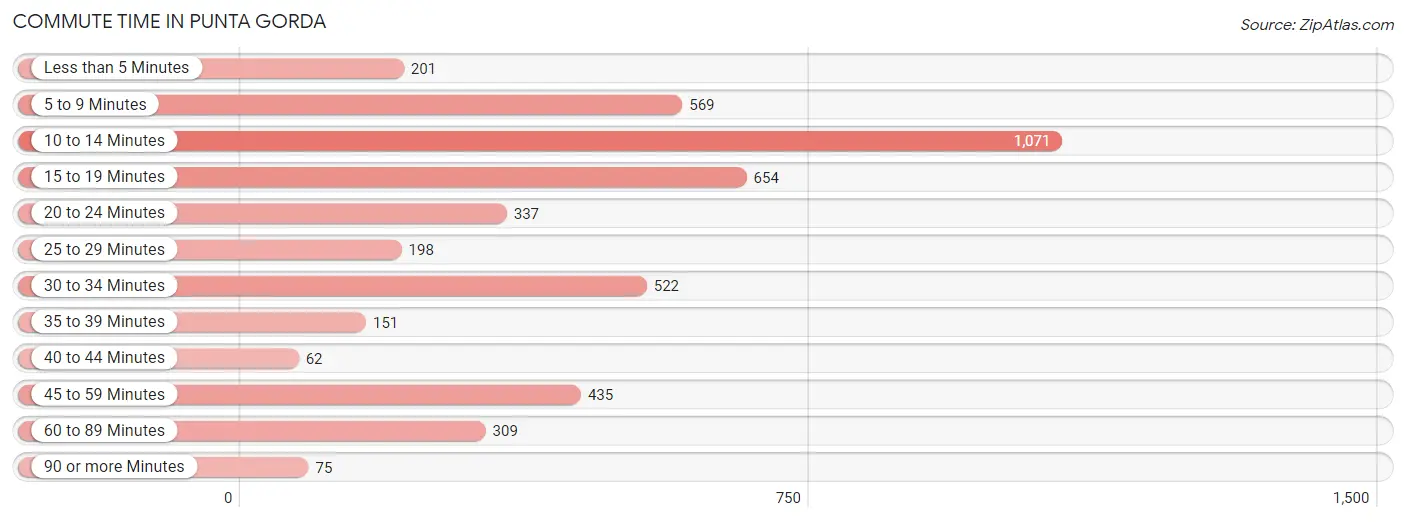
| Commute Time | # Commuters | % Commuters |
| Less than 5 Minutes | 201 | 4.4% |
| 5 to 9 Minutes | 569 | 12.4% |
| 10 to 14 Minutes | 1,071 | 23.4% |
| 15 to 19 Minutes | 654 | 14.3% |
| 20 to 24 Minutes | 337 | 7.3% |
| 25 to 29 Minutes | 198 | 4.3% |
| 30 to 34 Minutes | 522 | 11.4% |
| 35 to 39 Minutes | 151 | 3.3% |
| 40 to 44 Minutes | 62 | 1.3% |
| 45 to 59 Minutes | 435 | 9.5% |
| 60 to 89 Minutes | 309 | 6.7% |
| 90 or more Minutes | 75 | 1.6% |
Commute Time by Sex in Punta Gorda
The most common commute times in Punta Gorda are 10 to 14 minutes (709 commuters, 29.5%) for males and 30 to 34 minutes (454 commuters, 20.8%) for females.
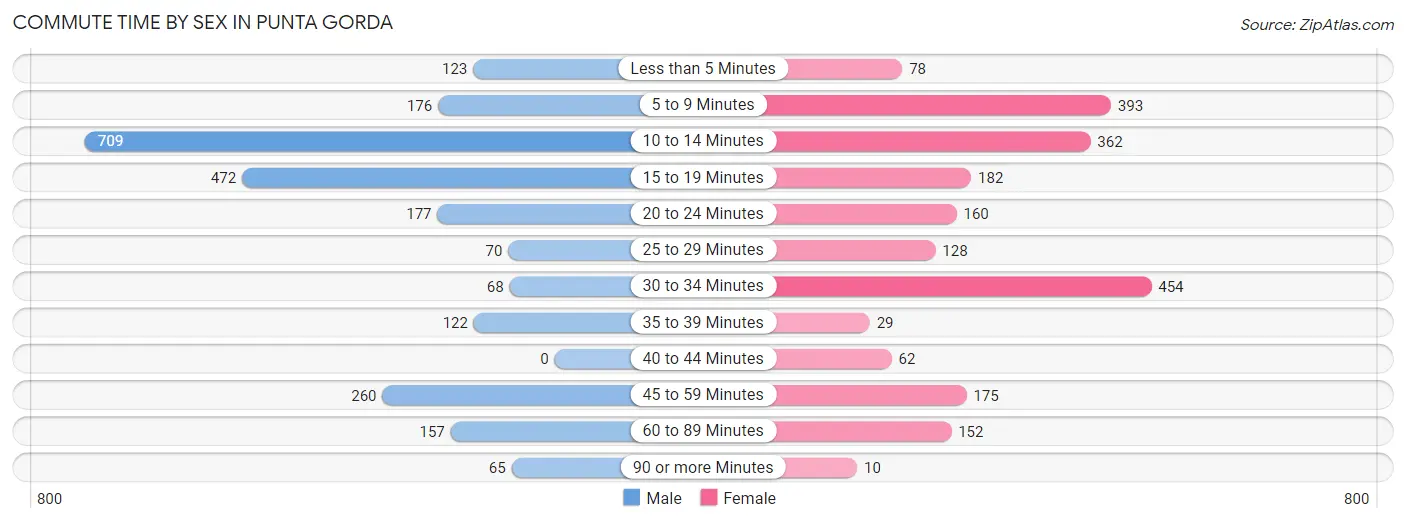
| Commute Time | Male | Female |
| Less than 5 Minutes | 123 (5.1%) | 78 (3.6%) |
| 5 to 9 Minutes | 176 (7.3%) | 393 (18.0%) |
| 10 to 14 Minutes | 709 (29.5%) | 362 (16.6%) |
| 15 to 19 Minutes | 472 (19.7%) | 182 (8.3%) |
| 20 to 24 Minutes | 177 (7.4%) | 160 (7.3%) |
| 25 to 29 Minutes | 70 (2.9%) | 128 (5.9%) |
| 30 to 34 Minutes | 68 (2.8%) | 454 (20.8%) |
| 35 to 39 Minutes | 122 (5.1%) | 29 (1.3%) |
| 40 to 44 Minutes | 0 (0.0%) | 62 (2.8%) |
| 45 to 59 Minutes | 260 (10.8%) | 175 (8.0%) |
| 60 to 89 Minutes | 157 (6.5%) | 152 (7.0%) |
| 90 or more Minutes | 65 (2.7%) | 10 (0.5%) |
Time of Departure to Work by Sex in Punta Gorda
The most frequent times of departure to work in Punta Gorda are 8:00 AM to 8:29 AM (531, 22.1%) for males and 7:00 AM to 7:29 AM (374, 17.1%) for females.
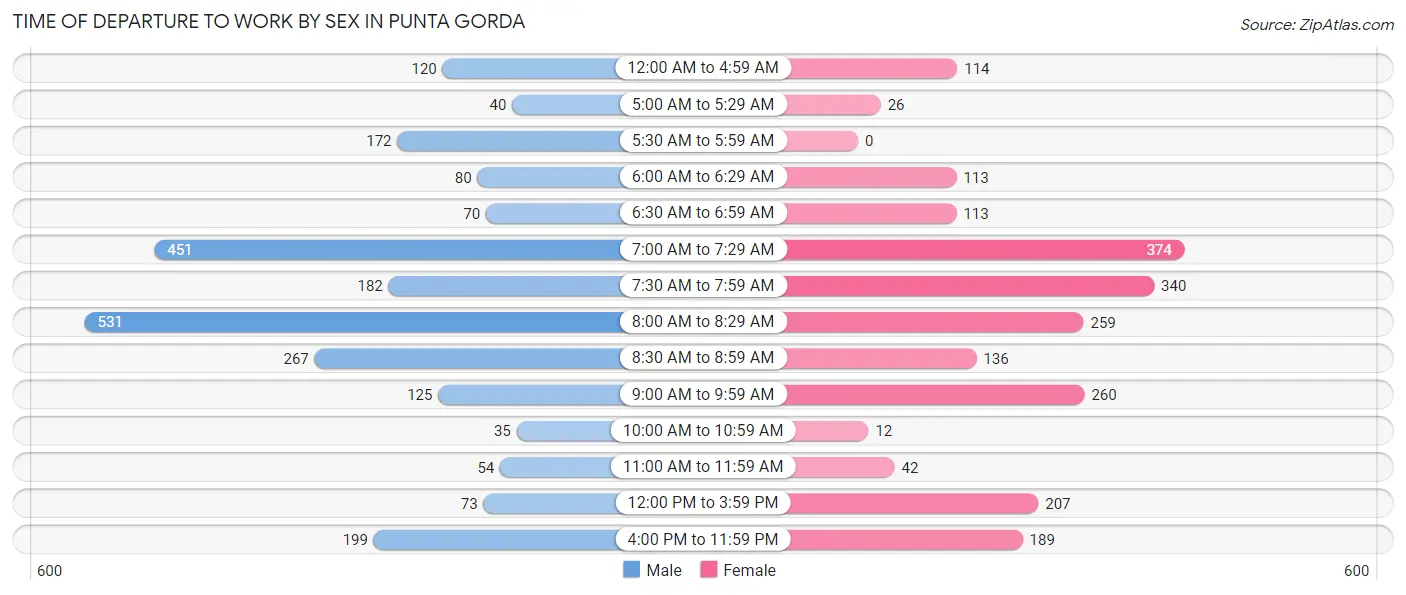
| Time of Departure | Male | Female |
| 12:00 AM to 4:59 AM | 120 (5.0%) | 114 (5.2%) |
| 5:00 AM to 5:29 AM | 40 (1.7%) | 26 (1.2%) |
| 5:30 AM to 5:59 AM | 172 (7.2%) | 0 (0.0%) |
| 6:00 AM to 6:29 AM | 80 (3.3%) | 113 (5.2%) |
| 6:30 AM to 6:59 AM | 70 (2.9%) | 113 (5.2%) |
| 7:00 AM to 7:29 AM | 451 (18.8%) | 374 (17.1%) |
| 7:30 AM to 7:59 AM | 182 (7.6%) | 340 (15.6%) |
| 8:00 AM to 8:29 AM | 531 (22.1%) | 259 (11.8%) |
| 8:30 AM to 8:59 AM | 267 (11.1%) | 136 (6.2%) |
| 9:00 AM to 9:59 AM | 125 (5.2%) | 260 (11.9%) |
| 10:00 AM to 10:59 AM | 35 (1.5%) | 12 (0.5%) |
| 11:00 AM to 11:59 AM | 54 (2.2%) | 42 (1.9%) |
| 12:00 PM to 3:59 PM | 73 (3.0%) | 207 (9.5%) |
| 4:00 PM to 11:59 PM | 199 (8.3%) | 189 (8.6%) |
| Total | 2,399 (100.0%) | 2,185 (100.0%) |
Housing Occupancy in Punta Gorda
Occupancy by Ownership in Punta Gorda
Of the total 9,827 dwellings in Punta Gorda, owner-occupied units account for 8,098 (82.4%), while renter-occupied units make up 1,729 (17.6%).
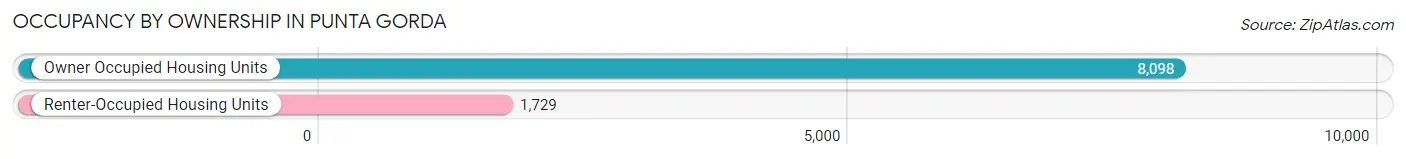
| Occupancy | # Housing Units | % Housing Units |
| Owner Occupied Housing Units | 8,098 | 82.4% |
| Renter-Occupied Housing Units | 1,729 | 17.6% |
| Total Occupied Housing Units | 9,827 | 100.0% |
Occupancy by Household Size in Punta Gorda
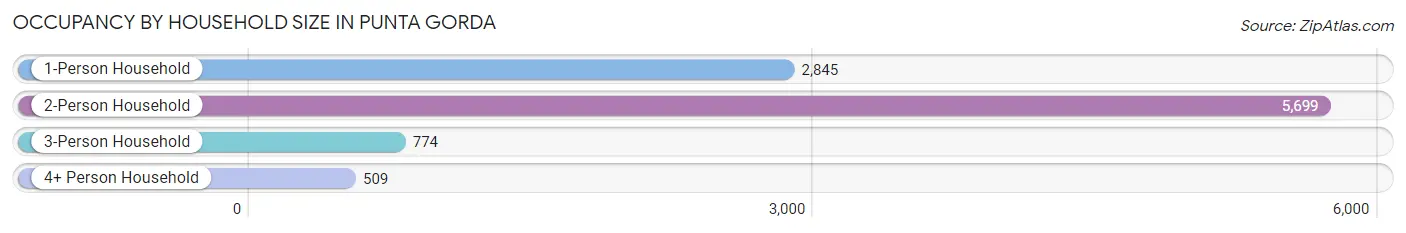
| Household Size | # Housing Units | % Housing Units |
| 1-Person Household | 2,845 | 28.9% |
| 2-Person Household | 5,699 | 58.0% |
| 3-Person Household | 774 | 7.9% |
| 4+ Person Household | 509 | 5.2% |
| Total Housing Units | 9,827 | 100.0% |
Occupancy by Ownership by Household Size in Punta Gorda
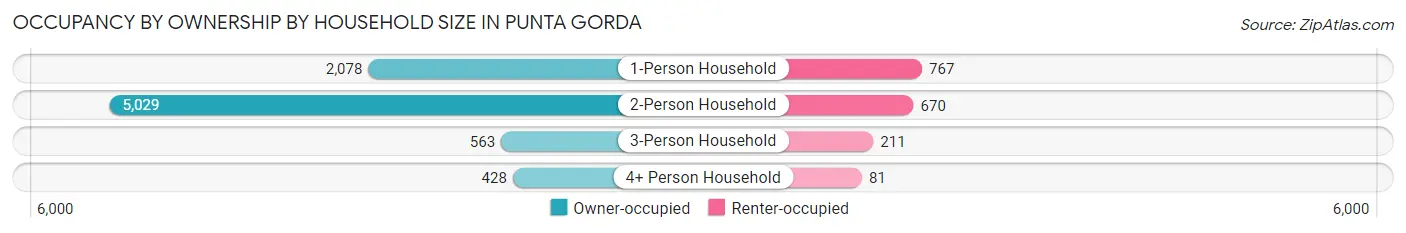
| Household Size | Owner-occupied | Renter-occupied |
| 1-Person Household | 2,078 (73.0%) | 767 (27.0%) |
| 2-Person Household | 5,029 (88.2%) | 670 (11.8%) |
| 3-Person Household | 563 (72.7%) | 211 (27.3%) |
| 4+ Person Household | 428 (84.1%) | 81 (15.9%) |
| Total Housing Units | 8,098 (82.4%) | 1,729 (17.6%) |
Occupancy by Educational Attainment in Punta Gorda
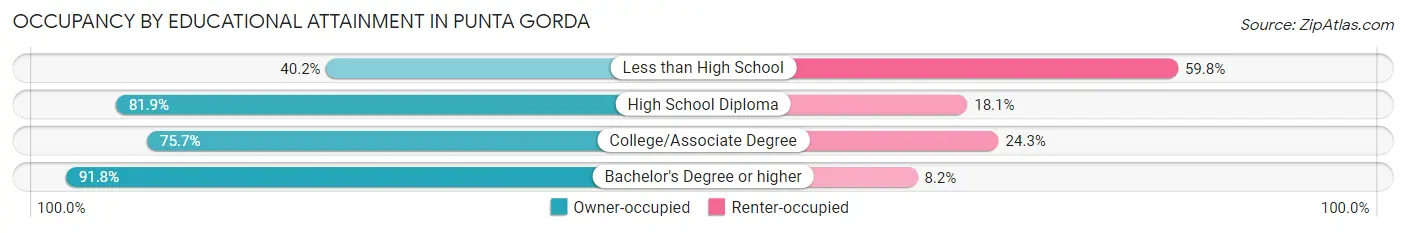
| Household Size | Owner-occupied | Renter-occupied |
| Less than High School | 151 (40.2%) | 225 (59.8%) |
| High School Diploma | 1,641 (81.9%) | 362 (18.1%) |
| College/Associate Degree | 2,504 (75.7%) | 803 (24.3%) |
| Bachelor's Degree or higher | 3,802 (91.8%) | 339 (8.2%) |
Occupancy by Age of Householder in Punta Gorda
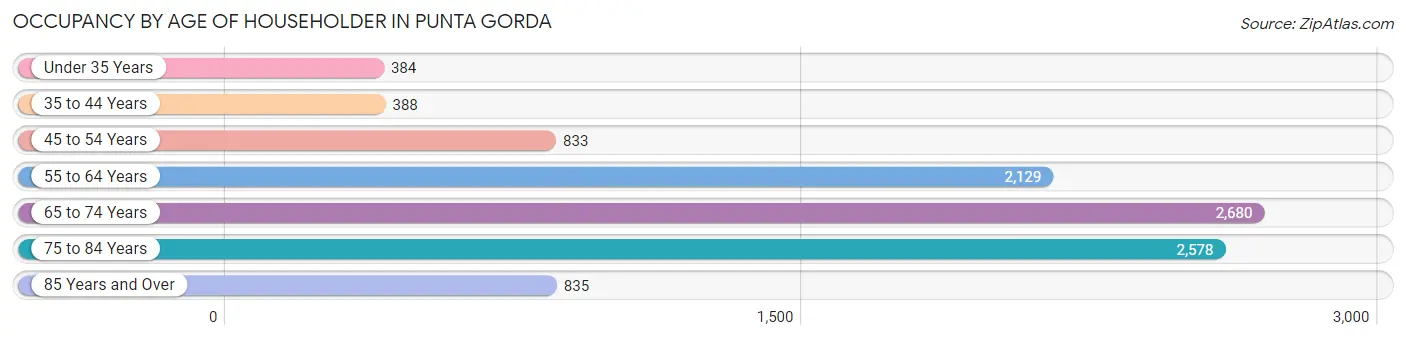
| Age Bracket | # Households | % Households |
| Under 35 Years | 384 | 3.9% |
| 35 to 44 Years | 388 | 4.0% |
| 45 to 54 Years | 833 | 8.5% |
| 55 to 64 Years | 2,129 | 21.7% |
| 65 to 74 Years | 2,680 | 27.3% |
| 75 to 84 Years | 2,578 | 26.2% |
| 85 Years and Over | 835 | 8.5% |
| Total | 9,827 | 100.0% |
Housing Finances in Punta Gorda
Median Income by Occupancy in Punta Gorda
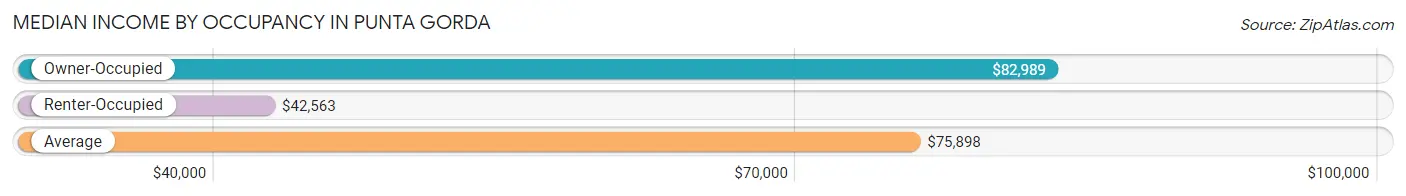
| Occupancy Type | # Households | Median Income |
| Owner-Occupied | 8,098 (82.4%) | $82,989 |
| Renter-Occupied | 1,729 (17.6%) | $42,563 |
| Average | 9,827 (100.0%) | $75,898 |
Occupancy by Householder Income Bracket in Punta Gorda
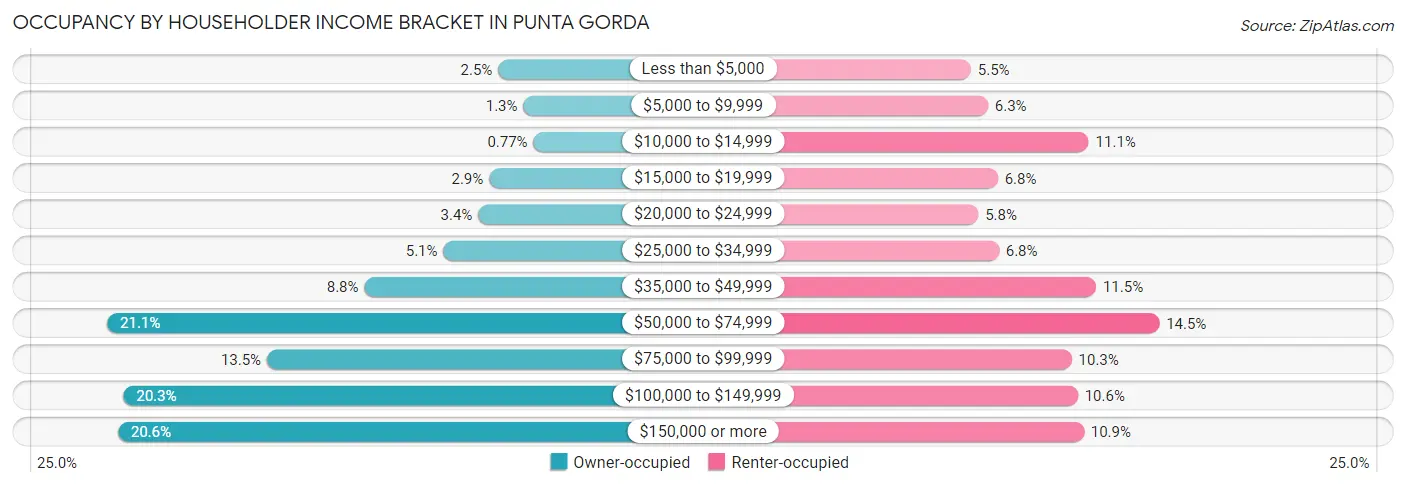
| Income Bracket | Owner-occupied | Renter-occupied |
| Less than $5,000 | 198 (2.5%) | 95 (5.5%) |
| $5,000 to $9,999 | 101 (1.3%) | 109 (6.3%) |
| $10,000 to $14,999 | 62 (0.8%) | 192 (11.1%) |
| $15,000 to $19,999 | 233 (2.9%) | 117 (6.8%) |
| $20,000 to $24,999 | 275 (3.4%) | 101 (5.8%) |
| $25,000 to $34,999 | 410 (5.1%) | 118 (6.8%) |
| $35,000 to $49,999 | 714 (8.8%) | 198 (11.5%) |
| $50,000 to $74,999 | 1,706 (21.1%) | 250 (14.5%) |
| $75,000 to $99,999 | 1,090 (13.5%) | 178 (10.3%) |
| $100,000 to $149,999 | 1,644 (20.3%) | 183 (10.6%) |
| $150,000 or more | 1,665 (20.6%) | 188 (10.9%) |
| Total | 8,098 (100.0%) | 1,729 (100.0%) |
Monthly Housing Cost Tiers in Punta Gorda
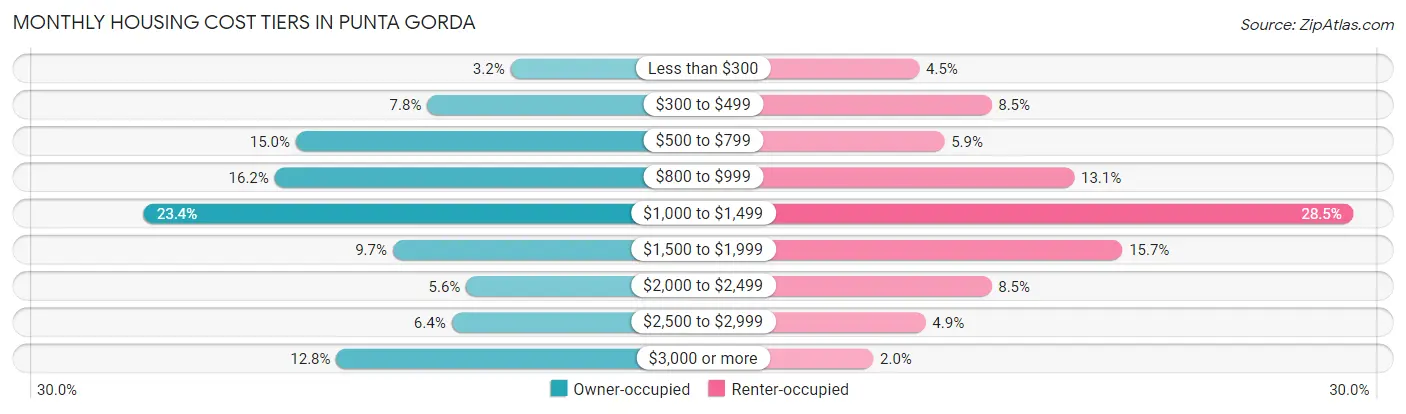
| Monthly Cost | Owner-occupied | Renter-occupied |
| Less than $300 | 256 (3.2%) | 78 (4.5%) |
| $300 to $499 | 628 (7.8%) | 147 (8.5%) |
| $500 to $799 | 1,216 (15.0%) | 102 (5.9%) |
| $800 to $999 | 1,311 (16.2%) | 226 (13.1%) |
| $1,000 to $1,499 | 1,896 (23.4%) | 493 (28.5%) |
| $1,500 to $1,999 | 782 (9.7%) | 272 (15.7%) |
| $2,000 to $2,499 | 454 (5.6%) | 147 (8.5%) |
| $2,500 to $2,999 | 520 (6.4%) | 84 (4.9%) |
| $3,000 or more | 1,035 (12.8%) | 34 (2.0%) |
| Total | 8,098 (100.0%) | 1,729 (100.0%) |
Physical Housing Characteristics in Punta Gorda
Housing Structures in Punta Gorda
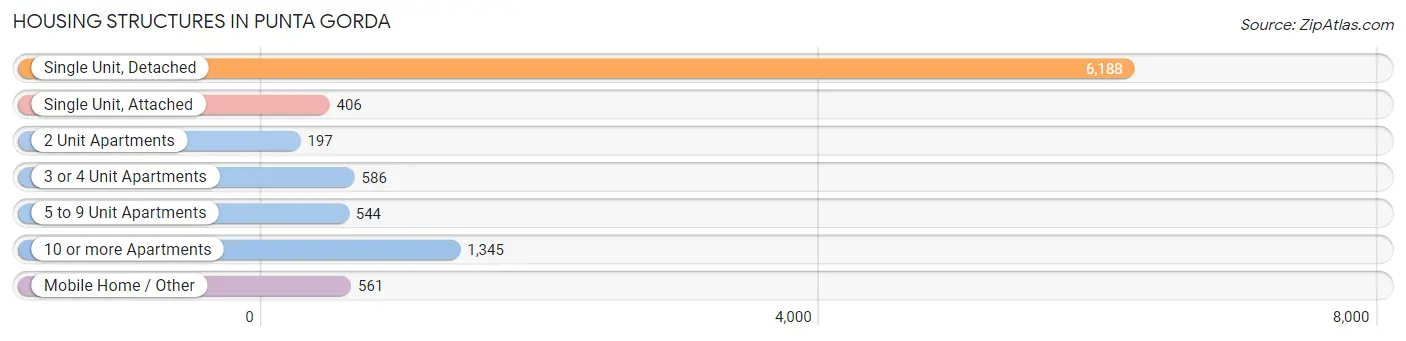
| Structure Type | # Housing Units | % Housing Units |
| Single Unit, Detached | 6,188 | 63.0% |
| Single Unit, Attached | 406 | 4.1% |
| 2 Unit Apartments | 197 | 2.0% |
| 3 or 4 Unit Apartments | 586 | 6.0% |
| 5 to 9 Unit Apartments | 544 | 5.5% |
| 10 or more Apartments | 1,345 | 13.7% |
| Mobile Home / Other | 561 | 5.7% |
| Total | 9,827 | 100.0% |
Housing Structures by Occupancy in Punta Gorda
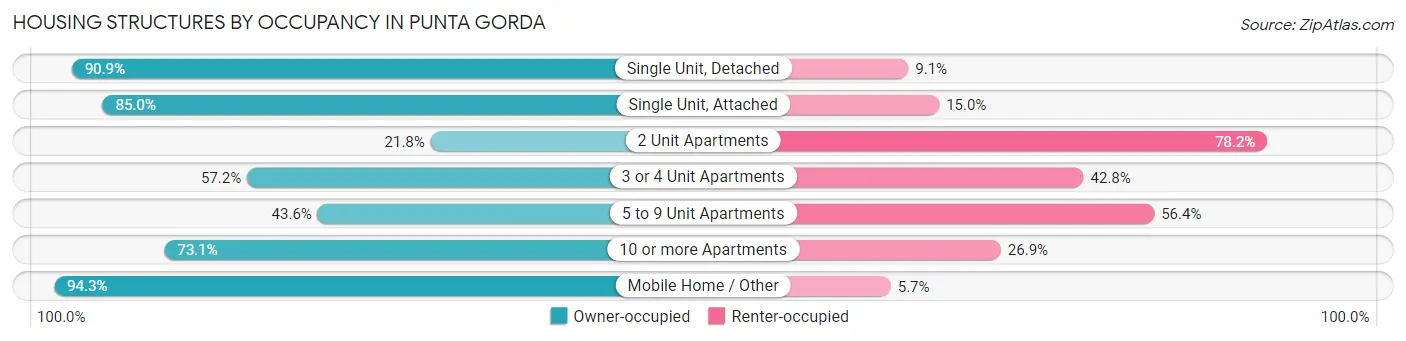
| Structure Type | Owner-occupied | Renter-occupied |
| Single Unit, Detached | 5,626 (90.9%) | 562 (9.1%) |
| Single Unit, Attached | 345 (85.0%) | 61 (15.0%) |
| 2 Unit Apartments | 43 (21.8%) | 154 (78.2%) |
| 3 or 4 Unit Apartments | 335 (57.2%) | 251 (42.8%) |
| 5 to 9 Unit Apartments | 237 (43.6%) | 307 (56.4%) |
| 10 or more Apartments | 983 (73.1%) | 362 (26.9%) |
| Mobile Home / Other | 529 (94.3%) | 32 (5.7%) |
| Total | 8,098 (82.4%) | 1,729 (17.6%) |
Housing Structures by Number of Rooms in Punta Gorda
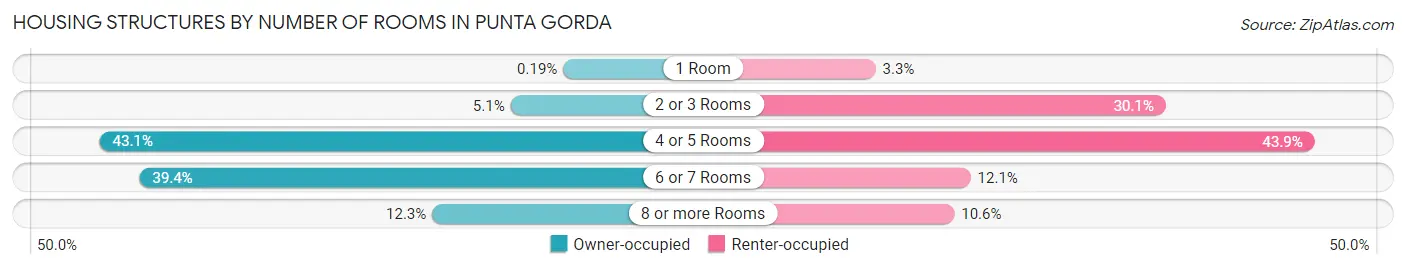
| Number of Rooms | Owner-occupied | Renter-occupied |
| 1 Room | 15 (0.2%) | 57 (3.3%) |
| 2 or 3 Rooms | 410 (5.1%) | 521 (30.1%) |
| 4 or 5 Rooms | 3,487 (43.1%) | 759 (43.9%) |
| 6 or 7 Rooms | 3,189 (39.4%) | 209 (12.1%) |
| 8 or more Rooms | 997 (12.3%) | 183 (10.6%) |
| Total | 8,098 (100.0%) | 1,729 (100.0%) |
Housing Structure by Heating Type in Punta Gorda
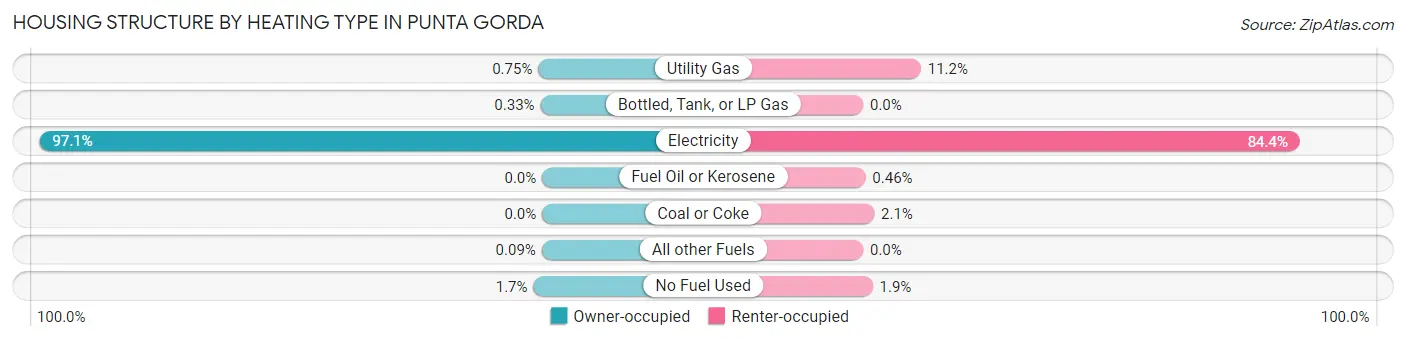
| Heating Type | Owner-occupied | Renter-occupied |
| Utility Gas | 61 (0.7%) | 193 (11.2%) |
| Bottled, Tank, or LP Gas | 27 (0.3%) | 0 (0.0%) |
| Electricity | 7,866 (97.1%) | 1,459 (84.4%) |
| Fuel Oil or Kerosene | 0 (0.0%) | 8 (0.5%) |
| Coal or Coke | 0 (0.0%) | 37 (2.1%) |
| All other Fuels | 7 (0.1%) | 0 (0.0%) |
| No Fuel Used | 137 (1.7%) | 32 (1.8%) |
| Total | 8,098 (100.0%) | 1,729 (100.0%) |
Household Vehicle Usage in Punta Gorda
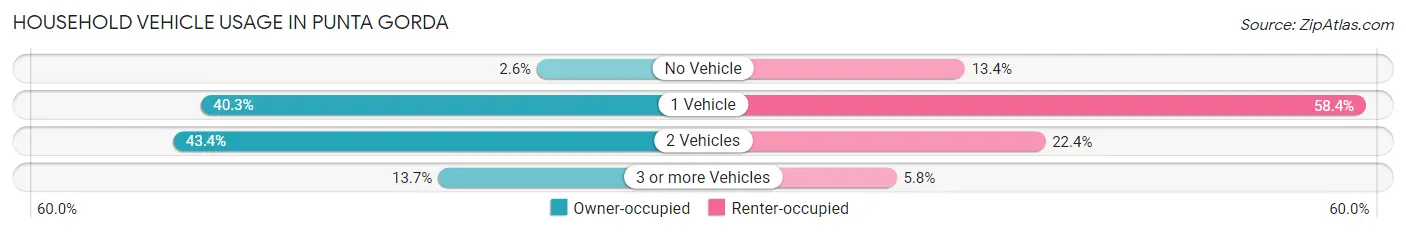
| Vehicles per Household | Owner-occupied | Renter-occupied |
| No Vehicle | 211 (2.6%) | 232 (13.4%) |
| 1 Vehicle | 3,264 (40.3%) | 1,009 (58.4%) |
| 2 Vehicles | 3,514 (43.4%) | 388 (22.4%) |
| 3 or more Vehicles | 1,109 (13.7%) | 100 (5.8%) |
| Total | 8,098 (100.0%) | 1,729 (100.0%) |
Real Estate & Mortgages in Punta Gorda
Real Estate and Mortgage Overview in Punta Gorda
| Characteristic | Without Mortgage | With Mortgage |
| Housing Units | 5,221 | 2,877 |
| Median Property Value | $422,400 | $473,600 |
| Median Household Income | $69,531 | $949 |
| Monthly Housing Costs | $877 | $1,011 |
| Real Estate Taxes | $4,031 | $55 |
Property Value by Mortgage Status in Punta Gorda
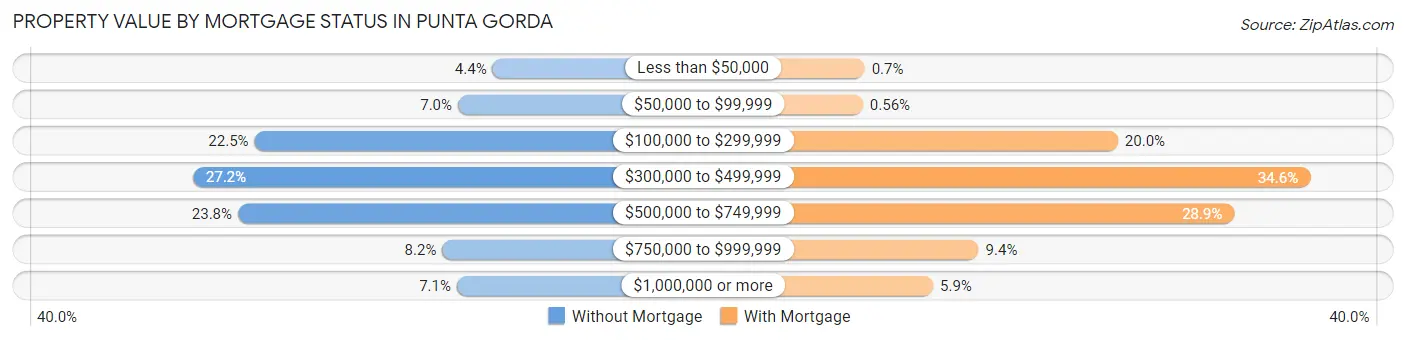
| Property Value | Without Mortgage | With Mortgage |
| Less than $50,000 | 227 (4.3%) | 20 (0.7%) |
| $50,000 to $99,999 | 365 (7.0%) | 16 (0.6%) |
| $100,000 to $299,999 | 1,174 (22.5%) | 575 (20.0%) |
| $300,000 to $499,999 | 1,419 (27.2%) | 996 (34.6%) |
| $500,000 to $749,999 | 1,240 (23.7%) | 830 (28.8%) |
| $750,000 to $999,999 | 427 (8.2%) | 270 (9.4%) |
| $1,000,000 or more | 369 (7.1%) | 170 (5.9%) |
| Total | 5,221 (100.0%) | 2,877 (100.0%) |
Household Income by Mortgage Status in Punta Gorda
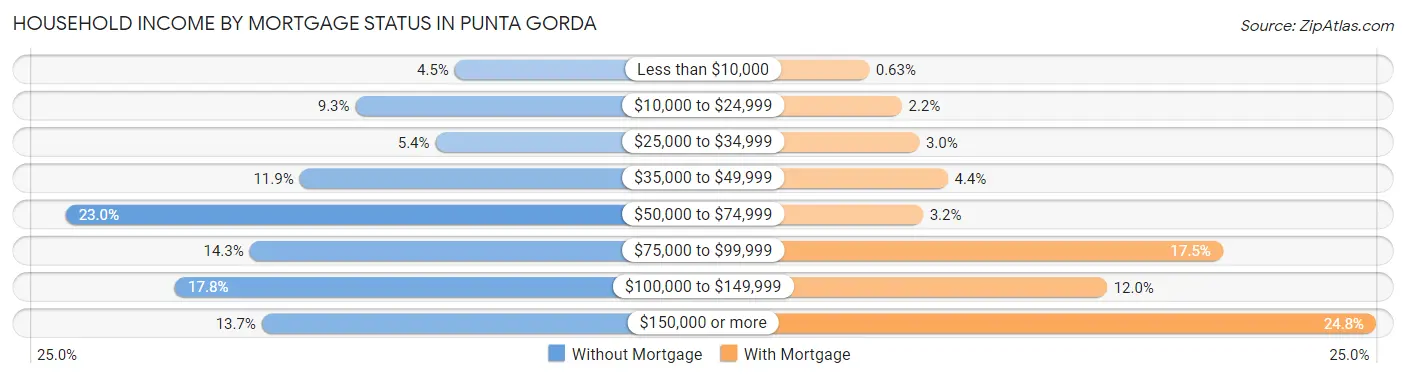
| Household Income | Without Mortgage | With Mortgage |
| Less than $10,000 | 236 (4.5%) | 18 (0.6%) |
| $10,000 to $24,999 | 483 (9.2%) | 63 (2.2%) |
| $25,000 to $34,999 | 284 (5.4%) | 87 (3.0%) |
| $35,000 to $49,999 | 622 (11.9%) | 126 (4.4%) |
| $50,000 to $74,999 | 1,203 (23.0%) | 92 (3.2%) |
| $75,000 to $99,999 | 746 (14.3%) | 503 (17.5%) |
| $100,000 to $149,999 | 931 (17.8%) | 344 (12.0%) |
| $150,000 or more | 716 (13.7%) | 713 (24.8%) |
| Total | 5,221 (100.0%) | 2,877 (100.0%) |
Property Value to Household Income Ratio in Punta Gorda
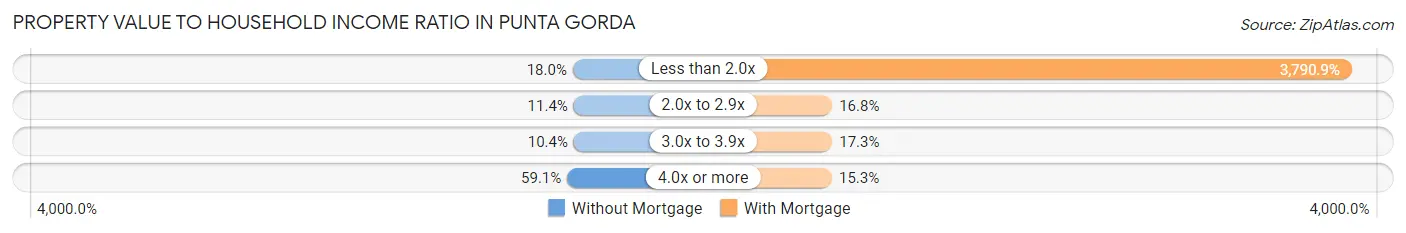
| Value-to-Income Ratio | Without Mortgage | With Mortgage |
| Less than 2.0x | 938 (18.0%) | 109,063 (3,790.9%) |
| 2.0x to 2.9x | 594 (11.4%) | 482 (16.8%) |
| 3.0x to 3.9x | 541 (10.4%) | 497 (17.3%) |
| 4.0x or more | 3,085 (59.1%) | 439 (15.3%) |
| Total | 5,221 (100.0%) | 2,877 (100.0%) |
Real Estate Taxes by Mortgage Status in Punta Gorda

| Property Taxes | Without Mortgage | With Mortgage |
| Less than $800 | 287 (5.5%) | 63 (2.2%) |
| $800 to $1,499 | 645 (12.3%) | 26 (0.9%) |
| $800 to $1,499 | 3,848 (73.7%) | 90 (3.1%) |
| Total | 5,221 (100.0%) | 2,877 (100.0%) |
Health & Disability in Punta Gorda
Health Insurance Coverage by Age in Punta Gorda
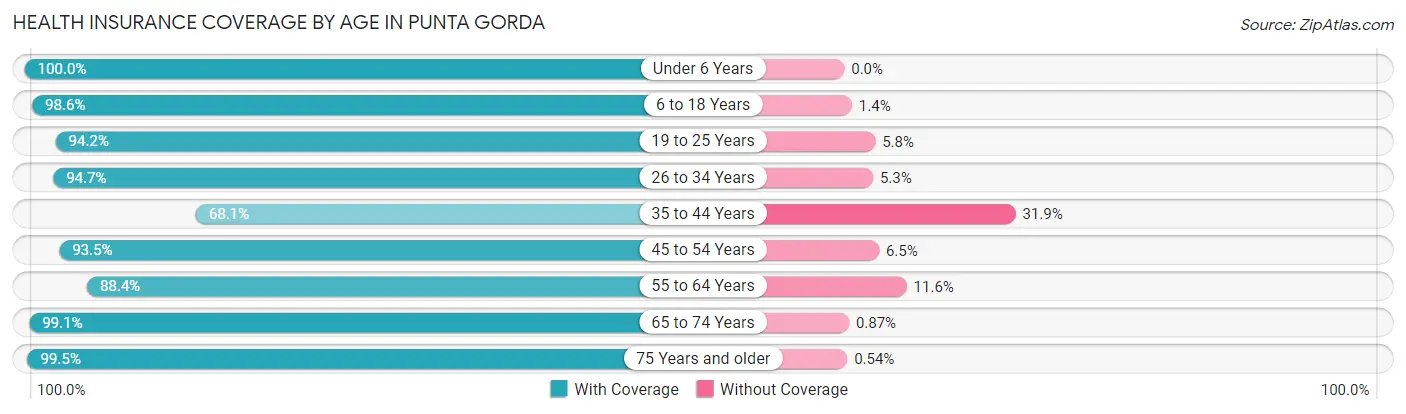
| Age Bracket | With Coverage | Without Coverage |
| Under 6 Years | 436 (100.0%) | 0 (0.0%) |
| 6 to 18 Years | 1,600 (98.6%) | 23 (1.4%) |
| 19 to 25 Years | 653 (94.2%) | 40 (5.8%) |
| 26 to 34 Years | 496 (94.7%) | 28 (5.3%) |
| 35 to 44 Years | 571 (68.1%) | 268 (31.9%) |
| 45 to 54 Years | 1,550 (93.5%) | 107 (6.5%) |
| 55 to 64 Years | 3,123 (88.4%) | 411 (11.6%) |
| 65 to 74 Years | 4,886 (99.1%) | 43 (0.9%) |
| 75 Years and older | 5,152 (99.5%) | 28 (0.5%) |
| Total | 18,467 (95.1%) | 948 (4.9%) |
Health Insurance Coverage by Citizenship Status in Punta Gorda

| Citizenship Status | With Coverage | Without Coverage |
| Native Born | 436 (100.0%) | 0 (0.0%) |
| Foreign Born, Citizen | 1,600 (98.6%) | 23 (1.4%) |
| Foreign Born, not a Citizen | 653 (94.2%) | 40 (5.8%) |
Health Insurance Coverage by Household Income in Punta Gorda
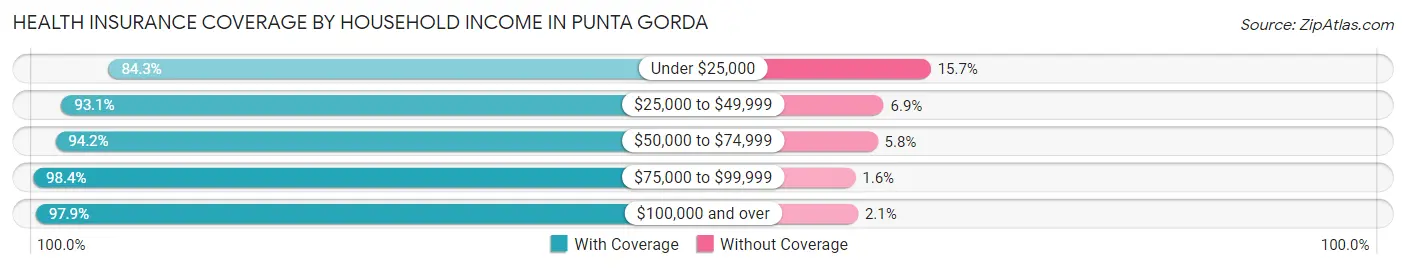
| Household Income | With Coverage | Without Coverage |
| Under $25,000 | 1,887 (84.3%) | 352 (15.7%) |
| $25,000 to $49,999 | 2,053 (93.1%) | 152 (6.9%) |
| $50,000 to $74,999 | 3,658 (94.2%) | 224 (5.8%) |
| $75,000 to $99,999 | 2,569 (98.4%) | 42 (1.6%) |
| $100,000 and over | 8,290 (97.9%) | 178 (2.1%) |
Public vs Private Health Insurance Coverage by Age in Punta Gorda
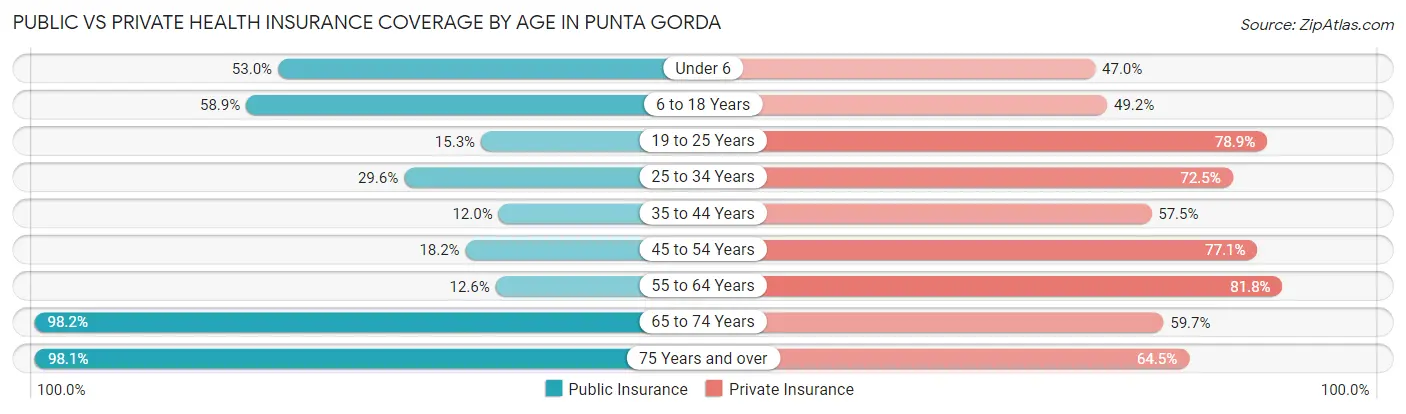
| Age Bracket | Public Insurance | Private Insurance |
| Under 6 | 231 (53.0%) | 205 (47.0%) |
| 6 to 18 Years | 956 (58.9%) | 799 (49.2%) |
| 19 to 25 Years | 106 (15.3%) | 547 (78.9%) |
| 25 to 34 Years | 155 (29.6%) | 380 (72.5%) |
| 35 to 44 Years | 101 (12.0%) | 482 (57.5%) |
| 45 to 54 Years | 301 (18.2%) | 1,278 (77.1%) |
| 55 to 64 Years | 445 (12.6%) | 2,890 (81.8%) |
| 65 to 74 Years | 4,838 (98.2%) | 2,941 (59.7%) |
| 75 Years and over | 5,079 (98.1%) | 3,339 (64.5%) |
| Total | 12,212 (62.9%) | 12,861 (66.2%) |
Disability Status by Sex by Age in Punta Gorda
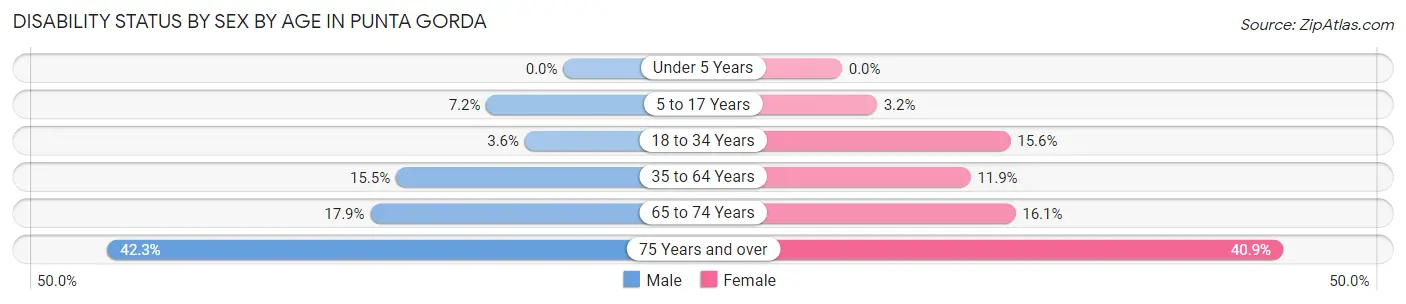
| Age Bracket | Male | Female |
| Under 5 Years | 0 (0.0%) | 0 (0.0%) |
| 5 to 17 Years | 53 (7.1%) | 23 (3.2%) |
| 18 to 34 Years | 29 (3.6%) | 96 (15.6%) |
| 35 to 64 Years | 429 (15.5%) | 390 (11.9%) |
| 65 to 74 Years | 420 (17.9%) | 416 (16.1%) |
| 75 Years and over | 1,150 (42.3%) | 1,008 (40.9%) |
Disability Class by Sex by Age in Punta Gorda
Disability Class: Hearing Difficulty
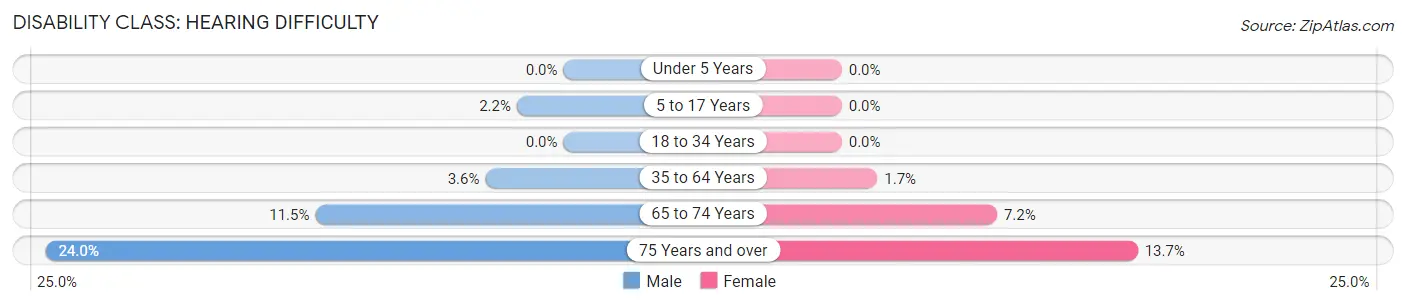
| Age Bracket | Male | Female |
| Under 5 Years | 0 (0.0%) | 0 (0.0%) |
| 5 to 17 Years | 16 (2.2%) | 0 (0.0%) |
| 18 to 34 Years | 0 (0.0%) | 0 (0.0%) |
| 35 to 64 Years | 100 (3.6%) | 54 (1.7%) |
| 65 to 74 Years | 270 (11.5%) | 186 (7.2%) |
| 75 Years and over | 653 (24.0%) | 338 (13.7%) |
Disability Class: Vision Difficulty
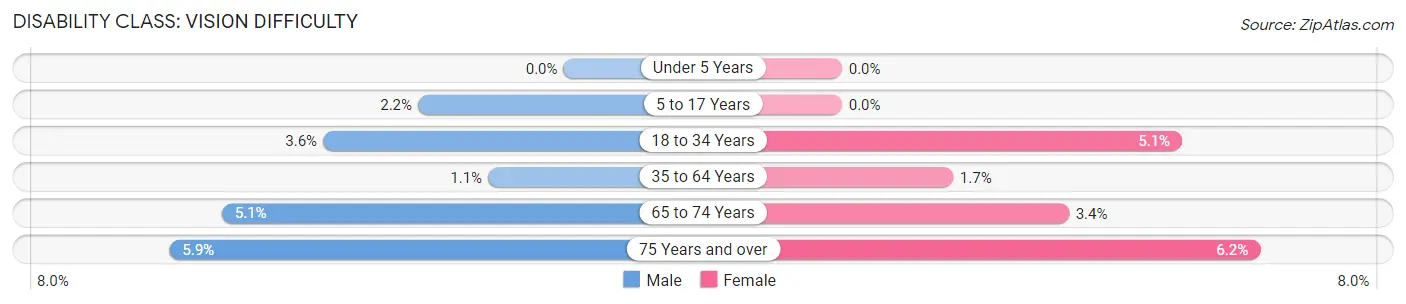
| Age Bracket | Male | Female |
| Under 5 Years | 0 (0.0%) | 0 (0.0%) |
| 5 to 17 Years | 16 (2.2%) | 0 (0.0%) |
| 18 to 34 Years | 29 (3.6%) | 31 (5.1%) |
| 35 to 64 Years | 31 (1.1%) | 54 (1.7%) |
| 65 to 74 Years | 119 (5.1%) | 87 (3.4%) |
| 75 Years and over | 159 (5.9%) | 153 (6.2%) |
Disability Class: Cognitive Difficulty
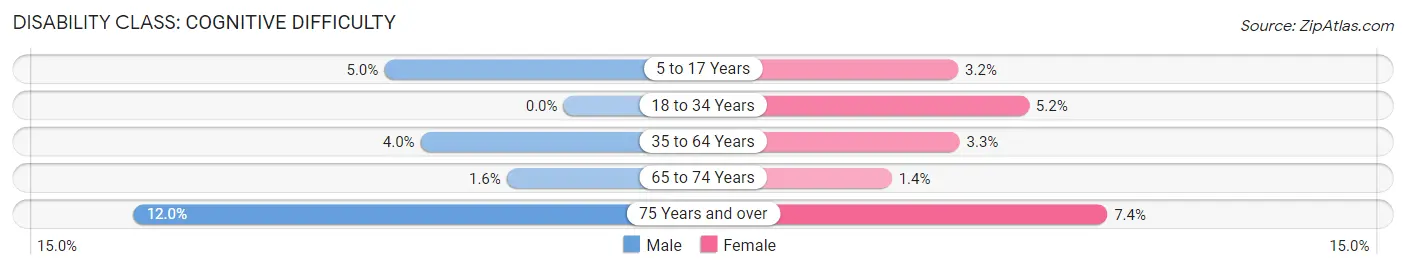
| Age Bracket | Male | Female |
| 5 to 17 Years | 37 (5.0%) | 23 (3.2%) |
| 18 to 34 Years | 0 (0.0%) | 32 (5.2%) |
| 35 to 64 Years | 110 (4.0%) | 107 (3.3%) |
| 65 to 74 Years | 37 (1.6%) | 36 (1.4%) |
| 75 Years and over | 325 (12.0%) | 182 (7.4%) |
Disability Class: Ambulatory Difficulty
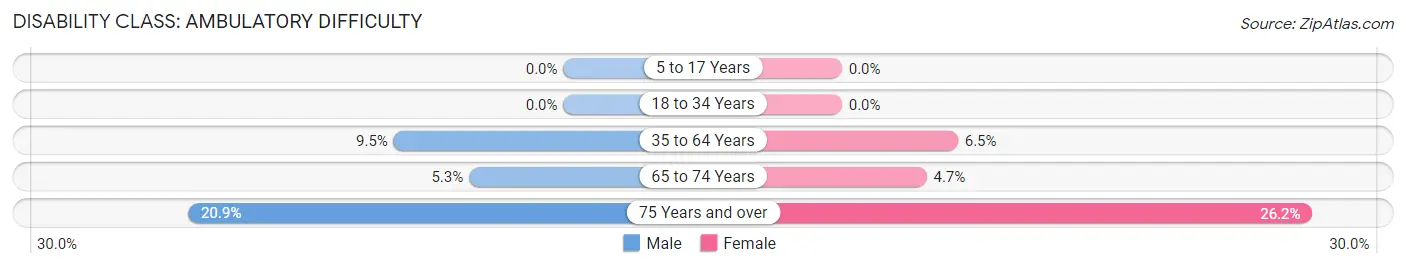
| Age Bracket | Male | Female |
| 5 to 17 Years | 0 (0.0%) | 0 (0.0%) |
| 18 to 34 Years | 0 (0.0%) | 0 (0.0%) |
| 35 to 64 Years | 261 (9.5%) | 211 (6.5%) |
| 65 to 74 Years | 123 (5.2%) | 122 (4.7%) |
| 75 Years and over | 568 (20.9%) | 645 (26.2%) |
Disability Class: Self-Care Difficulty
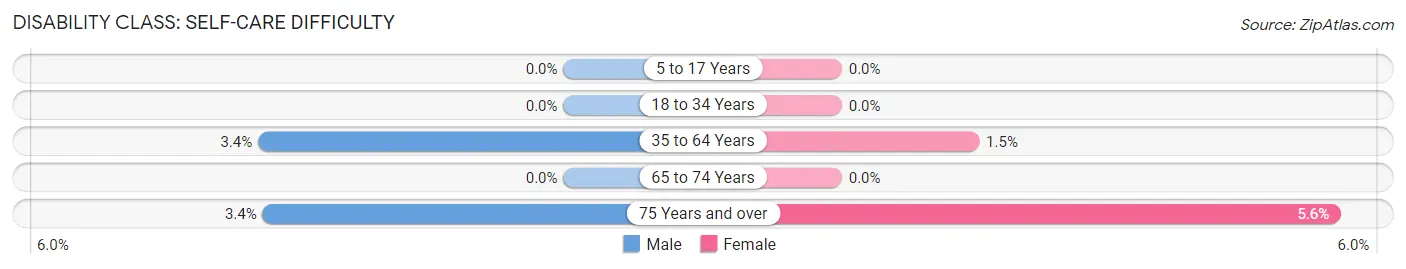
| Age Bracket | Male | Female |
| 5 to 17 Years | 0 (0.0%) | 0 (0.0%) |
| 18 to 34 Years | 0 (0.0%) | 0 (0.0%) |
| 35 to 64 Years | 94 (3.4%) | 50 (1.5%) |
| 65 to 74 Years | 0 (0.0%) | 0 (0.0%) |
| 75 Years and over | 91 (3.4%) | 137 (5.6%) |
Technology Access in Punta Gorda
Computing Device Access in Punta Gorda
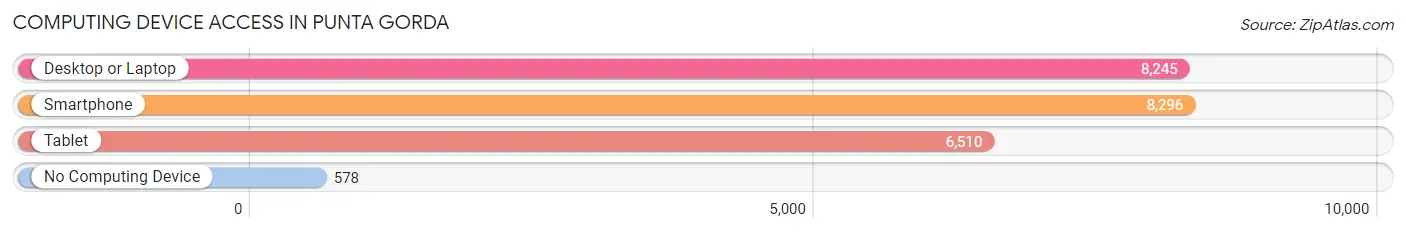
| Device Type | # Households | % Households |
| Desktop or Laptop | 8,245 | 83.9% |
| Smartphone | 8,296 | 84.4% |
| Tablet | 6,510 | 66.2% |
| No Computing Device | 578 | 5.9% |
| Total | 9,827 | 100.0% |
Internet Access in Punta Gorda
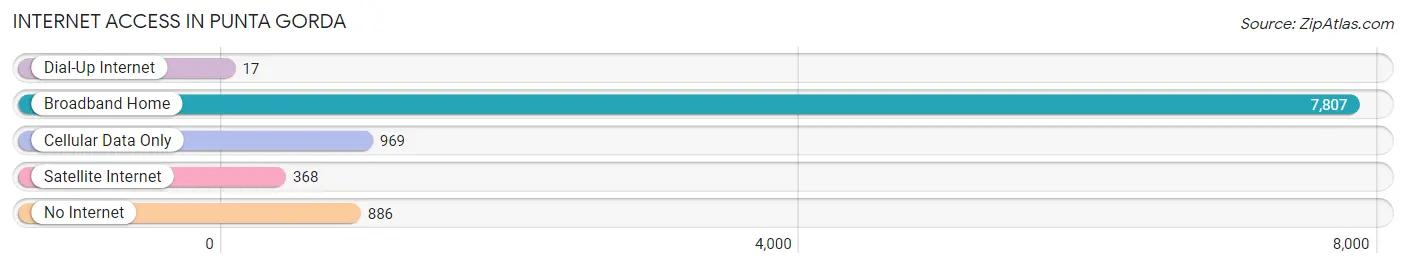
| Internet Type | # Households | % Households |
| Dial-Up Internet | 17 | 0.2% |
| Broadband Home | 7,807 | 79.4% |
| Cellular Data Only | 969 | 9.9% |
| Satellite Internet | 368 | 3.7% |
| No Internet | 886 | 9.0% |
| Total | 9,827 | 100.0% |
Punta Gorda Summary
Punta Gorda is a city located in Charlotte County, Florida, United States. It is the county seat of Charlotte County and is located on the Peace River, near the Gulf of Mexico. The population of Punta Gorda was 16,641 at the 2010 census, making it the 17th largest city in Florida.
History
The area that is now Punta Gorda was first inhabited by the Calusa Indians, who were the first Native Americans to inhabit the area. The Calusa were a powerful tribe that controlled much of the area from Charlotte Harbor to the Everglades. The Calusa were known for their fishing and trading skills, and were also known for their elaborate shell mounds.
The first European to explore the area was Spanish explorer Juan Ponce de Leon, who arrived in 1513. He named the area Punta Gorda, which means “fat point” in Spanish. The area was later explored by the Spanish explorer Hernando de Soto in 1539.
In the late 1800s, the area was settled by pioneers from the United States. The first settlers were William and Mary Goff, who arrived in 1851. They established a homestead on the banks of the Peace River. The Goffs were soon followed by other settlers, and the area began to grow.
In 1887, the town of Punta Gorda was officially incorporated. The town was named after the Spanish explorer who first explored the area. The town quickly grew, and by the early 1900s, it had become a popular tourist destination.
In 1921, a hurricane destroyed much of the town, but it was quickly rebuilt. In the 1950s, the town began to experience a population boom, and by the 1970s, it had become a popular retirement destination.
Geography
Punta Gorda is located in Charlotte County, Florida, on the Peace River. It is located about 25 miles north of Fort Myers and about 75 miles south of Tampa. The city covers an area of about 10 square miles, and is located at an elevation of about 10 feet above sea level.
The city is located on the Gulf Coast of Florida, and is bordered by the Charlotte Harbor estuary to the west and the Peace River to the east. The city is located in a humid subtropical climate zone, and experiences hot, humid summers and mild winters.
Economy
Punta Gorda’s economy is largely based on tourism and retirement. The city is home to several resorts and golf courses, and is a popular destination for retirees. The city is also home to several manufacturing companies, including a paper mill and a boat manufacturing plant.
The city is also home to several military bases, including the Charlotte County Airport, which is home to the U.S. Coast Guard. The city is also home to several hospitals and medical centers, including the Charlotte Regional Medical Center.
Demographics
As of the 2010 census, the population of Punta Gorda was 16,641. The racial makeup of the city was 87.3% White, 5.3% African American, 0.7% Native American, 1.2% Asian, 0.1% Pacific Islander, 3.2% from other races, and 2.2% from two or more races. Hispanic or Latino of any race were 11.2% of the population.
The median household income in Punta Gorda was $41,945, and the median family income was $50,945. The per capita income for the city was $25,945. About 11.2% of the population was below the poverty line.
Common Questions
What is Per Capita Income in Punta Gorda?
Per Capita income in Punta Gorda is $54,606.
What is the Median Family Income in Punta Gorda?
Median Family Income in Punta Gorda is $96,154.
What is the Median Household income in Punta Gorda?
Median Household Income in Punta Gorda is $75,898.
What is Income or Wage Gap in Punta Gorda?
Income or Wage Gap in Punta Gorda is 26.2%.
Women in Punta Gorda earn 73.8 cents for every dollar earned by a man.
What is Inequality or Gini Index in Punta Gorda?
Inequality or Gini Index in Punta Gorda is 0.47.
What is the Total Population of Punta Gorda?
Total Population of Punta Gorda is 19,605.
What is the Total Male Population of Punta Gorda?
Total Male Population of Punta Gorda is 9,559.
What is the Total Female Population of Punta Gorda?
Total Female Population of Punta Gorda is 10,046.
What is the Ratio of Males per 100 Females in Punta Gorda?
There are 95.15 Males per 100 Females in Punta Gorda.
What is the Ratio of Females per 100 Males in Punta Gorda?
There are 105.09 Females per 100 Males in Punta Gorda.
What is the Median Population Age in Punta Gorda?
Median Population Age in Punta Gorda is 66.3 Years.
What is the Average Family Size in Punta Gorda
Average Family Size in Punta Gorda is 2.4 People.
What is the Average Household Size in Punta Gorda
Average Household Size in Punta Gorda is 2.0 People.
How Large is the Labor Force in Punta Gorda?
There are 5,757 People in the Labor Forcein in Punta Gorda.
What is the Percentage of People in the Labor Force in Punta Gorda?
31.8% of People are in the Labor Force in Punta Gorda.
What is the Unemployment Rate in Punta Gorda?
Unemployment Rate in Punta Gorda is 4.9%.