Lutz, FL Map & Demographics
Lutz Map
Lutz Overview
$51,515
PER CAPITA INCOME
$131,209
AVG FAMILY INCOME
$101,159
AVG HOUSEHOLD INCOME
31.3%
WAGE / INCOME GAP [ % ]
68.7¢/ $1
WAGE / INCOME GAP [ $ ]
0.45
INEQUALITY / GINI INDEX
24,721
TOTAL POPULATION
12,284
MALE POPULATION
12,437
FEMALE POPULATION
98.77
MALES / 100 FEMALES
101.25
FEMALES / 100 MALES
41.0
MEDIAN AGE
3.2
AVG FAMILY SIZE
2.7
AVG HOUSEHOLD SIZE
12,725
LABOR FORCE [ PEOPLE ]
65.0%
PERCENT IN LABOR FORCE
2.7%
UNEMPLOYMENT RATE
Lutz Area Codes
Income in Lutz
Income Overview in Lutz
Per Capita Income in Lutz is $51,515, while median incomes of families and households are $131,209 and $101,159 respectively.
| Characteristic | Number | Measure |
| Per Capita Income | 24,721 | $51,515 |
| Median Family Income | 6,516 | $131,209 |
| Mean Family Income | 6,516 | $163,176 |
| Median Household Income | 9,041 | $101,159 |
| Mean Household Income | 9,041 | $137,143 |
| Income Deficit | 6,516 | $0 |
| Wage / Income Gap (%) | 24,721 | 31.28% |
| Wage / Income Gap ($) | 24,721 | 68.72¢ per $1 |
| Gini / Inequality Index | 24,721 | 0.45 |
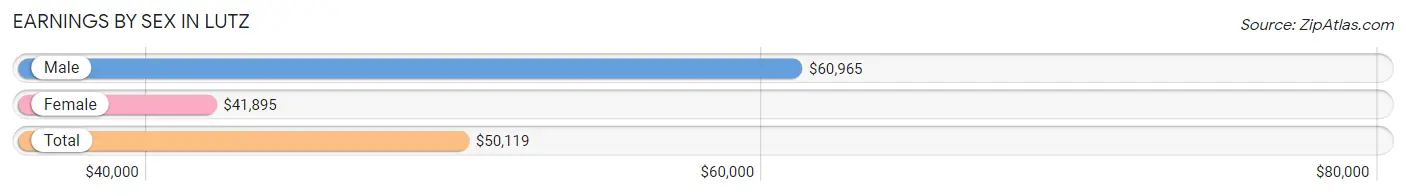
Earnings by Sex in Lutz
Average Earnings in Lutz are $50,119, $60,965 for men and $41,895 for women, a difference of 31.3%.
| Sex | Number | Average Earnings |
| Male | 7,096 (52.8%) | $60,965 |
| Female | 6,351 (47.2%) | $41,895 |
| Total | 13,447 (100.0%) | $50,119 |
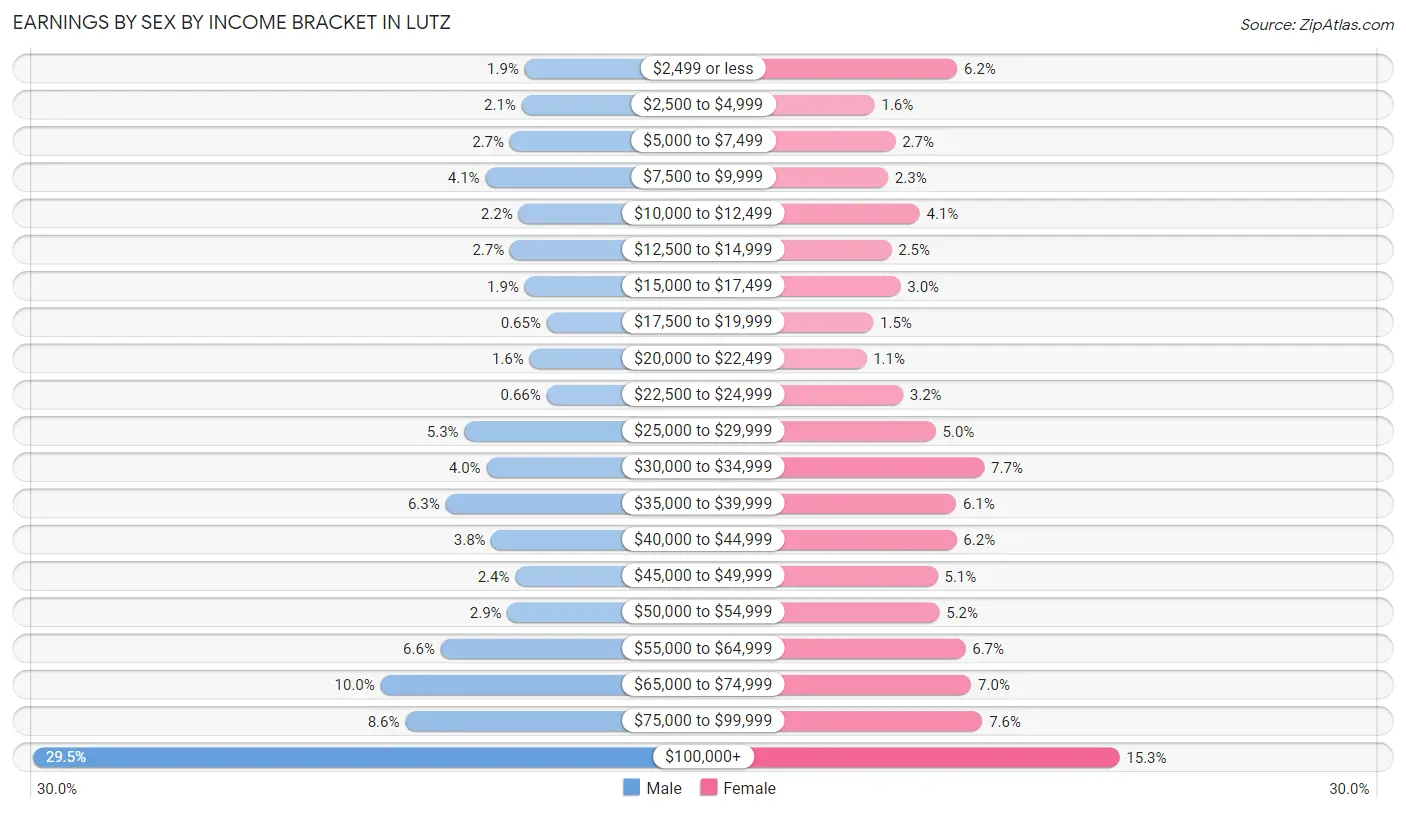
Earnings by Sex by Income Bracket in Lutz
The most common earnings brackets in Lutz are $100,000+ for men (2,096 | 29.5%) and $100,000+ for women (973 | 15.3%).
| Income | Male | Female |
| $2,499 or less | 134 (1.9%) | 394 (6.2%) |
| $2,500 to $4,999 | 146 (2.1%) | 99 (1.6%) |
| $5,000 to $7,499 | 194 (2.7%) | 173 (2.7%) |
| $7,500 to $9,999 | 291 (4.1%) | 147 (2.3%) |
| $10,000 to $12,499 | 159 (2.2%) | 260 (4.1%) |
| $12,500 to $14,999 | 192 (2.7%) | 159 (2.5%) |
| $15,000 to $17,499 | 134 (1.9%) | 191 (3.0%) |
| $17,500 to $19,999 | 46 (0.6%) | 94 (1.5%) |
| $20,000 to $22,499 | 115 (1.6%) | 69 (1.1%) |
| $22,500 to $24,999 | 47 (0.7%) | 200 (3.2%) |
| $25,000 to $29,999 | 375 (5.3%) | 317 (5.0%) |
| $30,000 to $34,999 | 287 (4.0%) | 490 (7.7%) |
| $35,000 to $39,999 | 450 (6.3%) | 390 (6.1%) |
| $40,000 to $44,999 | 267 (3.8%) | 391 (6.2%) |
| $45,000 to $49,999 | 172 (2.4%) | 324 (5.1%) |
| $50,000 to $54,999 | 203 (2.9%) | 330 (5.2%) |
| $55,000 to $64,999 | 469 (6.6%) | 423 (6.7%) |
| $65,000 to $74,999 | 709 (10.0%) | 444 (7.0%) |
| $75,000 to $99,999 | 610 (8.6%) | 483 (7.6%) |
| $100,000+ | 2,096 (29.5%) | 973 (15.3%) |
| Total | 7,096 (100.0%) | 6,351 (100.0%) |
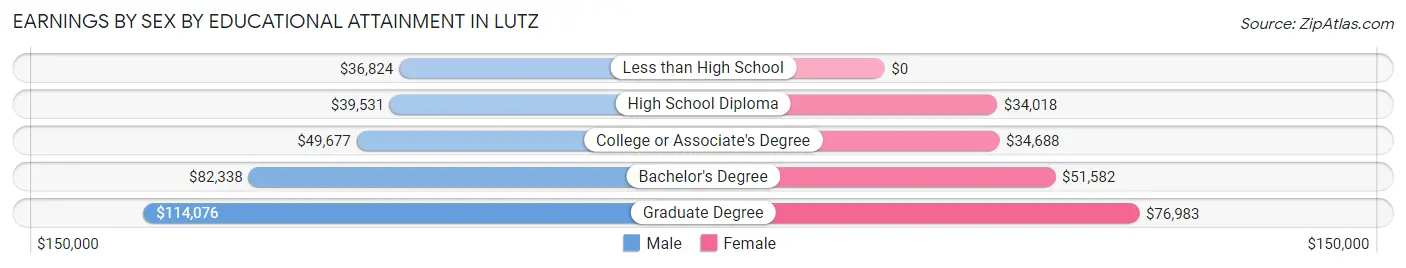
Earnings by Sex by Educational Attainment in Lutz
Average earnings in Lutz are $68,237 for men and $47,533 for women, a difference of 30.3%. Men with an educational attainment of graduate degree enjoy the highest average annual earnings of $114,076, while those with less than high school education earn the least with $36,824. Women with an educational attainment of graduate degree earn the most with the average annual earnings of $76,983, while those with high school diploma education have the smallest earnings of $34,018.
| Educational Attainment | Male Income | Female Income |
| Less than High School | $36,824 | $0 |
| High School Diploma | $39,531 | $34,018 |
| College or Associate's Degree | $49,677 | $34,688 |
| Bachelor's Degree | $82,338 | $51,582 |
| Graduate Degree | $114,076 | $76,983 |
| Total | $68,237 | $47,533 |
Family Income in Lutz
Family Income Brackets in Lutz
According to the Lutz family income data, there are 1,753 families falling into the $200,000+ income range, which is the most common income bracket and makes up 26.9% of all families. Conversely, the less than $10,000 income bracket is the least frequent group with only 65 families (1.0%) belonging to this category.
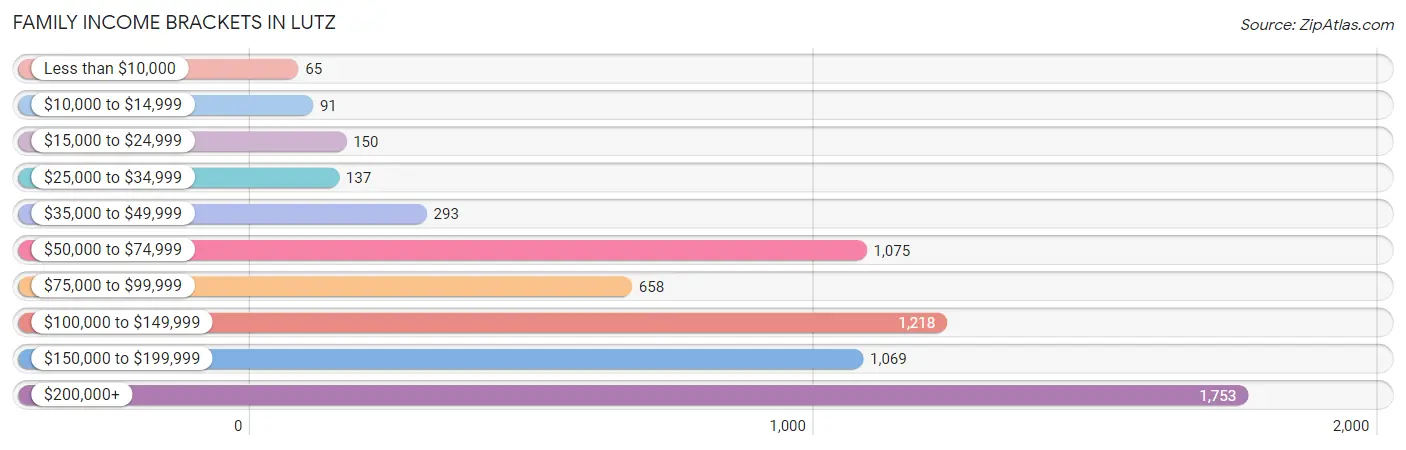
| Income Bracket | # Families | % Families |
| Less than $10,000 | 65 | 1.0% |
| $10,000 to $14,999 | 91 | 1.4% |
| $15,000 to $24,999 | 150 | 2.3% |
| $25,000 to $34,999 | 137 | 2.1% |
| $35,000 to $49,999 | 293 | 4.5% |
| $50,000 to $74,999 | 1,075 | 16.5% |
| $75,000 to $99,999 | 658 | 10.1% |
| $100,000 to $149,999 | 1,218 | 18.7% |
| $150,000 to $199,999 | 1,069 | 16.4% |
| $200,000+ | 1,753 | 26.9% |
Family Income by Famaliy Size in Lutz
6-person families (128 | 2.0%) account for the highest median family income in Lutz with $250,001 per family, while 2-person families (2,763 | 42.4%) have the highest median income of $55,492 per family member.
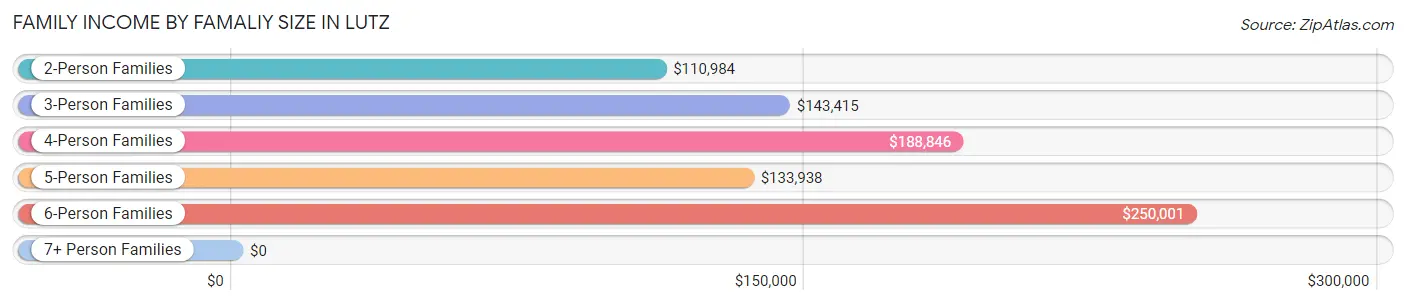
| Income Bracket | # Families | Median Income |
| 2-Person Families | 2,763 (42.4%) | $110,984 |
| 3-Person Families | 1,668 (25.6%) | $143,415 |
| 4-Person Families | 1,278 (19.6%) | $188,846 |
| 5-Person Families | 537 (8.2%) | $133,938 |
| 6-Person Families | 128 (2.0%) | $250,001 |
| 7+ Person Families | 142 (2.2%) | $0 |
| Total | 6,516 (100.0%) | $131,209 |
Family Income by Number of Earners in Lutz
The median family income in Lutz is $131,209, with families comprising 3+ earners (810) having the highest median family income of $159,712, while families with no earners (748) have the lowest median family income of $61,111, accounting for 12.4% and 11.5% of families, respectively.
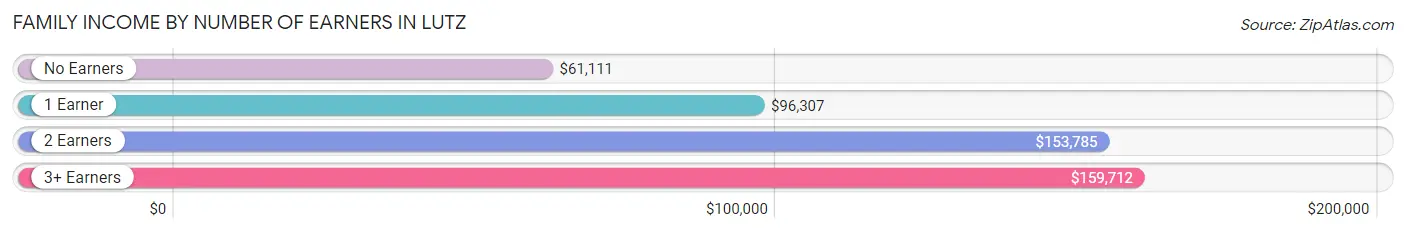
| Number of Earners | # Families | Median Income |
| No Earners | 748 (11.5%) | $61,111 |
| 1 Earner | 1,787 (27.4%) | $96,307 |
| 2 Earners | 3,171 (48.7%) | $153,785 |
| 3+ Earners | 810 (12.4%) | $159,712 |
| Total | 6,516 (100.0%) | $131,209 |
Household Income in Lutz
Household Income Brackets in Lutz
With 1,826 households falling in the category, the $200,000+ income range is the most frequent in Lutz, accounting for 20.2% of all households. In contrast, only 181 households (2.0%) fall into the less than $10,000 income bracket, making it the least populous group.
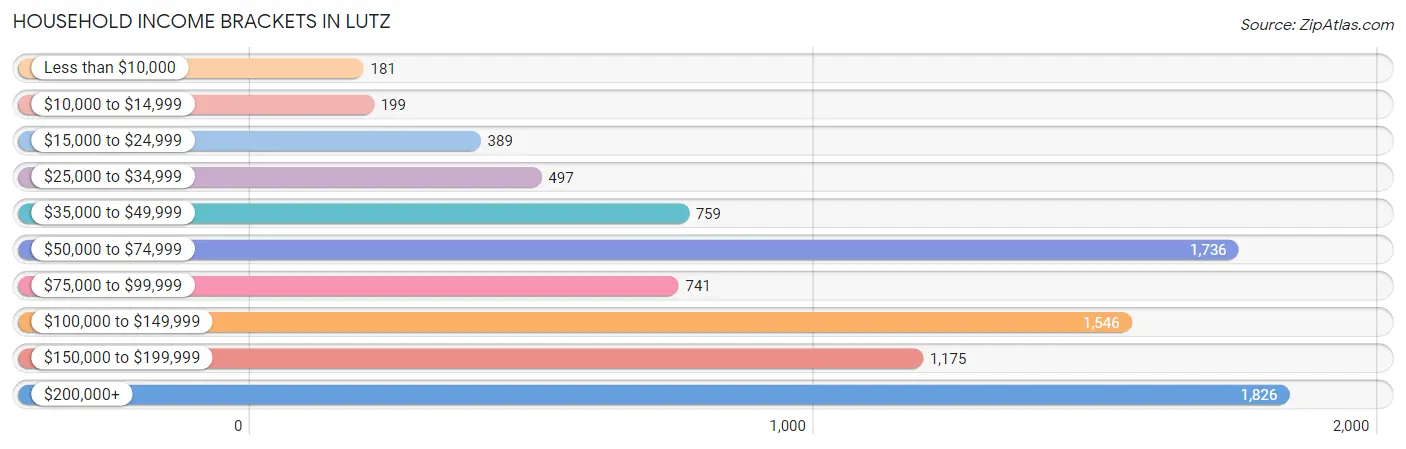
| Income Bracket | # Households | % Households |
| Less than $10,000 | 181 | 2.0% |
| $10,000 to $14,999 | 199 | 2.2% |
| $15,000 to $24,999 | 389 | 4.3% |
| $25,000 to $34,999 | 497 | 5.5% |
| $35,000 to $49,999 | 759 | 8.4% |
| $50,000 to $74,999 | 1,736 | 19.2% |
| $75,000 to $99,999 | 741 | 8.2% |
| $100,000 to $149,999 | 1,546 | 17.1% |
| $150,000 to $199,999 | 1,175 | 13.0% |
| $200,000+ | 1,826 | 20.2% |
Household Income by Householder Age in Lutz
The median household income in Lutz is $101,159, with the highest median household income of $132,614 found in the 45 to 64 years age bracket for the primary householder. A total of 3,527 households (39.0%) fall into this category. Meanwhile, the 15 to 24 years age bracket for the primary householder has the lowest median household income of $39,309, with 263 households (2.9%) in this group.
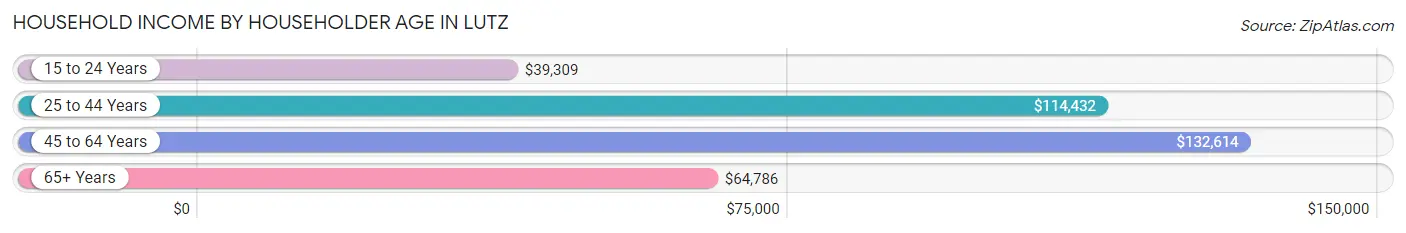
| Income Bracket | # Households | Median Income |
| 15 to 24 Years | 263 (2.9%) | $39,309 |
| 25 to 44 Years | 2,617 (28.9%) | $114,432 |
| 45 to 64 Years | 3,527 (39.0%) | $132,614 |
| 65+ Years | 2,634 (29.1%) | $64,786 |
| Total | 9,041 (100.0%) | $101,159 |
Poverty in Lutz
Income Below Poverty by Sex and Age in Lutz
With 4.6% poverty level for males and 5.0% for females among the residents of Lutz, 15 year old males and 5 year old females are the most vulnerable to poverty, with 53 males (31.0%) and 20 females (16.5%) in their respective age groups living below the poverty level.
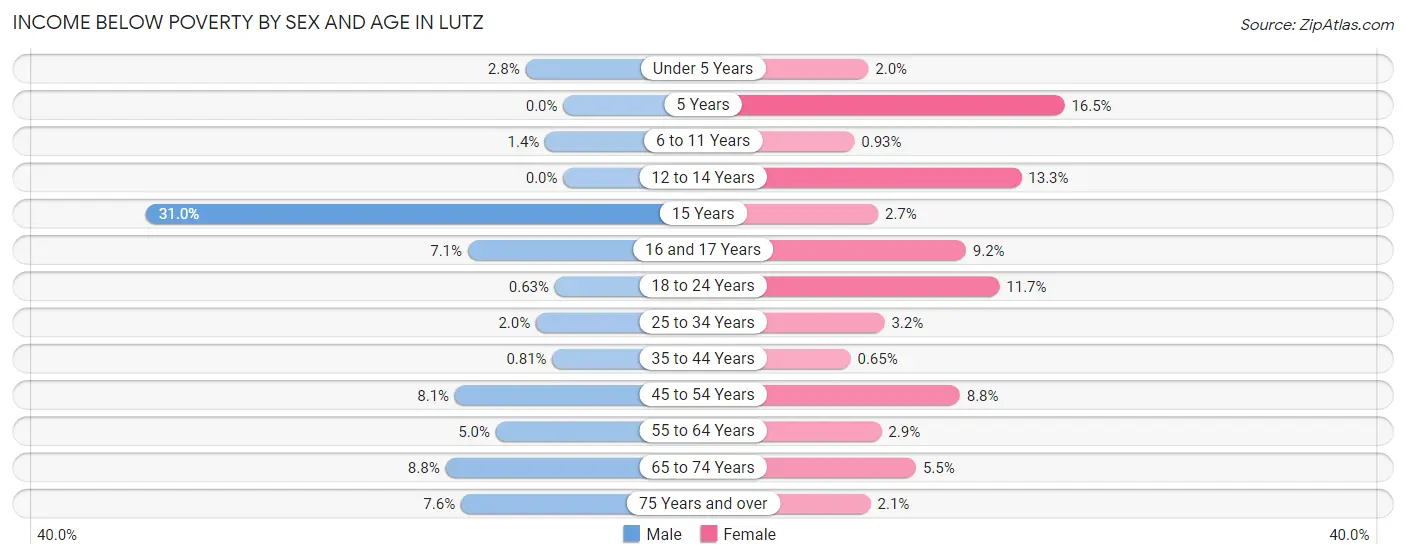
| Age Bracket | Male | Female |
| Under 5 Years | 22 (2.8%) | 9 (2.0%) |
| 5 Years | 0 (0.0%) | 20 (16.5%) |
| 6 to 11 Years | 16 (1.3%) | 11 (0.9%) |
| 12 to 14 Years | 0 (0.0%) | 58 (13.3%) |
| 15 Years | 53 (31.0%) | 6 (2.7%) |
| 16 and 17 Years | 28 (7.1%) | 35 (9.2%) |
| 18 to 24 Years | 4 (0.6%) | 139 (11.7%) |
| 25 to 34 Years | 29 (2.0%) | 42 (3.2%) |
| 35 to 44 Years | 13 (0.8%) | 10 (0.6%) |
| 45 to 54 Years | 134 (8.1%) | 154 (8.8%) |
| 55 to 64 Years | 80 (5.0%) | 47 (2.9%) |
| 65 to 74 Years | 132 (8.7%) | 73 (5.5%) |
| 75 Years and over | 49 (7.6%) | 18 (2.1%) |
| Total | 560 (4.6%) | 622 (5.0%) |
Income Above Poverty by Sex and Age in Lutz
According to the poverty statistics in Lutz, males aged 5 years and females aged 35 to 44 years are the age groups that are most secure financially, with 100.0% of males and 99.4% of females in these age groups living above the poverty line.
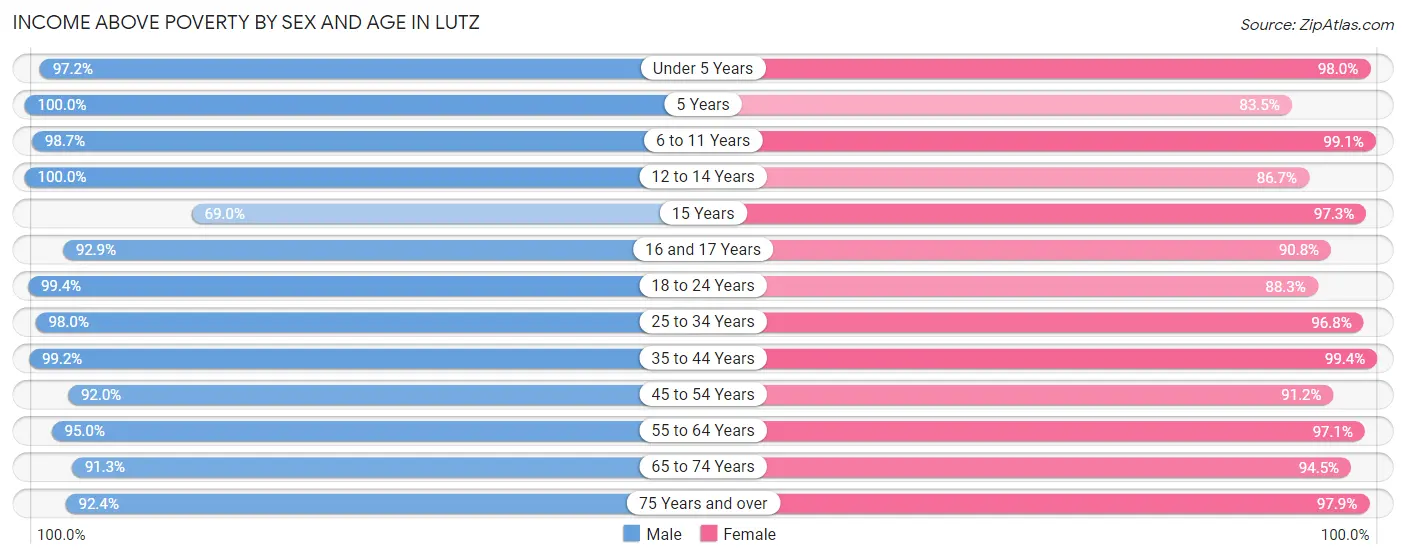
| Age Bracket | Male | Female |
| Under 5 Years | 760 (97.2%) | 448 (98.0%) |
| 5 Years | 126 (100.0%) | 101 (83.5%) |
| 6 to 11 Years | 1,172 (98.7%) | 1,171 (99.1%) |
| 12 to 14 Years | 441 (100.0%) | 377 (86.7%) |
| 15 Years | 118 (69.0%) | 217 (97.3%) |
| 16 and 17 Years | 367 (92.9%) | 345 (90.8%) |
| 18 to 24 Years | 633 (99.4%) | 1,049 (88.3%) |
| 25 to 34 Years | 1,402 (98.0%) | 1,285 (96.8%) |
| 35 to 44 Years | 1,601 (99.2%) | 1,518 (99.4%) |
| 45 to 54 Years | 1,530 (91.9%) | 1,603 (91.2%) |
| 55 to 64 Years | 1,518 (95.0%) | 1,553 (97.1%) |
| 65 to 74 Years | 1,376 (91.2%) | 1,253 (94.5%) |
| 75 Years and over | 596 (92.4%) | 824 (97.9%) |
| Total | 11,640 (95.4%) | 11,744 (95.0%) |
Income Below Poverty Among Married-Couple Families in Lutz
The poverty statistics for married-couple families in Lutz show that 2.1% or 116 of the total 5,582 families live below the poverty line. Families with 1 or 2 children have the highest poverty rate of 2.6%, comprising of 49 families. On the other hand, families with 3 or 4 children have the lowest poverty rate of 0.0%, which includes 0 families.
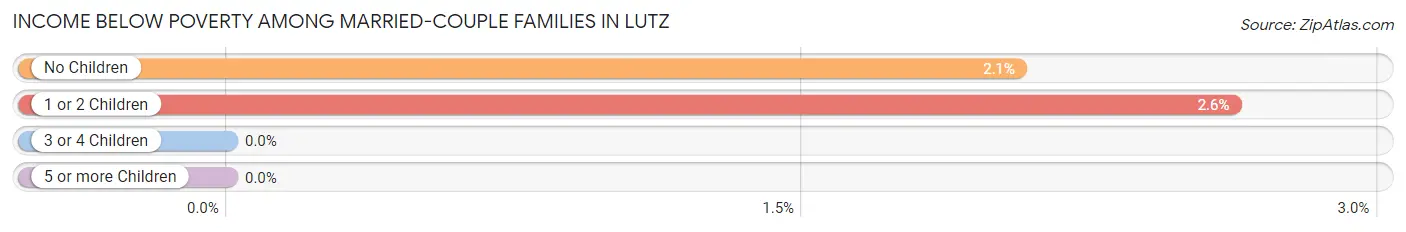
| Children | Above Poverty | Below Poverty |
| No Children | 3,183 (97.9%) | 67 (2.1%) |
| 1 or 2 Children | 1,824 (97.4%) | 49 (2.6%) |
| 3 or 4 Children | 381 (100.0%) | 0 (0.0%) |
| 5 or more Children | 78 (100.0%) | 0 (0.0%) |
| Total | 5,466 (97.9%) | 116 (2.1%) |
Income Below Poverty Among Single-Parent Households in Lutz
According to the poverty data in Lutz, 5.7% or 9 single-father households and 10.3% or 80 single-mother households are living below the poverty line. Among single-father households, those with 1 or 2 children have the highest poverty rate, with 9 households (11.5%) experiencing poverty. Likewise, among single-mother households, those with 1 or 2 children have the highest poverty rate, with 59 households (18.7%) falling below the poverty line.
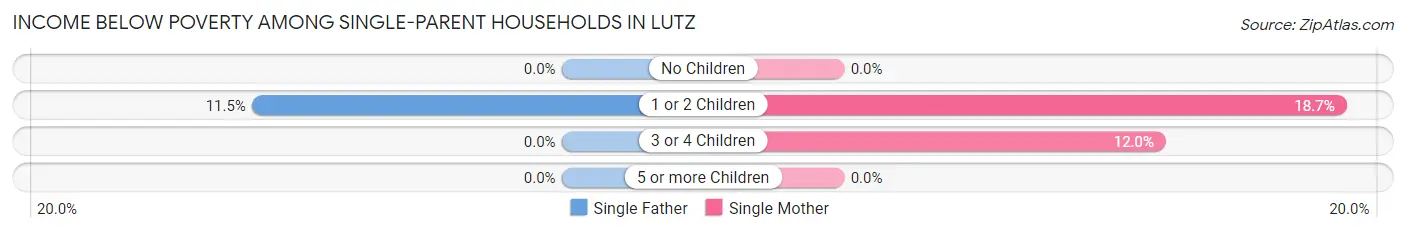
| Children | Single Father | Single Mother |
| No Children | 0 (0.0%) | 0 (0.0%) |
| 1 or 2 Children | 9 (11.5%) | 59 (18.7%) |
| 3 or 4 Children | 0 (0.0%) | 21 (12.0%) |
| 5 or more Children | 0 (0.0%) | 0 (0.0%) |
| Total | 9 (5.7%) | 80 (10.3%) |
Income Below Poverty Among Married-Couple vs Single-Parent Households in Lutz
The poverty data for Lutz shows that 116 of the married-couple family households (2.1%) and 89 of the single-parent households (9.5%) are living below the poverty level. Within the married-couple family households, those with 1 or 2 children have the highest poverty rate, with 49 households (2.6%) falling below the poverty line. Among the single-parent households, those with 1 or 2 children have the highest poverty rate, with 68 household (17.3%) living below poverty.
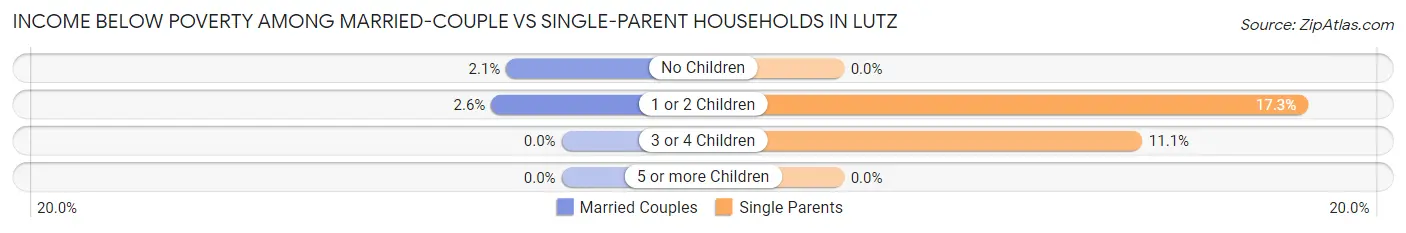
| Children | Married-Couple Families | Single-Parent Households |
| No Children | 67 (2.1%) | 0 (0.0%) |
| 1 or 2 Children | 49 (2.6%) | 68 (17.3%) |
| 3 or 4 Children | 0 (0.0%) | 21 (11.1%) |
| 5 or more Children | 0 (0.0%) | 0 (0.0%) |
| Total | 116 (2.1%) | 89 (9.5%) |
Race in Lutz
The most populous races in Lutz are White / Caucasian (18,023 | 72.9%), Hispanic or Latino (4,427 | 17.9%), and Two or more Races (3,087 | 12.5%).
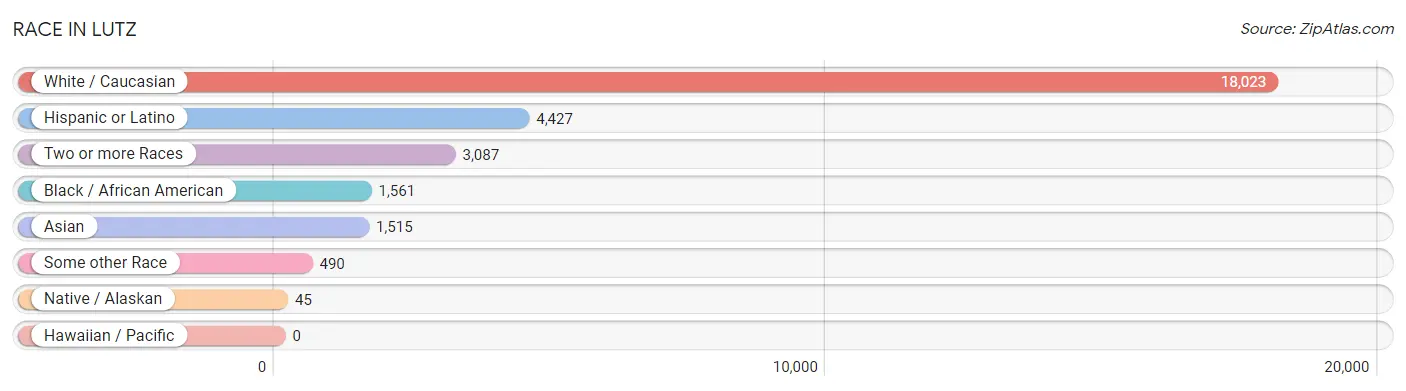
| Race | # Population | % Population |
| Asian | 1,515 | 6.1% |
| Black / African American | 1,561 | 6.3% |
| Hawaiian / Pacific | 0 | 0.0% |
| Hispanic or Latino | 4,427 | 17.9% |
| Native / Alaskan | 45 | 0.2% |
| White / Caucasian | 18,023 | 72.9% |
| Two or more Races | 3,087 | 12.5% |
| Some other Race | 490 | 2.0% |
| Total | 24,721 | 100.0% |
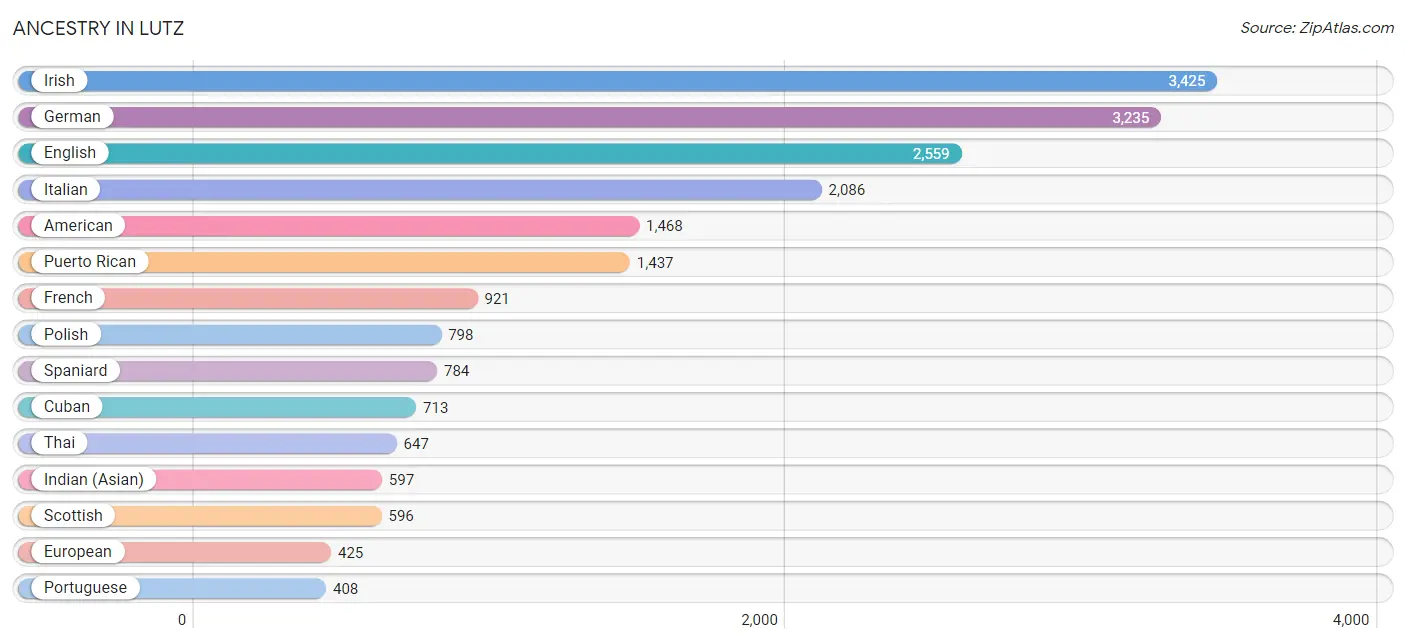
Ancestry in Lutz
The most populous ancestries reported in Lutz are Irish (3,425 | 13.9%), German (3,235 | 13.1%), English (2,559 | 10.3%), Italian (2,086 | 8.4%), and American (1,468 | 5.9%), together accounting for 51.7% of all Lutz residents.
| Ancestry | # Population | % Population |
| African | 59 | 0.2% |
| American | 1,468 | 5.9% |
| Arab | 298 | 1.2% |
| Argentinean | 83 | 0.3% |
| Armenian | 26 | 0.1% |
| Australian | 6 | 0.0% |
| Austrian | 21 | 0.1% |
| Belgian | 28 | 0.1% |
| Bhutanese | 62 | 0.3% |
| Brazilian | 66 | 0.3% |
| British | 282 | 1.1% |
| British West Indian | 15 | 0.1% |
| Burmese | 77 | 0.3% |
| Canadian | 23 | 0.1% |
| Central American | 379 | 1.5% |
| Central American Indian | 22 | 0.1% |
| Cherokee | 69 | 0.3% |
| Choctaw | 9 | 0.0% |
| Colombian | 145 | 0.6% |
| Costa Rican | 89 | 0.4% |
| Croatian | 8 | 0.0% |
| Cuban | 713 | 2.9% |
| Czech | 243 | 1.0% |
| Danish | 104 | 0.4% |
| Dominican | 129 | 0.5% |
| Dutch | 154 | 0.6% |
| Eastern European | 134 | 0.5% |
| Ecuadorian | 52 | 0.2% |
| Egyptian | 66 | 0.3% |
| English | 2,559 | 10.3% |
| European | 425 | 1.7% |
| Finnish | 17 | 0.1% |
| French | 921 | 3.7% |
| French American Indian | 10 | 0.0% |
| French Canadian | 49 | 0.2% |
| German | 3,235 | 13.1% |
| Greek | 110 | 0.4% |
| Guatemalan | 24 | 0.1% |
| Haitian | 136 | 0.5% |
| Honduran | 241 | 1.0% |
| Hungarian | 204 | 0.8% |
| Indian (Asian) | 597 | 2.4% |
| Iranian | 9 | 0.0% |
| Irish | 3,425 | 13.9% |
| Iroquois | 7 | 0.0% |
| Italian | 2,086 | 8.4% |
| Jamaican | 113 | 0.5% |
| Korean | 78 | 0.3% |
| Lebanese | 186 | 0.7% |
| Lithuanian | 34 | 0.1% |
| Luxembourger | 7 | 0.0% |
| Maltese | 82 | 0.3% |
| Mexican | 387 | 1.6% |
| Northern European | 95 | 0.4% |
| Norwegian | 192 | 0.8% |
| Pakistani | 37 | 0.2% |
| Palestinian | 24 | 0.1% |
| Panamanian | 12 | 0.1% |
| Peruvian | 21 | 0.1% |
| Polish | 798 | 3.2% |
| Portuguese | 408 | 1.7% |
| Puerto Rican | 1,437 | 5.8% |
| Russian | 196 | 0.8% |
| Salvadoran | 13 | 0.1% |
| Samoan | 22 | 0.1% |
| Scandinavian | 78 | 0.3% |
| Scotch-Irish | 176 | 0.7% |
| Scottish | 596 | 2.4% |
| Sierra Leonean | 9 | 0.0% |
| Sioux | 14 | 0.1% |
| Slavic | 8 | 0.0% |
| Slovak | 67 | 0.3% |
| South American | 312 | 1.3% |
| Spaniard | 784 | 3.2% |
| Spanish | 134 | 0.5% |
| Sri Lankan | 133 | 0.5% |
| Subsaharan African | 68 | 0.3% |
| Swedish | 225 | 0.9% |
| Swiss | 6 | 0.0% |
| Thai | 647 | 2.6% |
| Turkish | 18 | 0.1% |
| Ukrainian | 227 | 0.9% |
| Venezuelan | 11 | 0.0% |
| Welsh | 91 | 0.4% |
| West Indian | 9 | 0.0% | View All 85 Rows |
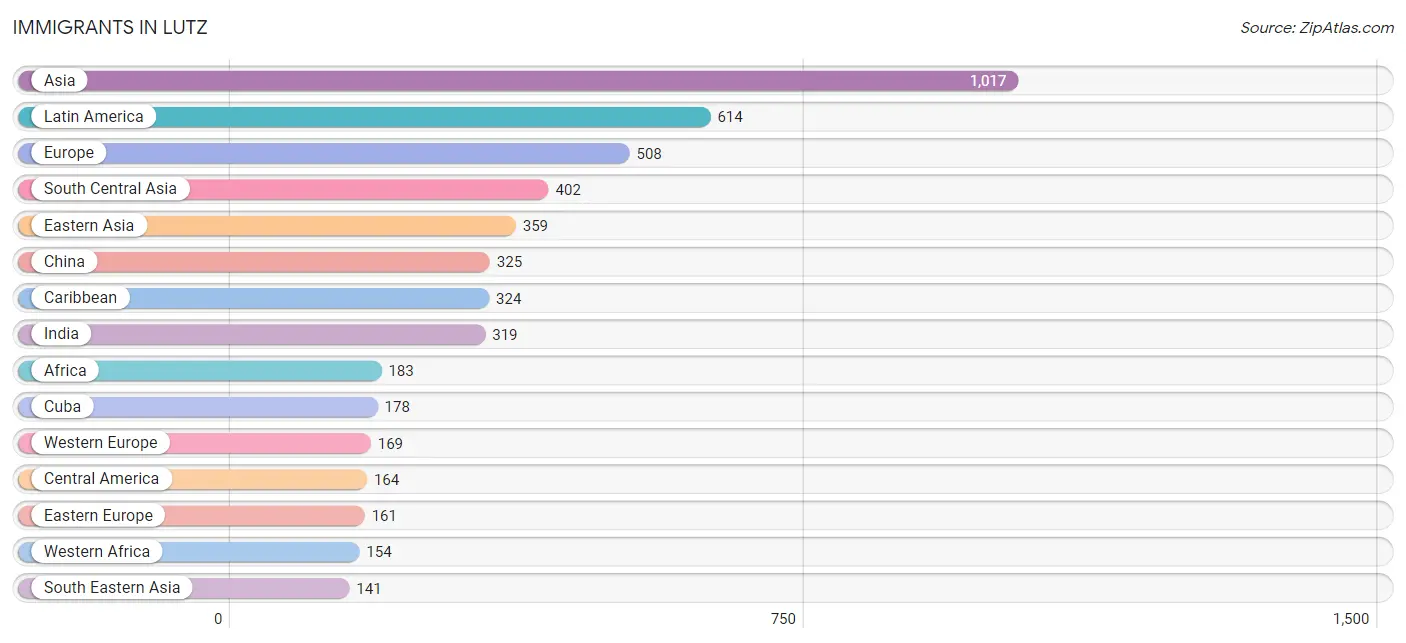
Immigrants in Lutz
The most numerous immigrant groups reported in Lutz came from Asia (1,017 | 4.1%), Latin America (614 | 2.5%), Europe (508 | 2.1%), South Central Asia (402 | 1.6%), and Eastern Asia (359 | 1.5%), together accounting for 11.7% of all Lutz residents.
| Immigration Origin | # Population | % Population |
| Africa | 183 | 0.7% |
| Asia | 1,017 | 4.1% |
| Barbados | 15 | 0.1% |
| Belarus | 13 | 0.1% |
| Brazil | 39 | 0.2% |
| Canada | 73 | 0.3% |
| Caribbean | 324 | 1.3% |
| Central America | 164 | 0.7% |
| China | 325 | 1.3% |
| Colombia | 30 | 0.1% |
| Costa Rica | 6 | 0.0% |
| Cuba | 178 | 0.7% |
| Denmark | 21 | 0.1% |
| Dominica | 22 | 0.1% |
| Dominican Republic | 22 | 0.1% |
| Eastern Africa | 19 | 0.1% |
| Eastern Asia | 359 | 1.5% |
| Eastern Europe | 161 | 0.6% |
| Ecuador | 25 | 0.1% |
| Egypt | 10 | 0.0% |
| England | 75 | 0.3% |
| Europe | 508 | 2.1% |
| France | 41 | 0.2% |
| Germany | 88 | 0.4% |
| Guatemala | 1 | 0.0% |
| Haiti | 28 | 0.1% |
| Honduras | 112 | 0.4% |
| India | 319 | 1.3% |
| Indonesia | 7 | 0.0% |
| Iran | 20 | 0.1% |
| Ireland | 22 | 0.1% |
| Israel | 6 | 0.0% |
| Italy | 7 | 0.0% |
| Jamaica | 45 | 0.2% |
| Kenya | 19 | 0.1% |
| Korea | 34 | 0.1% |
| Latin America | 614 | 2.5% |
| Lebanon | 81 | 0.3% |
| Mexico | 33 | 0.1% |
| Nepal | 16 | 0.1% |
| Northern Africa | 10 | 0.0% |
| Northern Europe | 131 | 0.5% |
| Pakistan | 22 | 0.1% |
| Panama | 12 | 0.1% |
| Peru | 21 | 0.1% |
| Philippines | 19 | 0.1% |
| Poland | 21 | 0.1% |
| Portugal | 34 | 0.1% |
| Russia | 23 | 0.1% |
| Senegal | 127 | 0.5% |
| Sierra Leone | 9 | 0.0% |
| South America | 126 | 0.5% |
| South Central Asia | 402 | 1.6% |
| South Eastern Asia | 141 | 0.6% |
| Southern Europe | 47 | 0.2% |
| Spain | 6 | 0.0% |
| Sri Lanka | 25 | 0.1% |
| Switzerland | 40 | 0.2% |
| Thailand | 53 | 0.2% |
| Turkey | 28 | 0.1% |
| Ukraine | 104 | 0.4% |
| Venezuela | 11 | 0.0% |
| Vietnam | 62 | 0.3% |
| Western Africa | 154 | 0.6% |
| Western Asia | 115 | 0.5% |
| Western Europe | 169 | 0.7% | View All 66 Rows |
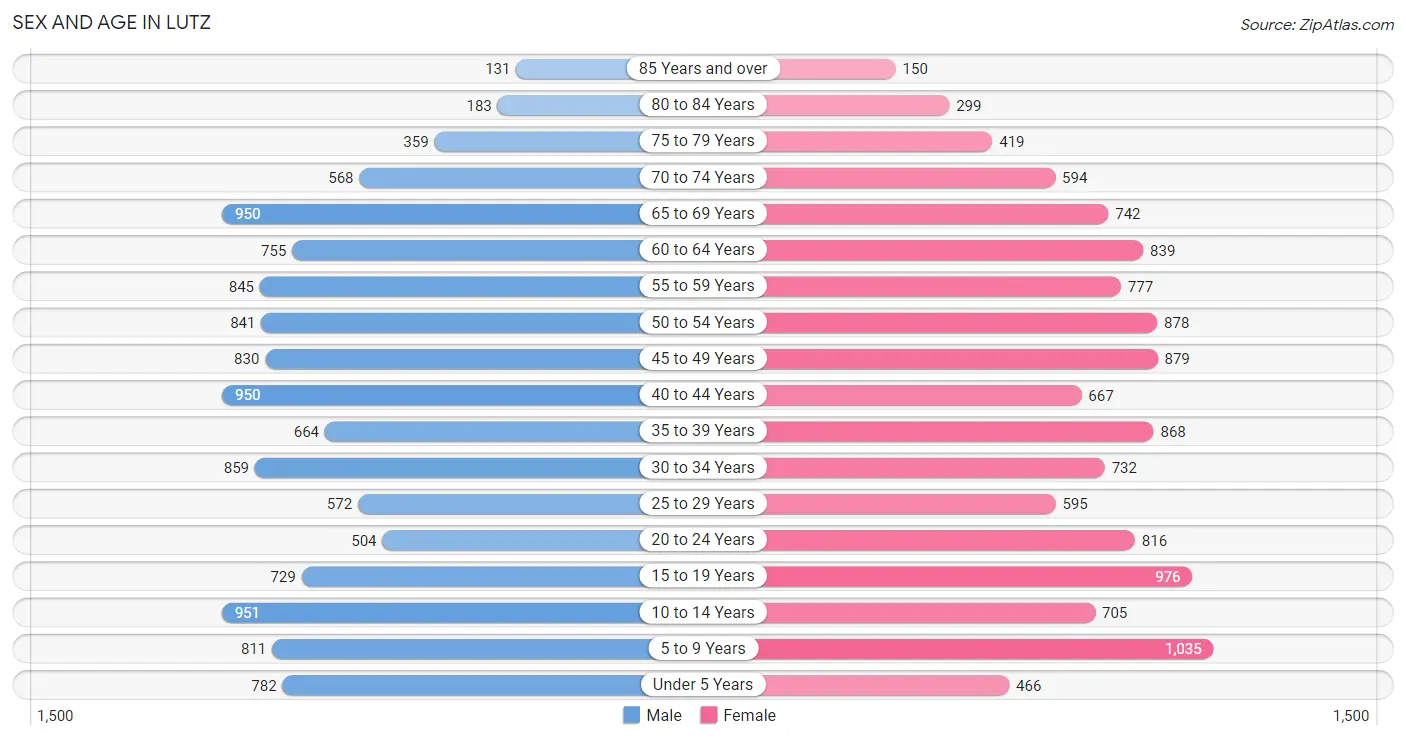
Sex and Age in Lutz
Sex and Age in Lutz
The most populous age groups in Lutz are 10 to 14 Years (951 | 7.7%) for men and 5 to 9 Years (1,035 | 8.3%) for women.
| Age Bracket | Male | Female |
| Under 5 Years | 782 (6.4%) | 466 (3.7%) |
| 5 to 9 Years | 811 (6.6%) | 1,035 (8.3%) |
| 10 to 14 Years | 951 (7.7%) | 705 (5.7%) |
| 15 to 19 Years | 729 (5.9%) | 976 (7.9%) |
| 20 to 24 Years | 504 (4.1%) | 816 (6.6%) |
| 25 to 29 Years | 572 (4.7%) | 595 (4.8%) |
| 30 to 34 Years | 859 (7.0%) | 732 (5.9%) |
| 35 to 39 Years | 664 (5.4%) | 868 (7.0%) |
| 40 to 44 Years | 950 (7.7%) | 667 (5.4%) |
| 45 to 49 Years | 830 (6.8%) | 879 (7.1%) |
| 50 to 54 Years | 841 (6.9%) | 878 (7.1%) |
| 55 to 59 Years | 845 (6.9%) | 777 (6.2%) |
| 60 to 64 Years | 755 (6.1%) | 839 (6.8%) |
| 65 to 69 Years | 950 (7.7%) | 742 (6.0%) |
| 70 to 74 Years | 568 (4.6%) | 594 (4.8%) |
| 75 to 79 Years | 359 (2.9%) | 419 (3.4%) |
| 80 to 84 Years | 183 (1.5%) | 299 (2.4%) |
| 85 Years and over | 131 (1.1%) | 150 (1.2%) |
| Total | 12,284 (100.0%) | 12,437 (100.0%) |
Families and Households in Lutz
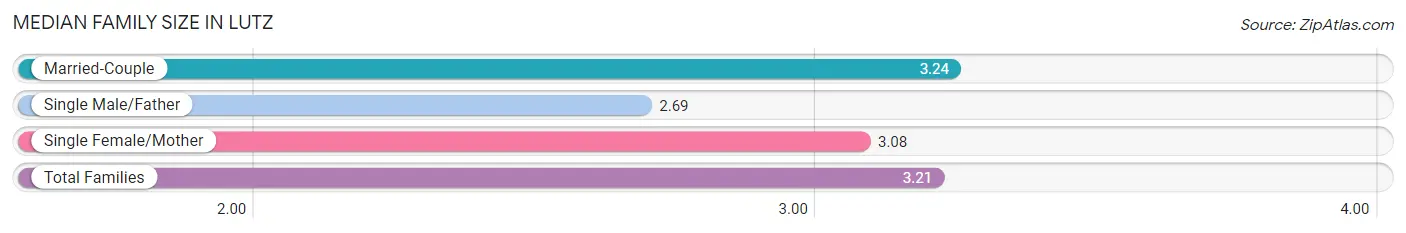
Median Family Size in Lutz
The median family size in Lutz is 3.21 persons per family, with married-couple families (5,582 | 85.7%) accounting for the largest median family size of 3.24 persons per family. On the other hand, single male/father families (159 | 2.4%) represent the smallest median family size with 2.69 persons per family.
| Family Type | # Families | Family Size |
| Married-Couple | 5,582 (85.7%) | 3.24 |
| Single Male/Father | 159 (2.4%) | 2.69 |
| Single Female/Mother | 775 (11.9%) | 3.08 |
| Total Families | 6,516 (100.0%) | 3.21 |
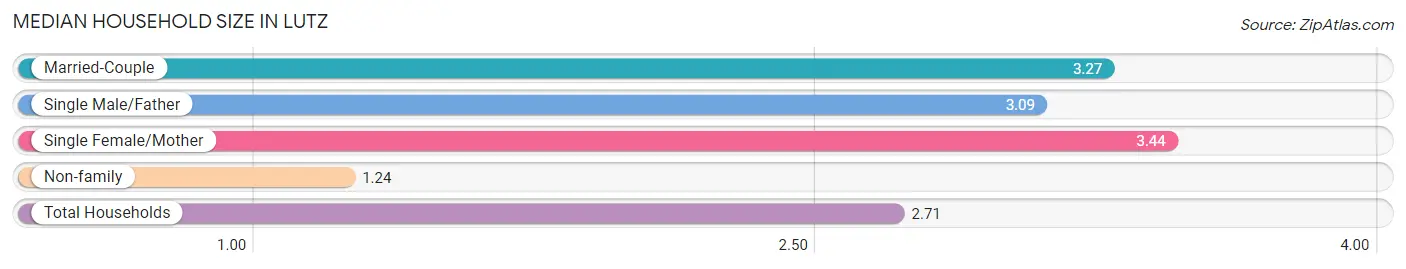
Median Household Size in Lutz
The median household size in Lutz is 2.71 persons per household, with single female/mother households (775 | 8.6%) accounting for the largest median household size of 3.44 persons per household. non-family households (2,525 | 27.9%) represent the smallest median household size with 1.24 persons per household.
| Household Type | # Households | Household Size |
| Married-Couple | 5,582 (61.7%) | 3.27 |
| Single Male/Father | 159 (1.8%) | 3.09 |
| Single Female/Mother | 775 (8.6%) | 3.44 |
| Non-family | 2,525 (27.9%) | 1.24 |
| Total Households | 9,041 (100.0%) | 2.71 |
Household Size by Marriage Status in Lutz
Out of a total of 9,041 households in Lutz, 6,516 (72.1%) are family households, while 2,525 (27.9%) are nonfamily households. The most numerous type of family households are 2-person households, comprising 2,630, and the most common type of nonfamily households are 1-person households, comprising 2,084.
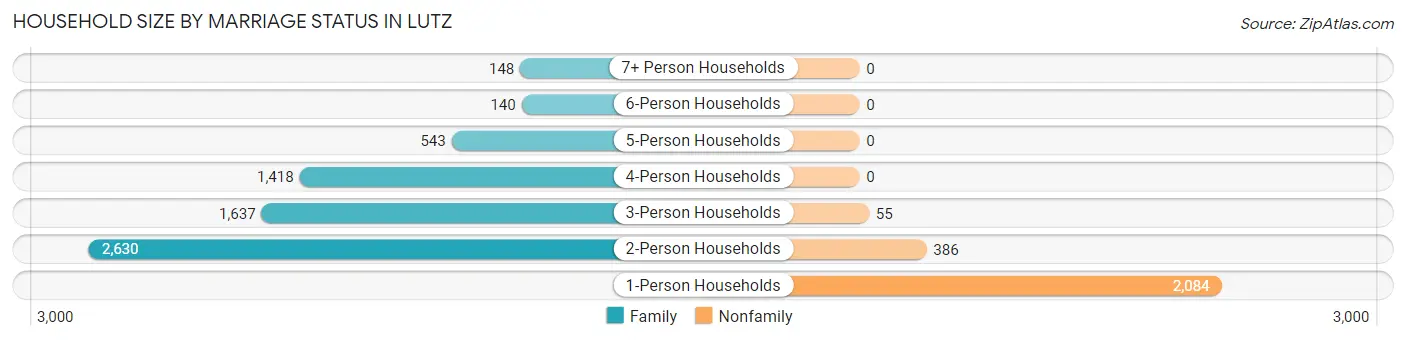
| Household Size | Family Households | Nonfamily Households |
| 1-Person Households | - | 2,084 (23.1%) |
| 2-Person Households | 2,630 (29.1%) | 386 (4.3%) |
| 3-Person Households | 1,637 (18.1%) | 55 (0.6%) |
| 4-Person Households | 1,418 (15.7%) | 0 (0.0%) |
| 5-Person Households | 543 (6.0%) | 0 (0.0%) |
| 6-Person Households | 140 (1.5%) | 0 (0.0%) |
| 7+ Person Households | 148 (1.6%) | 0 (0.0%) |
| Total | 6,516 (72.1%) | 2,525 (27.9%) |
Female Fertility in Lutz
Fertility by Age in Lutz
Average fertility rate in Lutz is 24.0 births per 1,000 women. Women in the age bracket of 35 to 50 years have the highest fertility rate with 40.0 births per 1,000 women. Women in the age bracket of 35 to 50 years acount for 76.3% of all women with births.
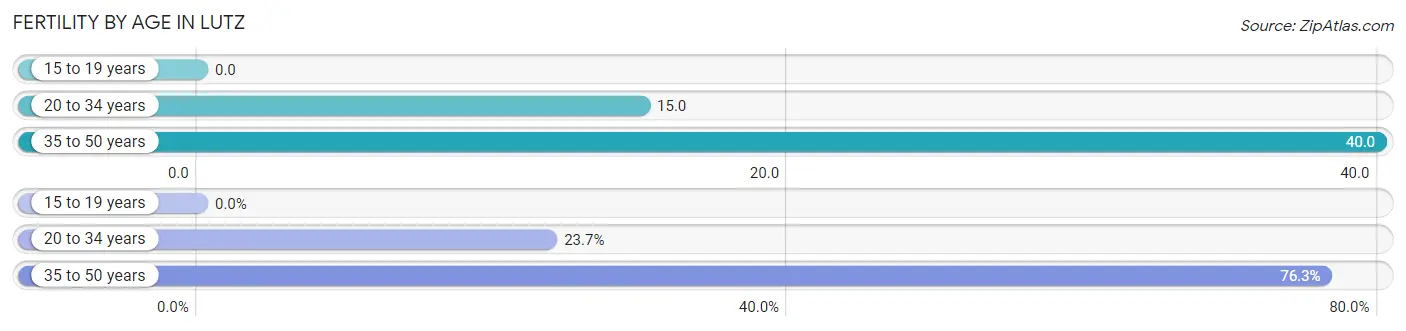
| Age Bracket | Women with Births | Births / 1,000 Women |
| 15 to 19 years | 0 (0.0%) | 0.0 |
| 20 to 34 years | 32 (23.7%) | 15.0 |
| 35 to 50 years | 103 (76.3%) | 40.0 |
| Total | 135 (100.0%) | 24.0 |
Fertility by Age by Marriage Status in Lutz
65.9% of women with births (135) in Lutz are married. The highest percentage of unmarried women with births falls into 35 to 50 years age bracket with 44.7% of them unmarried at the time of birth, while the lowest percentage of unmarried women with births belong to 20 to 34 years age bracket with 0.0% of them unmarried.
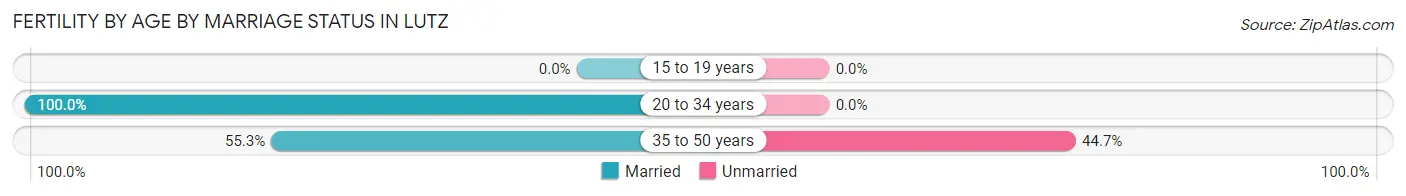
| Age Bracket | Married | Unmarried |
| 15 to 19 years | 0 (0.0%) | 0 (0.0%) |
| 20 to 34 years | 32 (100.0%) | 0 (0.0%) |
| 35 to 50 years | 57 (55.3%) | 46 (44.7%) |
| Total | 89 (65.9%) | 46 (34.1%) |
Fertility by Education in Lutz
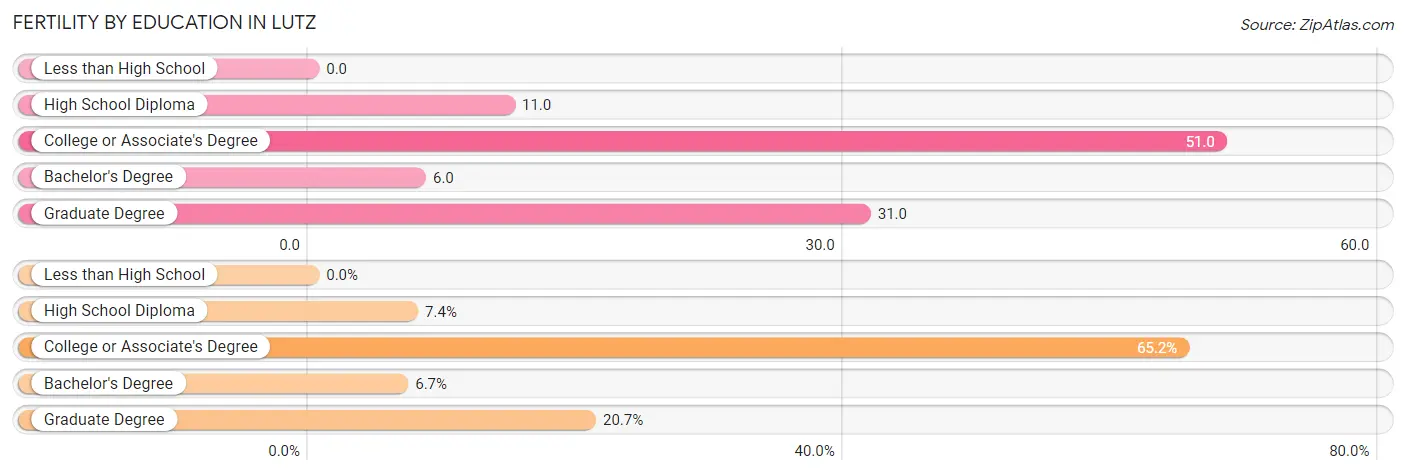
| Educational Attainment | Women with Births | Births / 1,000 Women |
| Less than High School | 0 (0.0%) | 0.0 |
| High School Diploma | 10 (7.4%) | 11.0 |
| College or Associate's Degree | 88 (65.2%) | 51.0 |
| Bachelor's Degree | 9 (6.7%) | 6.0 |
| Graduate Degree | 28 (20.7%) | 31.0 |
| Total | 135 (100.0%) | 24.0 |
Fertility by Education by Marriage Status in Lutz
34.1% of women with births in Lutz are unmarried. Women with the educational attainment of high school diploma are most likely to be married with 100.0% of them married at childbirth, while women with the educational attainment of college or associate's degree are least likely to be married with 52.3% of them unmarried at childbirth.
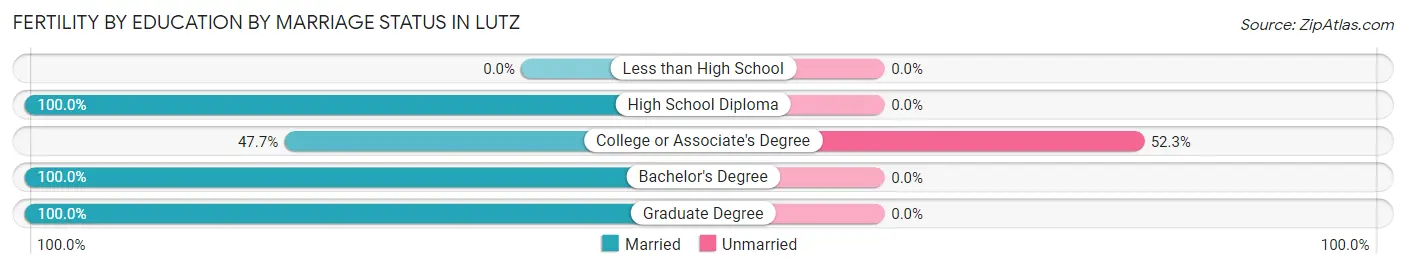
| Educational Attainment | Married | Unmarried |
| Less than High School | 0 (0.0%) | 0 (0.0%) |
| High School Diploma | 10 (100.0%) | 0 (0.0%) |
| College or Associate's Degree | 42 (47.7%) | 46 (52.3%) |
| Bachelor's Degree | 9 (100.0%) | 0 (0.0%) |
| Graduate Degree | 28 (100.0%) | 0 (0.0%) |
| Total | 89 (65.9%) | 46 (34.1%) |
Employment Characteristics in Lutz
Employment by Class of Employer in Lutz
Among the 12,072 employed individuals in Lutz, private company employees (7,958 | 65.9%), not-for-profit organizations (1,052 | 8.7%), and local government employees (940 | 7.8%) make up the most common classes of employment.
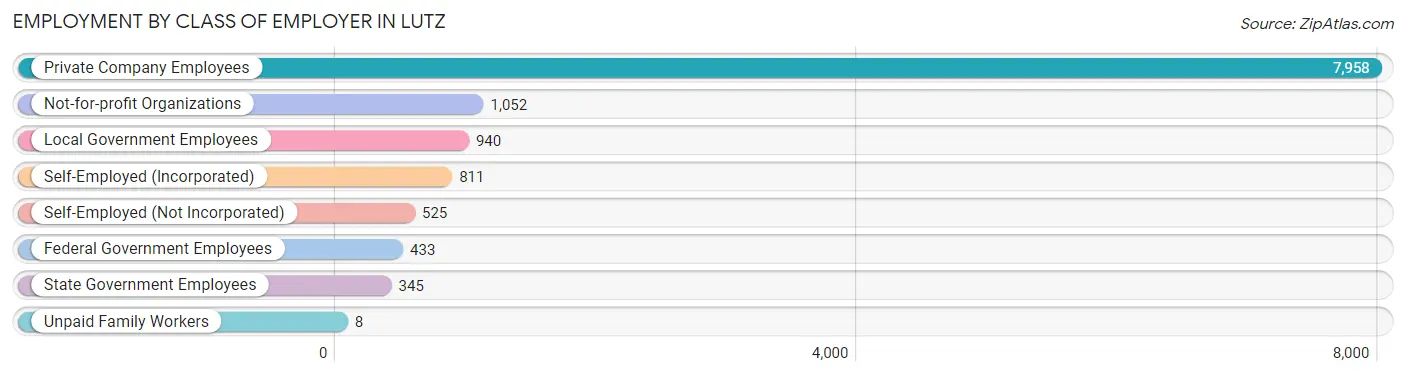
| Employer Class | # Employees | % Employees |
| Private Company Employees | 7,958 | 65.9% |
| Self-Employed (Incorporated) | 811 | 6.7% |
| Self-Employed (Not Incorporated) | 525 | 4.3% |
| Not-for-profit Organizations | 1,052 | 8.7% |
| Local Government Employees | 940 | 7.8% |
| State Government Employees | 345 | 2.9% |
| Federal Government Employees | 433 | 3.6% |
| Unpaid Family Workers | 8 | 0.1% |
| Total | 12,072 | 100.0% |
Employment Status by Age in Lutz
According to the labor force statistics for Lutz, out of the total population over 16 years of age (19,577), 65.0% or 12,725 individuals are in the labor force, with 2.7% or 344 of them unemployed. The age group with the highest labor force participation rate is 30 to 34 years, with 90.1% or 1,433 individuals in the labor force. Within the labor force, the 20 to 24 years age range has the highest percentage of unemployed individuals, with 7.8% or 68 of them being unemployed.
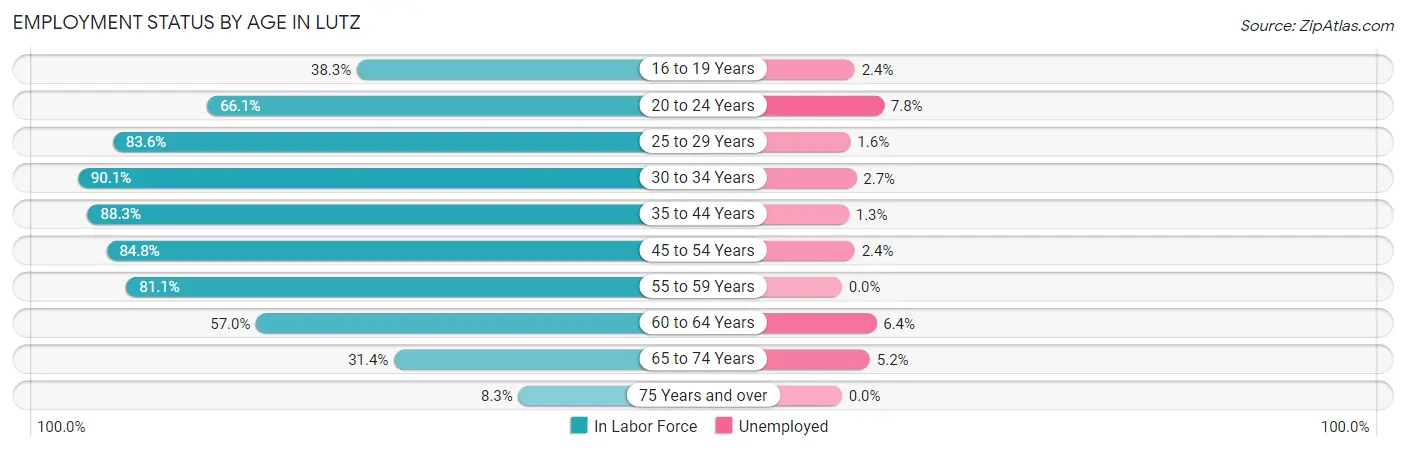
| Age Bracket | In Labor Force | Unemployed |
| 16 to 19 Years | 502 (38.3%) | 12 (2.4%) |
| 20 to 24 Years | 873 (66.1%) | 68 (7.8%) |
| 25 to 29 Years | 976 (83.6%) | 16 (1.6%) |
| 30 to 34 Years | 1,433 (90.1%) | 39 (2.7%) |
| 35 to 44 Years | 2,781 (88.3%) | 36 (1.3%) |
| 45 to 54 Years | 2,907 (84.8%) | 70 (2.4%) |
| 55 to 59 Years | 1,315 (81.1%) | 0 (0.0%) |
| 60 to 64 Years | 909 (57.0%) | 58 (6.4%) |
| 65 to 74 Years | 896 (31.4%) | 47 (5.2%) |
| 75 Years and over | 128 (8.3%) | 0 (0.0%) |
| Total | 12,725 (65.0%) | 344 (2.7%) |
Employment Status by Educational Attainment in Lutz
According to labor force statistics for Lutz, 82.2% of individuals (10,317) out of the total population between 25 and 64 years of age (12,551) are in the labor force, with 2.1% or 217 of them being unemployed. The group with the highest labor force participation rate are those with the educational attainment of bachelor's degree or higher, with 85.9% or 5,447 individuals in the labor force. Within the labor force, individuals with less than high school education have the highest percentage of unemployment, with 21.2% or 53 of them being unemployed.
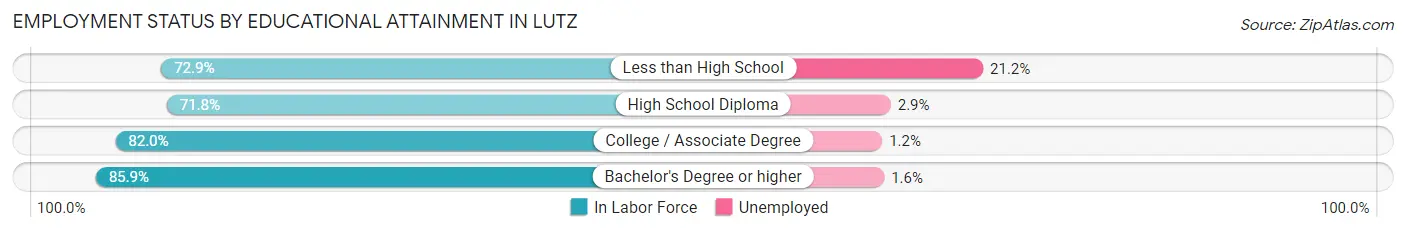
| Educational Attainment | In Labor Force | Unemployed |
| Less than High School | 250 (72.9%) | 73 (21.2%) |
| High School Diploma | 1,311 (71.8%) | 53 (2.9%) |
| College / Associate Degree | 3,314 (82.0%) | 48 (1.2%) |
| Bachelor's Degree or higher | 5,447 (85.9%) | 101 (1.6%) |
| Total | 10,317 (82.2%) | 264 (2.1%) |
Employment Occupations by Sex in Lutz
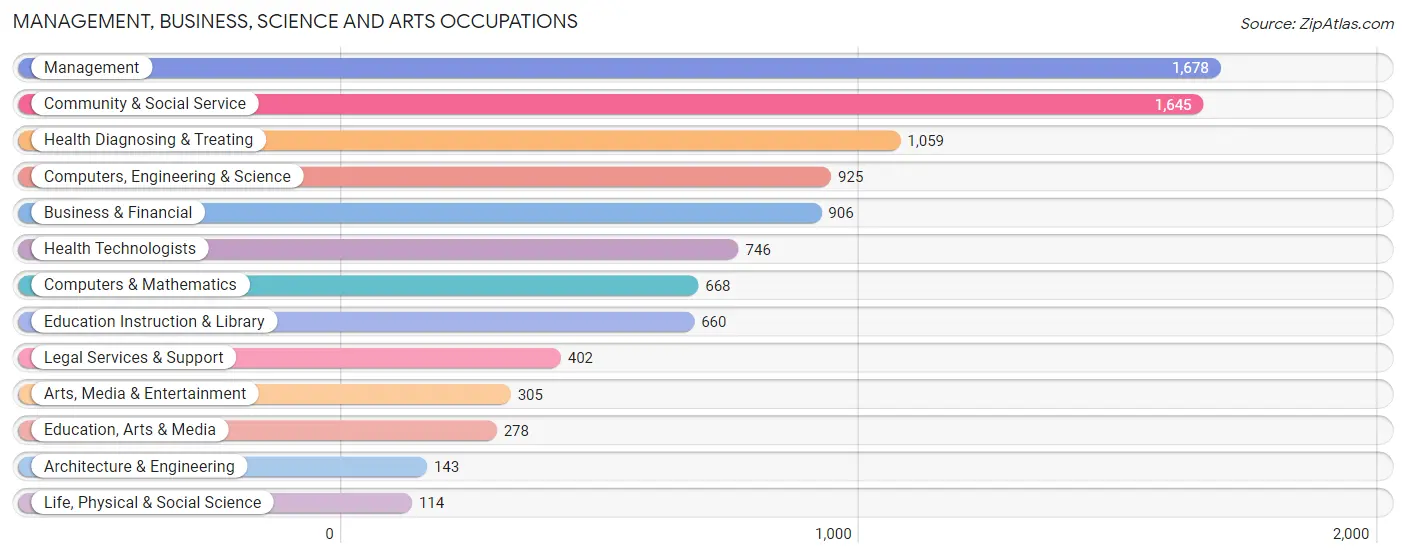
Management, Business, Science and Arts Occupations
The most common Management, Business, Science and Arts occupations in Lutz are Management (1,678 | 13.7%), Community & Social Service (1,645 | 13.4%), Health Diagnosing & Treating (1,059 | 8.6%), Computers, Engineering & Science (925 | 7.5%), and Business & Financial (906 | 7.4%).
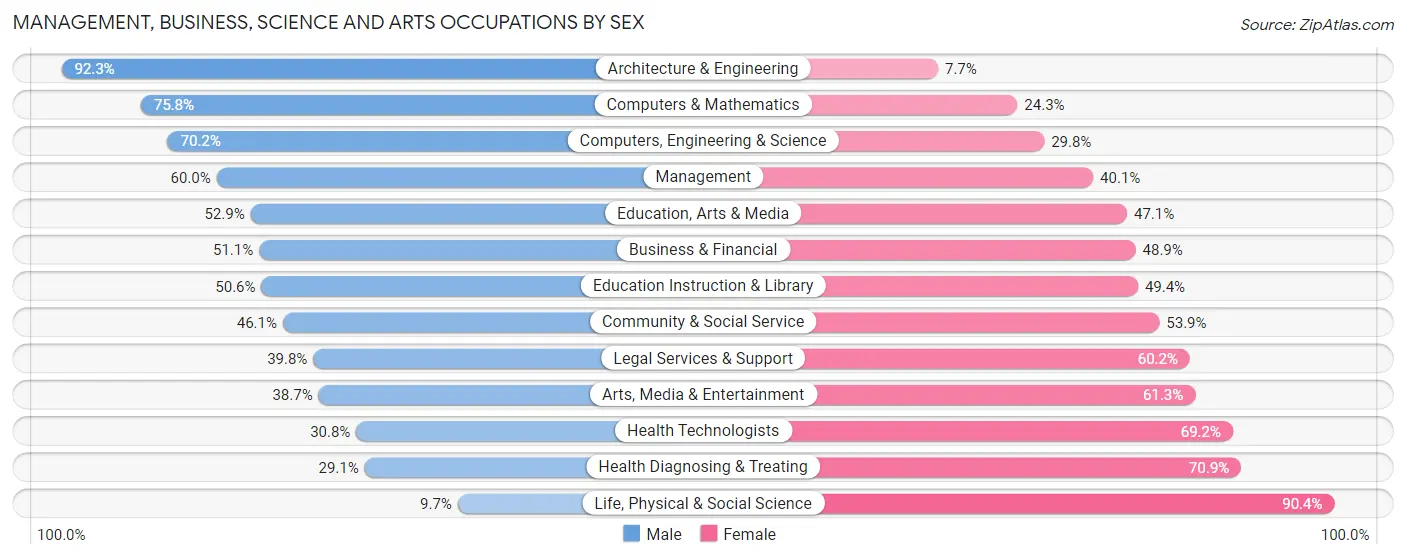
Management, Business, Science and Arts Occupations by Sex
Within the Management, Business, Science and Arts occupations in Lutz, the most male-oriented occupations are Architecture & Engineering (92.3%), Computers & Mathematics (75.7%), and Computers, Engineering & Science (70.2%), while the most female-oriented occupations are Life, Physical & Social Science (90.3%), Health Diagnosing & Treating (70.9%), and Health Technologists (69.2%).
| Occupation | Male | Female |
| Management | 1,006 (60.0%) | 672 (40.1%) |
| Business & Financial | 463 (51.1%) | 443 (48.9%) |
| Computers, Engineering & Science | 649 (70.2%) | 276 (29.8%) |
| Computers & Mathematics | 506 (75.7%) | 162 (24.2%) |
| Architecture & Engineering | 132 (92.3%) | 11 (7.7%) |
| Life, Physical & Social Science | 11 (9.7%) | 103 (90.3%) |
| Community & Social Service | 759 (46.1%) | 886 (53.9%) |
| Education, Arts & Media | 147 (52.9%) | 131 (47.1%) |
| Legal Services & Support | 160 (39.8%) | 242 (60.2%) |
| Education Instruction & Library | 334 (50.6%) | 326 (49.4%) |
| Arts, Media & Entertainment | 118 (38.7%) | 187 (61.3%) |
| Health Diagnosing & Treating | 308 (29.1%) | 751 (70.9%) |
| Health Technologists | 230 (30.8%) | 516 (69.2%) |
| Total (Category) | 3,185 (51.3%) | 3,028 (48.7%) |
| Total (Overall) | 6,549 (53.4%) | 5,703 (46.6%) |
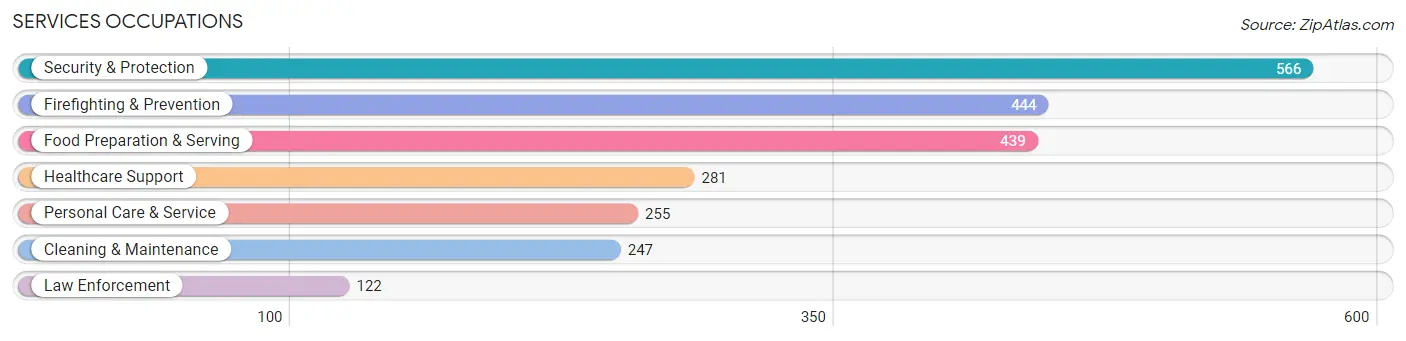
Services Occupations
The most common Services occupations in Lutz are Security & Protection (566 | 4.6%), Firefighting & Prevention (444 | 3.6%), Food Preparation & Serving (439 | 3.6%), Healthcare Support (281 | 2.3%), and Personal Care & Service (255 | 2.1%).
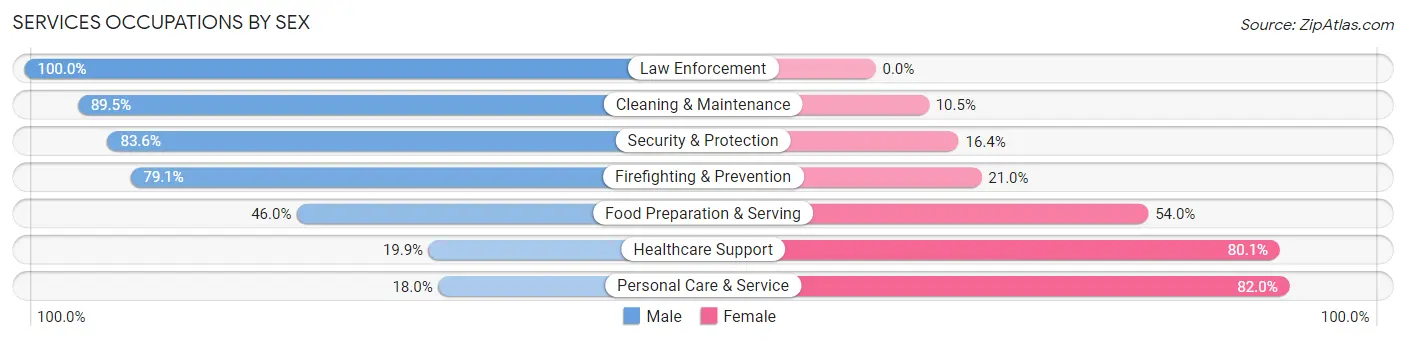
Services Occupations by Sex
Within the Services occupations in Lutz, the most male-oriented occupations are Law Enforcement (100.0%), Cleaning & Maintenance (89.5%), and Security & Protection (83.6%), while the most female-oriented occupations are Personal Care & Service (82.0%), Healthcare Support (80.1%), and Food Preparation & Serving (54.0%).
| Occupation | Male | Female |
| Healthcare Support | 56 (19.9%) | 225 (80.1%) |
| Security & Protection | 473 (83.6%) | 93 (16.4%) |
| Firefighting & Prevention | 351 (79.0%) | 93 (20.9%) |
| Law Enforcement | 122 (100.0%) | 0 (0.0%) |
| Food Preparation & Serving | 202 (46.0%) | 237 (54.0%) |
| Cleaning & Maintenance | 221 (89.5%) | 26 (10.5%) |
| Personal Care & Service | 46 (18.0%) | 209 (82.0%) |
| Total (Category) | 998 (55.8%) | 790 (44.2%) |
| Total (Overall) | 6,549 (53.4%) | 5,703 (46.6%) |
Sales and Office Occupations
The most common Sales and Office occupations in Lutz are Office & Administration (1,349 | 11.0%), and Sales & Related (1,181 | 9.6%).

Sales and Office Occupations by Sex

| Occupation | Male | Female |
| Sales & Related | 695 (58.9%) | 486 (41.1%) |
| Office & Administration | 360 (26.7%) | 989 (73.3%) |
| Total (Category) | 1,055 (41.7%) | 1,475 (58.3%) |
| Total (Overall) | 6,549 (53.4%) | 5,703 (46.6%) |
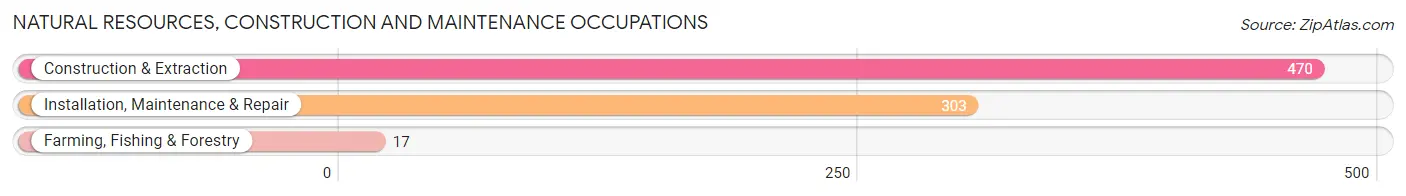
Natural Resources, Construction and Maintenance Occupations
The most common Natural Resources, Construction and Maintenance occupations in Lutz are Construction & Extraction (470 | 3.8%), Installation, Maintenance & Repair (303 | 2.5%), and Farming, Fishing & Forestry (17 | 0.1%).
Natural Resources, Construction and Maintenance Occupations by Sex
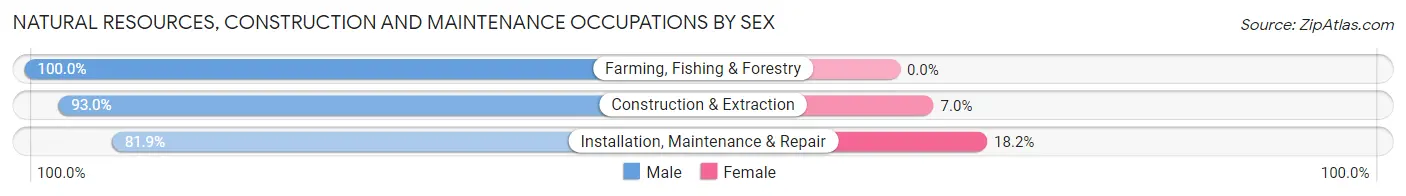
| Occupation | Male | Female |
| Farming, Fishing & Forestry | 17 (100.0%) | 0 (0.0%) |
| Construction & Extraction | 437 (93.0%) | 33 (7.0%) |
| Installation, Maintenance & Repair | 248 (81.9%) | 55 (18.1%) |
| Total (Category) | 702 (88.9%) | 88 (11.1%) |
| Total (Overall) | 6,549 (53.4%) | 5,703 (46.6%) |
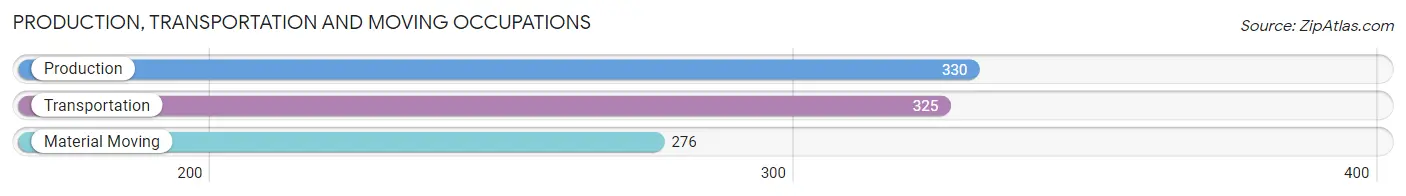
Production, Transportation and Moving Occupations
The most common Production, Transportation and Moving occupations in Lutz are Production (330 | 2.7%), Transportation (325 | 2.6%), and Material Moving (276 | 2.2%).
Production, Transportation and Moving Occupations by Sex
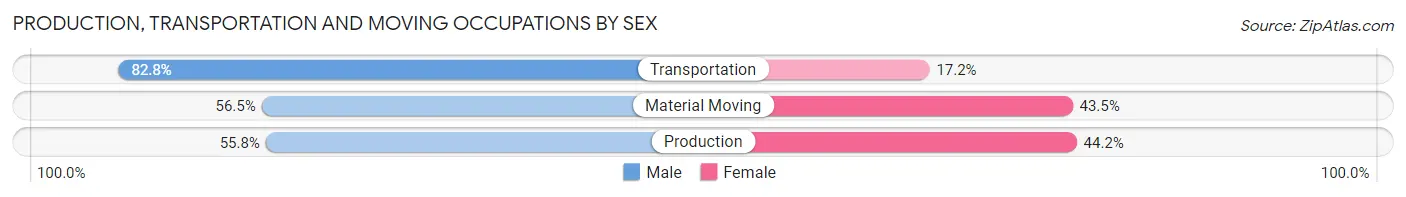
| Occupation | Male | Female |
| Production | 184 (55.8%) | 146 (44.2%) |
| Transportation | 269 (82.8%) | 56 (17.2%) |
| Material Moving | 156 (56.5%) | 120 (43.5%) |
| Total (Category) | 609 (65.4%) | 322 (34.6%) |
| Total (Overall) | 6,549 (53.4%) | 5,703 (46.6%) |
Employment Industries by Sex in Lutz
Employment Industries in Lutz
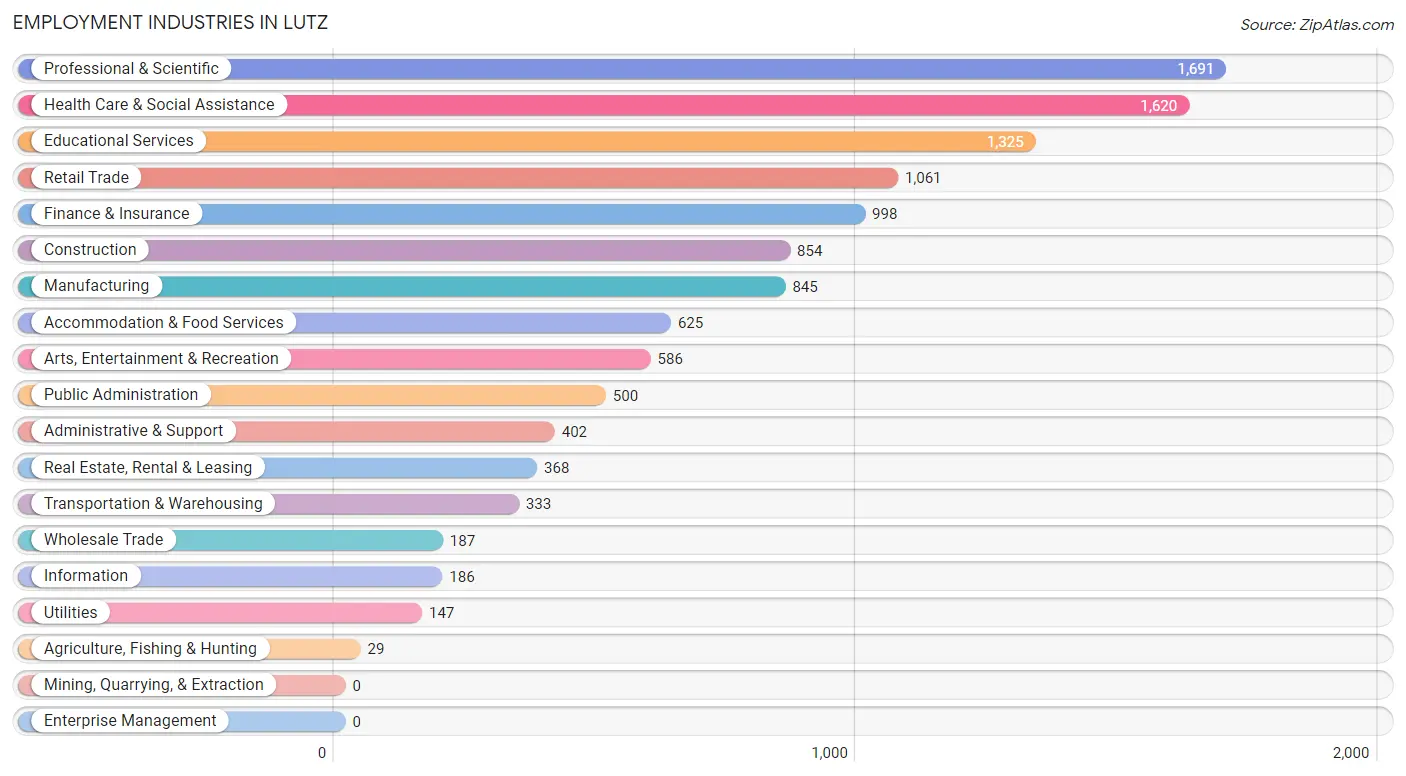
The major employment industries in Lutz include Professional & Scientific (1,691 | 13.8%), Health Care & Social Assistance (1,620 | 13.2%), Educational Services (1,325 | 10.8%), Retail Trade (1,061 | 8.7%), and Finance & Insurance (998 | 8.2%).
Employment Industries by Sex in Lutz
The Lutz industries that see more men than women are Agriculture, Fishing & Hunting (100.0%), Utilities (77.5%), and Administrative & Support (76.6%), whereas the industries that tend to have a higher number of women are Health Care & Social Assistance (66.2%), Educational Services (64.7%), and Real Estate, Rental & Leasing (62.5%).
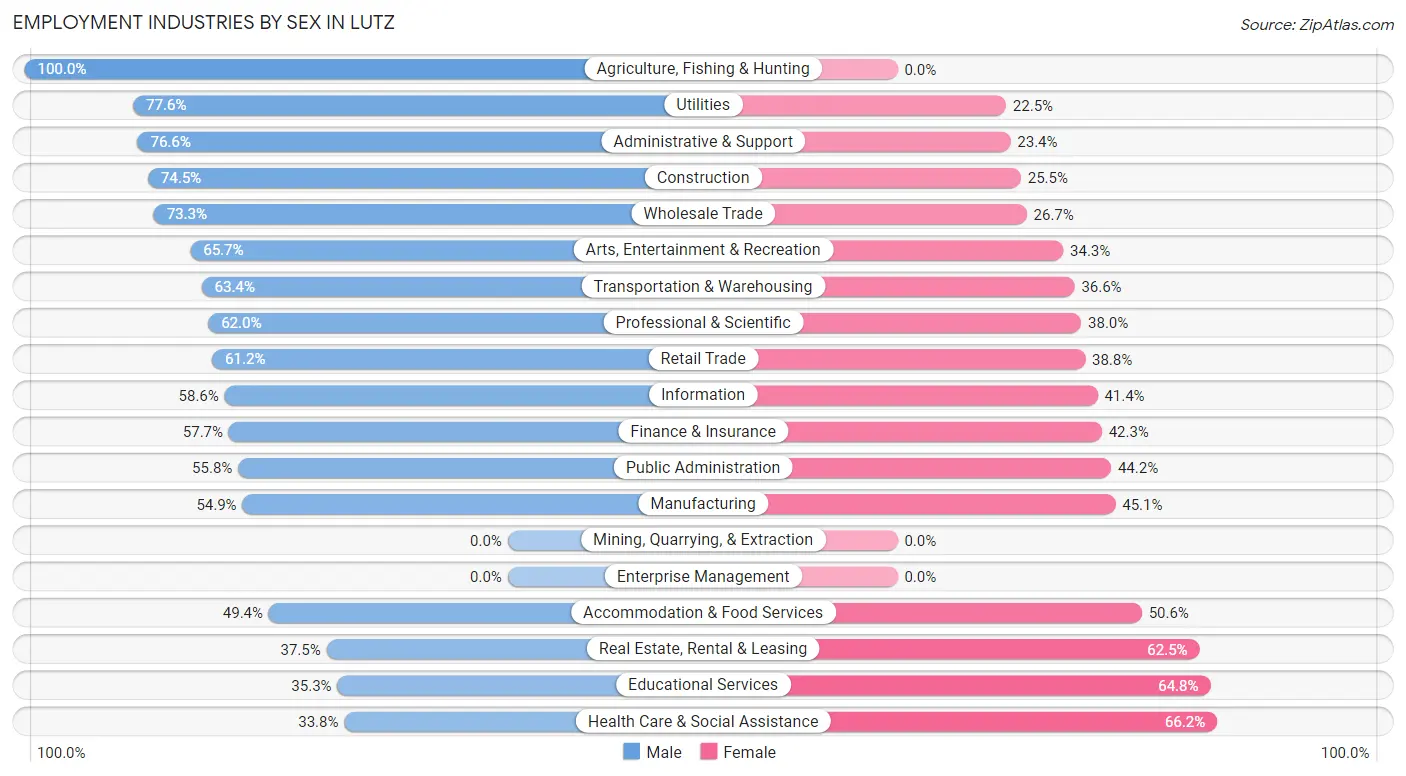
| Industry | Male | Female |
| Agriculture, Fishing & Hunting | 29 (100.0%) | 0 (0.0%) |
| Mining, Quarrying, & Extraction | 0 (0.0%) | 0 (0.0%) |
| Construction | 636 (74.5%) | 218 (25.5%) |
| Manufacturing | 464 (54.9%) | 381 (45.1%) |
| Wholesale Trade | 137 (73.3%) | 50 (26.7%) |
| Retail Trade | 649 (61.2%) | 412 (38.8%) |
| Transportation & Warehousing | 211 (63.4%) | 122 (36.6%) |
| Utilities | 114 (77.5%) | 33 (22.5%) |
| Information | 109 (58.6%) | 77 (41.4%) |
| Finance & Insurance | 576 (57.7%) | 422 (42.3%) |
| Real Estate, Rental & Leasing | 138 (37.5%) | 230 (62.5%) |
| Professional & Scientific | 1,048 (62.0%) | 643 (38.0%) |
| Enterprise Management | 0 (0.0%) | 0 (0.0%) |
| Administrative & Support | 308 (76.6%) | 94 (23.4%) |
| Educational Services | 467 (35.2%) | 858 (64.7%) |
| Health Care & Social Assistance | 548 (33.8%) | 1,072 (66.2%) |
| Arts, Entertainment & Recreation | 385 (65.7%) | 201 (34.3%) |
| Accommodation & Food Services | 309 (49.4%) | 316 (50.6%) |
| Public Administration | 279 (55.8%) | 221 (44.2%) |
| Total | 6,549 (53.4%) | 5,703 (46.6%) |
Education in Lutz
School Enrollment in Lutz
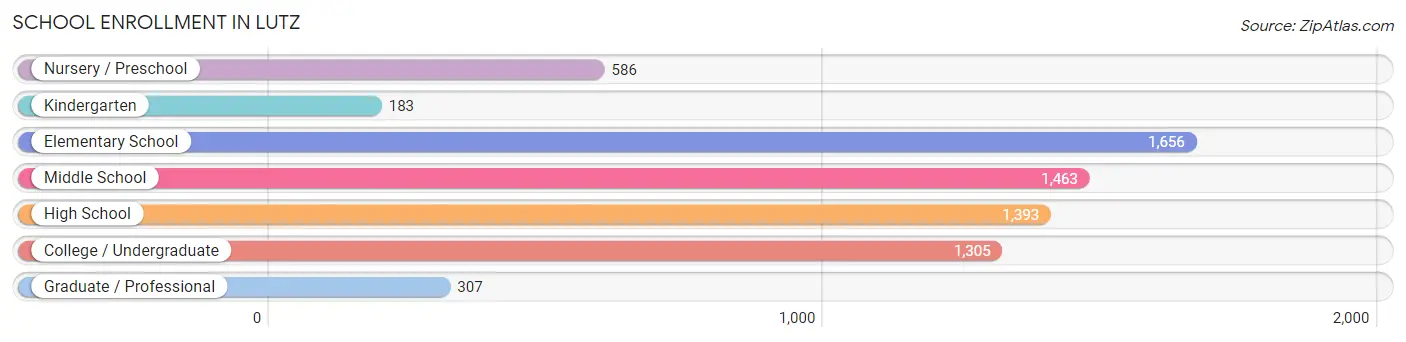
The most common levels of schooling among the 6,893 students in Lutz are elementary school (1,656 | 24.0%), middle school (1,463 | 21.2%), and high school (1,393 | 20.2%).
| School Level | # Students | % Students |
| Nursery / Preschool | 586 | 8.5% |
| Kindergarten | 183 | 2.6% |
| Elementary School | 1,656 | 24.0% |
| Middle School | 1,463 | 21.2% |
| High School | 1,393 | 20.2% |
| College / Undergraduate | 1,305 | 18.9% |
| Graduate / Professional | 307 | 4.4% |
| Total | 6,893 | 100.0% |
School Enrollment by Age by Funding Source in Lutz
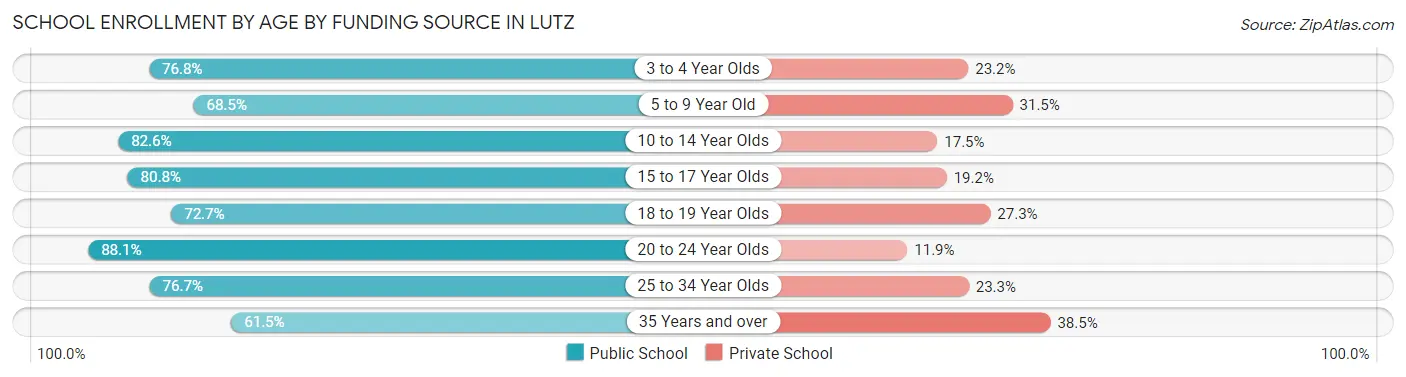
Out of a total of 6,893 students who are enrolled in schools in Lutz, 1,585 (23.0%) attend a private institution, while the remaining 5,308 (77.0%) are enrolled in public schools. The age group of 35 years and over has the highest likelihood of being enrolled in private schools, with 109 (38.5% in the age bracket) enrolled. Conversely, the age group of 20 to 24 year olds has the lowest likelihood of being enrolled in a private school, with 587 (88.1% in the age bracket) attending a public institution.
| Age Bracket | Public School | Private School |
| 3 to 4 Year Olds | 397 (76.8%) | 120 (23.2%) |
| 5 to 9 Year Old | 1,204 (68.5%) | 553 (31.5%) |
| 10 to 14 Year Olds | 1,367 (82.6%) | 289 (17.4%) |
| 15 to 17 Year Olds | 964 (80.8%) | 229 (19.2%) |
| 18 to 19 Year Olds | 319 (72.7%) | 120 (27.3%) |
| 20 to 24 Year Olds | 587 (88.1%) | 79 (11.9%) |
| 25 to 34 Year Olds | 293 (76.7%) | 89 (23.3%) |
| 35 Years and over | 174 (61.5%) | 109 (38.5%) |
| Total | 5,308 (77.0%) | 1,585 (23.0%) |
Educational Attainment by Field of Study in Lutz
Business (2,028 | 22.4%), social sciences (1,112 | 12.3%), science & technology (820 | 9.0%), engineering (787 | 8.7%), and education (738 | 8.1%) are the most common fields of study among 9,070 individuals in Lutz who have obtained a bachelor's degree or higher.
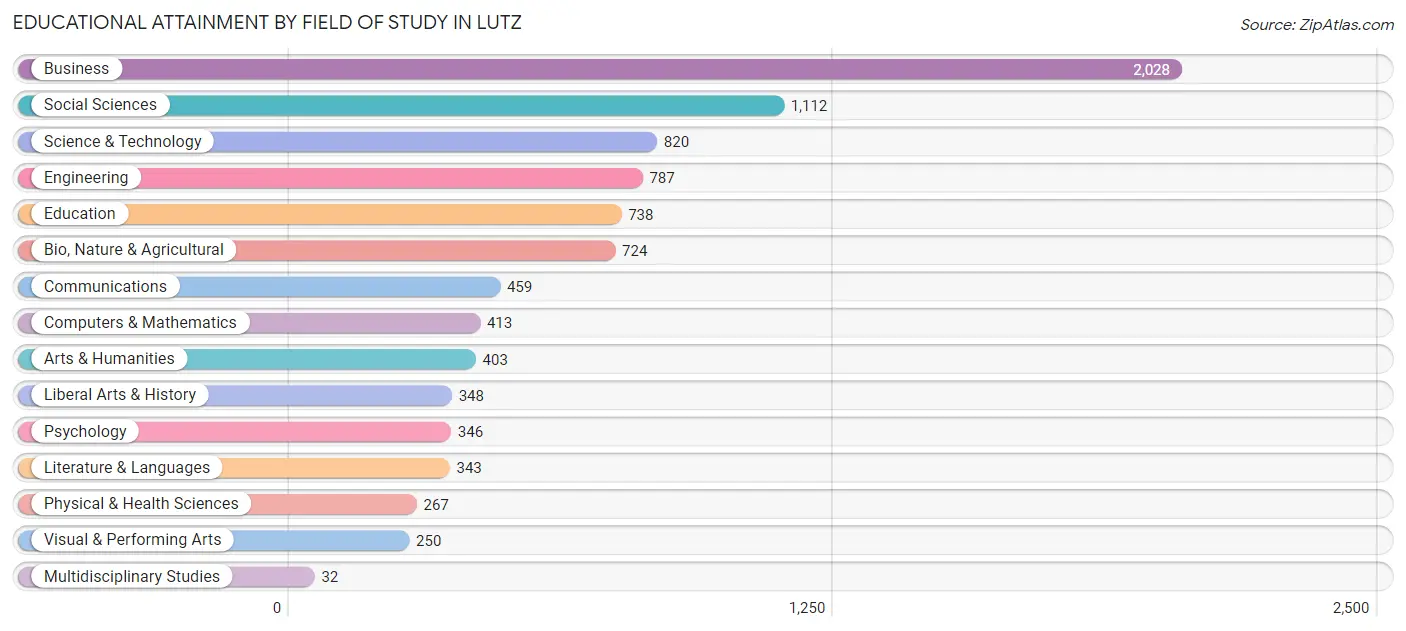
| Field of Study | # Graduates | % Graduates |
| Computers & Mathematics | 413 | 4.5% |
| Bio, Nature & Agricultural | 724 | 8.0% |
| Physical & Health Sciences | 267 | 2.9% |
| Psychology | 346 | 3.8% |
| Social Sciences | 1,112 | 12.3% |
| Engineering | 787 | 8.7% |
| Multidisciplinary Studies | 32 | 0.4% |
| Science & Technology | 820 | 9.0% |
| Business | 2,028 | 22.4% |
| Education | 738 | 8.1% |
| Literature & Languages | 343 | 3.8% |
| Liberal Arts & History | 348 | 3.8% |
| Visual & Performing Arts | 250 | 2.8% |
| Communications | 459 | 5.1% |
| Arts & Humanities | 403 | 4.4% |
| Total | 9,070 | 100.0% |
Transportation & Commute in Lutz
Vehicle Availability by Sex in Lutz
The most prevalent vehicle ownership categories in Lutz are males with 2 vehicles (3,405, accounting for 53.2%) and females with 2 vehicles (2,735, making up 60.1%).
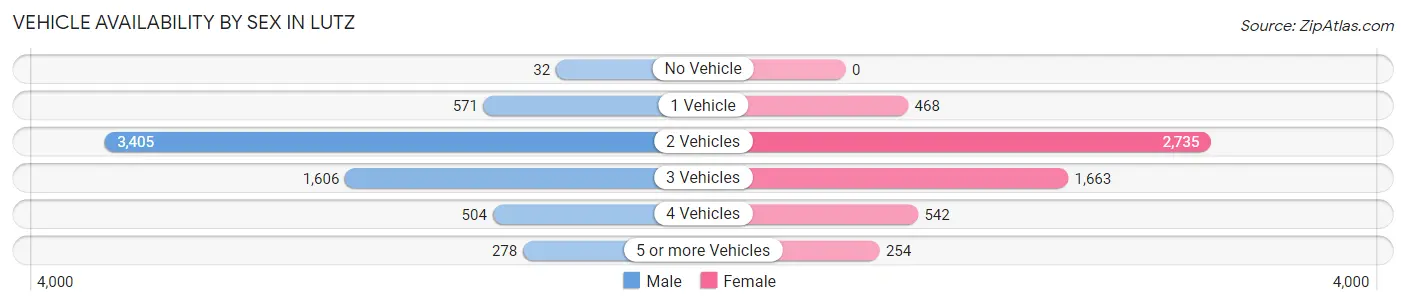
| Vehicles Available | Male | Female |
| No Vehicle | 32 (0.5%) | 0 (0.0%) |
| 1 Vehicle | 571 (8.9%) | 468 (8.3%) |
| 2 Vehicles | 3,405 (53.2%) | 2,735 (48.3%) |
| 3 Vehicles | 1,606 (25.1%) | 1,663 (29.4%) |
| 4 Vehicles | 504 (7.9%) | 542 (9.6%) |
| 5 or more Vehicles | 278 (4.3%) | 254 (4.5%) |
| Total | 6,396 (100.0%) | 5,662 (100.0%) |
Commute Time in Lutz
The most frequently occuring commute durations in Lutz are 30 to 34 minutes (1,934 commuters, 19.8%), 20 to 24 minutes (1,655 commuters, 16.9%), and 45 to 59 minutes (1,249 commuters, 12.8%).
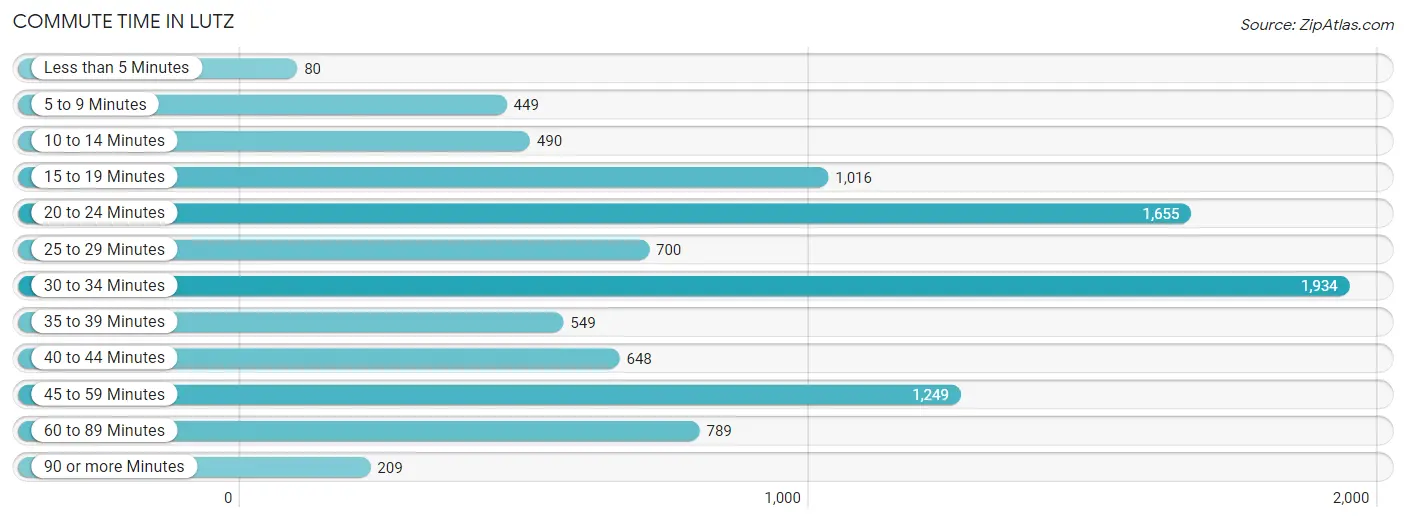
| Commute Time | # Commuters | % Commuters |
| Less than 5 Minutes | 80 | 0.8% |
| 5 to 9 Minutes | 449 | 4.6% |
| 10 to 14 Minutes | 490 | 5.0% |
| 15 to 19 Minutes | 1,016 | 10.4% |
| 20 to 24 Minutes | 1,655 | 16.9% |
| 25 to 29 Minutes | 700 | 7.2% |
| 30 to 34 Minutes | 1,934 | 19.8% |
| 35 to 39 Minutes | 549 | 5.6% |
| 40 to 44 Minutes | 648 | 6.6% |
| 45 to 59 Minutes | 1,249 | 12.8% |
| 60 to 89 Minutes | 789 | 8.1% |
| 90 or more Minutes | 209 | 2.1% |
Commute Time by Sex in Lutz
The most common commute times in Lutz are 30 to 34 minutes (1,148 commuters, 21.9%) for males and 30 to 34 minutes (786 commuters, 17.4%) for females.
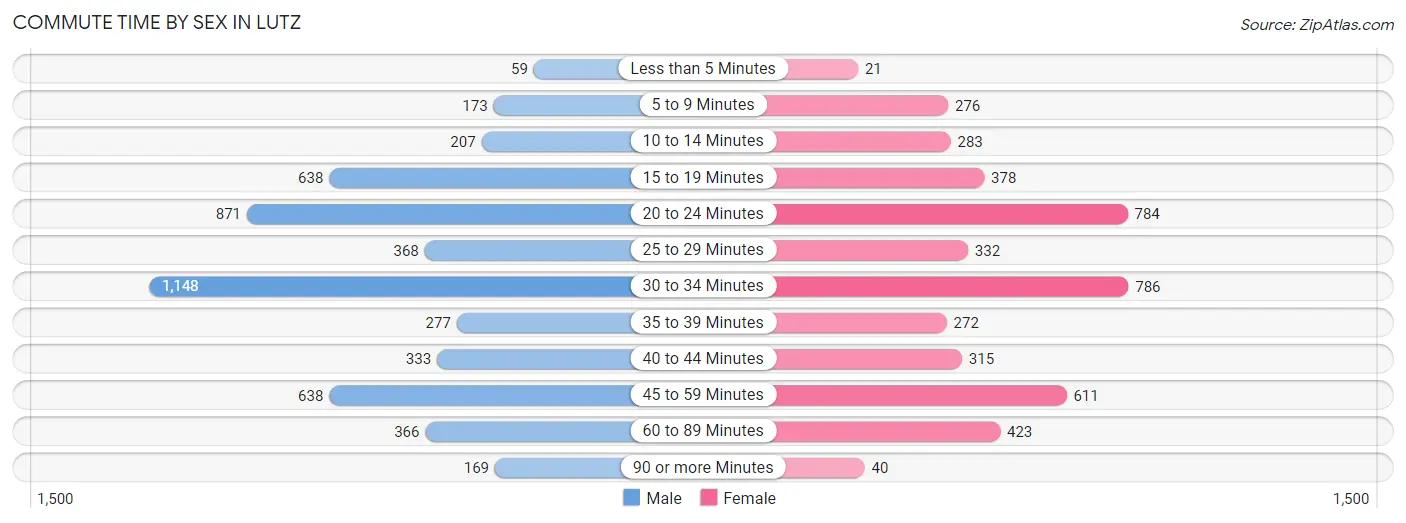
| Commute Time | Male | Female |
| Less than 5 Minutes | 59 (1.1%) | 21 (0.5%) |
| 5 to 9 Minutes | 173 (3.3%) | 276 (6.1%) |
| 10 to 14 Minutes | 207 (4.0%) | 283 (6.3%) |
| 15 to 19 Minutes | 638 (12.2%) | 378 (8.4%) |
| 20 to 24 Minutes | 871 (16.6%) | 784 (17.3%) |
| 25 to 29 Minutes | 368 (7.0%) | 332 (7.3%) |
| 30 to 34 Minutes | 1,148 (21.9%) | 786 (17.4%) |
| 35 to 39 Minutes | 277 (5.3%) | 272 (6.0%) |
| 40 to 44 Minutes | 333 (6.4%) | 315 (7.0%) |
| 45 to 59 Minutes | 638 (12.2%) | 611 (13.5%) |
| 60 to 89 Minutes | 366 (7.0%) | 423 (9.4%) |
| 90 or more Minutes | 169 (3.2%) | 40 (0.9%) |
Time of Departure to Work by Sex in Lutz
The most frequent times of departure to work in Lutz are 6:00 AM to 6:29 AM (851, 16.2%) for males and 7:00 AM to 7:29 AM (1,096, 24.2%) for females.
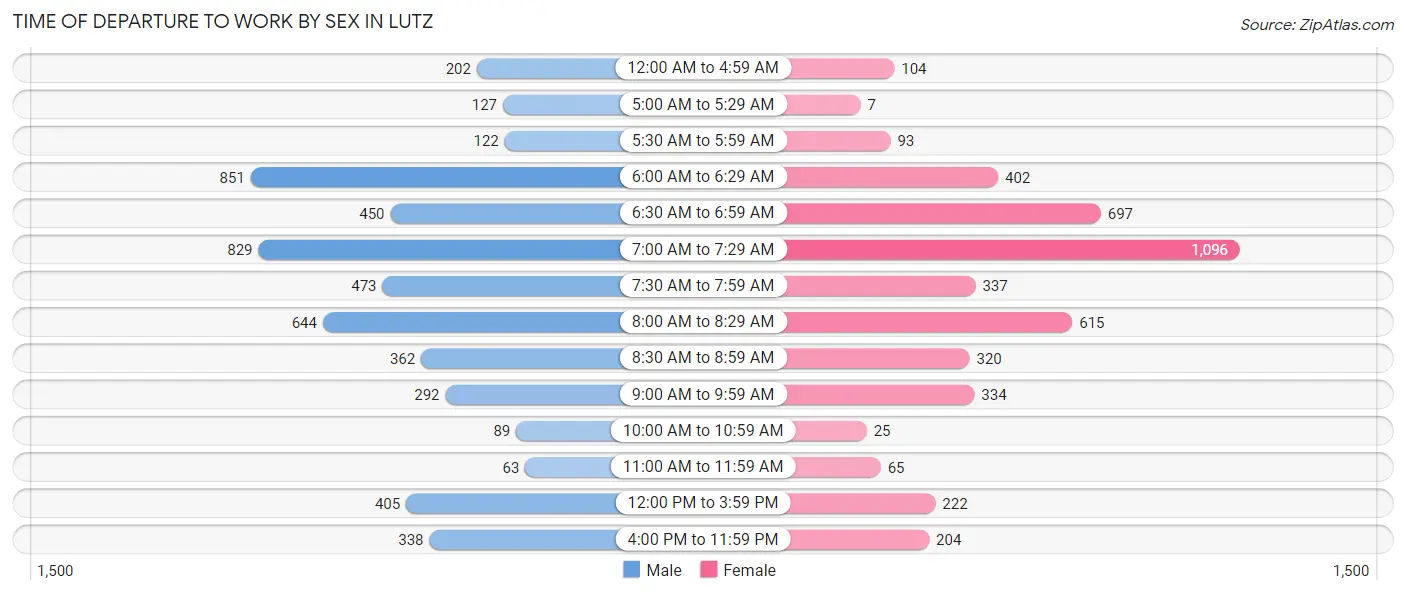
| Time of Departure | Male | Female |
| 12:00 AM to 4:59 AM | 202 (3.8%) | 104 (2.3%) |
| 5:00 AM to 5:29 AM | 127 (2.4%) | 7 (0.2%) |
| 5:30 AM to 5:59 AM | 122 (2.3%) | 93 (2.1%) |
| 6:00 AM to 6:29 AM | 851 (16.2%) | 402 (8.9%) |
| 6:30 AM to 6:59 AM | 450 (8.6%) | 697 (15.4%) |
| 7:00 AM to 7:29 AM | 829 (15.8%) | 1,096 (24.2%) |
| 7:30 AM to 7:59 AM | 473 (9.0%) | 337 (7.4%) |
| 8:00 AM to 8:29 AM | 644 (12.3%) | 615 (13.6%) |
| 8:30 AM to 8:59 AM | 362 (6.9%) | 320 (7.1%) |
| 9:00 AM to 9:59 AM | 292 (5.6%) | 334 (7.4%) |
| 10:00 AM to 10:59 AM | 89 (1.7%) | 25 (0.5%) |
| 11:00 AM to 11:59 AM | 63 (1.2%) | 65 (1.4%) |
| 12:00 PM to 3:59 PM | 405 (7.7%) | 222 (4.9%) |
| 4:00 PM to 11:59 PM | 338 (6.4%) | 204 (4.5%) |
| Total | 5,247 (100.0%) | 4,521 (100.0%) |
Housing Occupancy in Lutz
Occupancy by Ownership in Lutz
Of the total 9,041 dwellings in Lutz, owner-occupied units account for 7,473 (82.7%), while renter-occupied units make up 1,568 (17.3%).
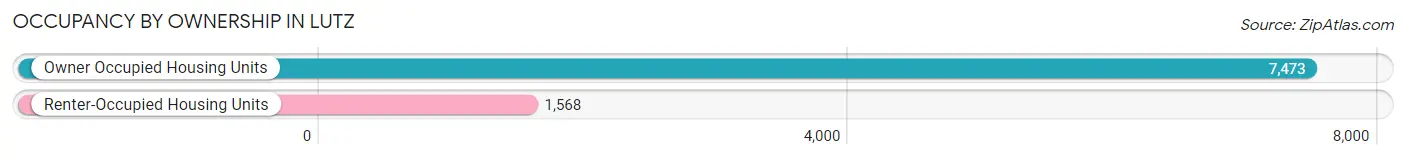
| Occupancy | # Housing Units | % Housing Units |
| Owner Occupied Housing Units | 7,473 | 82.7% |
| Renter-Occupied Housing Units | 1,568 | 17.3% |
| Total Occupied Housing Units | 9,041 | 100.0% |
Occupancy by Household Size in Lutz
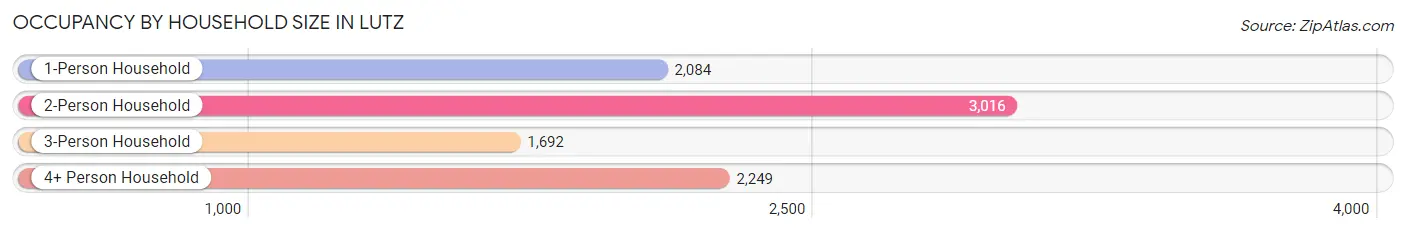
| Household Size | # Housing Units | % Housing Units |
| 1-Person Household | 2,084 | 23.1% |
| 2-Person Household | 3,016 | 33.4% |
| 3-Person Household | 1,692 | 18.7% |
| 4+ Person Household | 2,249 | 24.9% |
| Total Housing Units | 9,041 | 100.0% |
Occupancy by Ownership by Household Size in Lutz
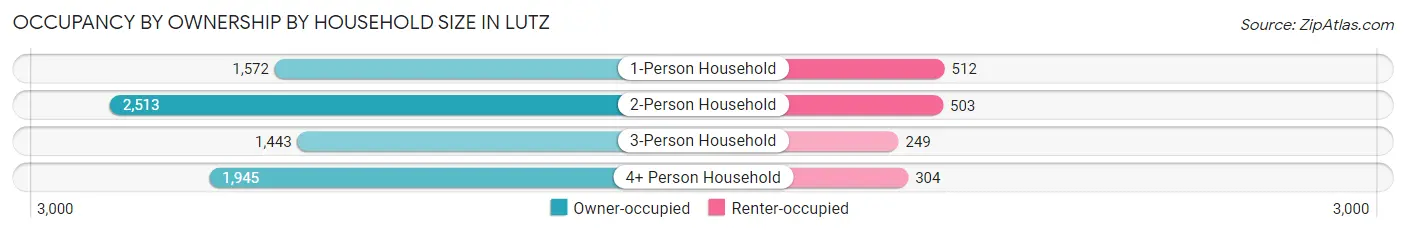
| Household Size | Owner-occupied | Renter-occupied |
| 1-Person Household | 1,572 (75.4%) | 512 (24.6%) |
| 2-Person Household | 2,513 (83.3%) | 503 (16.7%) |
| 3-Person Household | 1,443 (85.3%) | 249 (14.7%) |
| 4+ Person Household | 1,945 (86.5%) | 304 (13.5%) |
| Total Housing Units | 7,473 (82.7%) | 1,568 (17.3%) |
Occupancy by Educational Attainment in Lutz
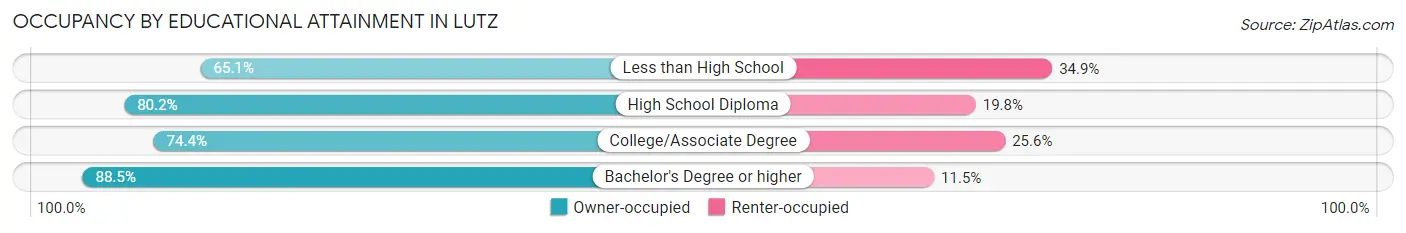
| Household Size | Owner-occupied | Renter-occupied |
| Less than High School | 125 (65.1%) | 67 (34.9%) |
| High School Diploma | 1,117 (80.2%) | 275 (19.8%) |
| College/Associate Degree | 1,945 (74.4%) | 669 (25.6%) |
| Bachelor's Degree or higher | 4,286 (88.5%) | 557 (11.5%) |
Occupancy by Age of Householder in Lutz
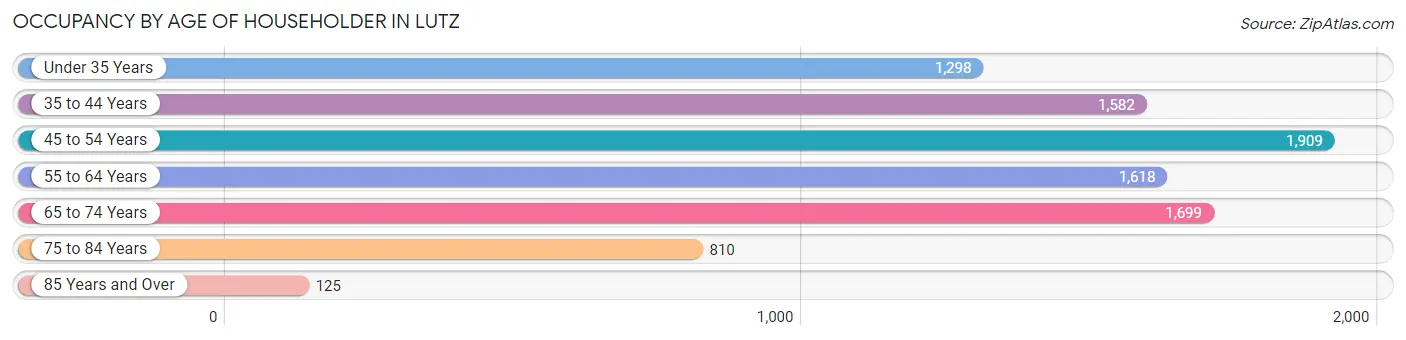
| Age Bracket | # Households | % Households |
| Under 35 Years | 1,298 | 14.4% |
| 35 to 44 Years | 1,582 | 17.5% |
| 45 to 54 Years | 1,909 | 21.1% |
| 55 to 64 Years | 1,618 | 17.9% |
| 65 to 74 Years | 1,699 | 18.8% |
| 75 to 84 Years | 810 | 9.0% |
| 85 Years and Over | 125 | 1.4% |
| Total | 9,041 | 100.0% |
Housing Finances in Lutz
Median Income by Occupancy in Lutz
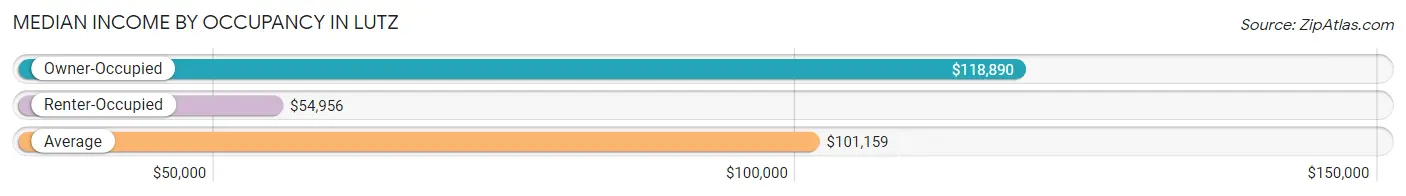
| Occupancy Type | # Households | Median Income |
| Owner-Occupied | 7,473 (82.7%) | $118,890 |
| Renter-Occupied | 1,568 (17.3%) | $54,956 |
| Average | 9,041 (100.0%) | $101,159 |
Occupancy by Householder Income Bracket in Lutz
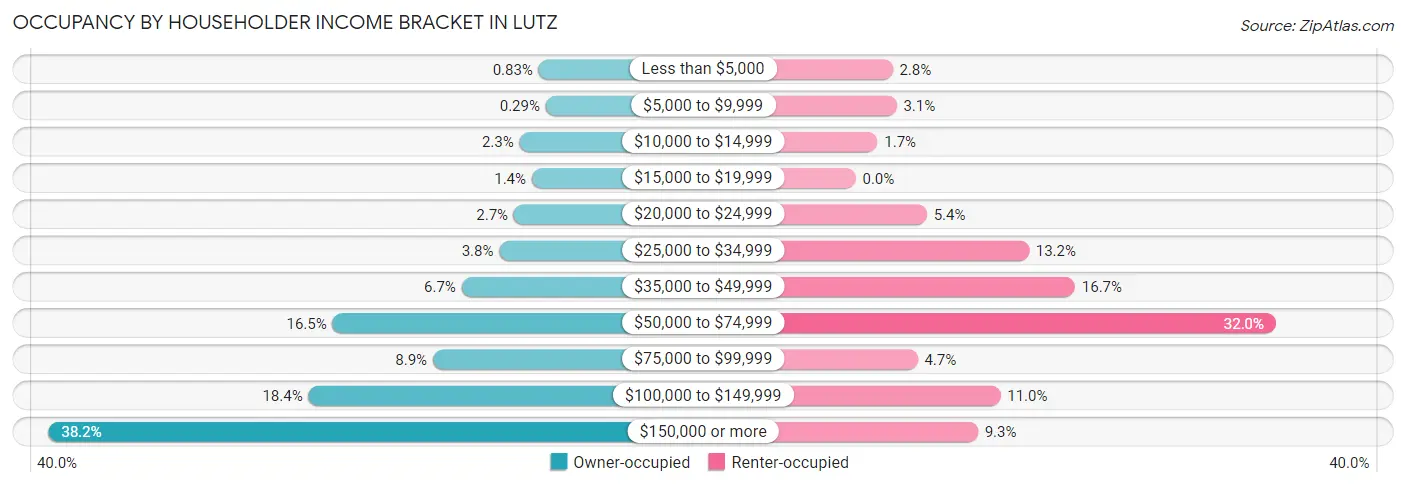
| Income Bracket | Owner-occupied | Renter-occupied |
| Less than $5,000 | 62 (0.8%) | 44 (2.8%) |
| $5,000 to $9,999 | 22 (0.3%) | 49 (3.1%) |
| $10,000 to $14,999 | 171 (2.3%) | 26 (1.7%) |
| $15,000 to $19,999 | 101 (1.3%) | 0 (0.0%) |
| $20,000 to $24,999 | 203 (2.7%) | 85 (5.4%) |
| $25,000 to $34,999 | 286 (3.8%) | 207 (13.2%) |
| $35,000 to $49,999 | 501 (6.7%) | 262 (16.7%) |
| $50,000 to $74,999 | 1,236 (16.5%) | 502 (32.0%) |
| $75,000 to $99,999 | 664 (8.9%) | 74 (4.7%) |
| $100,000 to $149,999 | 1,373 (18.4%) | 173 (11.0%) |
| $150,000 or more | 2,854 (38.2%) | 146 (9.3%) |
| Total | 7,473 (100.0%) | 1,568 (100.0%) |
Monthly Housing Cost Tiers in Lutz
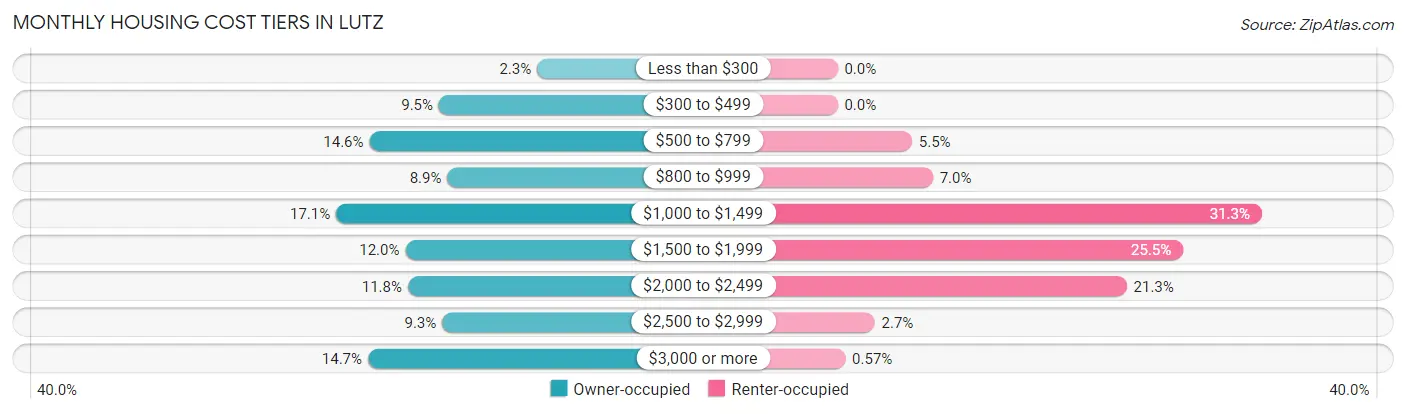
| Monthly Cost | Owner-occupied | Renter-occupied |
| Less than $300 | 169 (2.3%) | 0 (0.0%) |
| $300 to $499 | 709 (9.5%) | 0 (0.0%) |
| $500 to $799 | 1,092 (14.6%) | 86 (5.5%) |
| $800 to $999 | 663 (8.9%) | 110 (7.0%) |
| $1,000 to $1,499 | 1,275 (17.1%) | 490 (31.2%) |
| $1,500 to $1,999 | 894 (12.0%) | 399 (25.5%) |
| $2,000 to $2,499 | 880 (11.8%) | 334 (21.3%) |
| $2,500 to $2,999 | 691 (9.2%) | 43 (2.7%) |
| $3,000 or more | 1,100 (14.7%) | 9 (0.6%) |
| Total | 7,473 (100.0%) | 1,568 (100.0%) |
Physical Housing Characteristics in Lutz
Housing Structures in Lutz
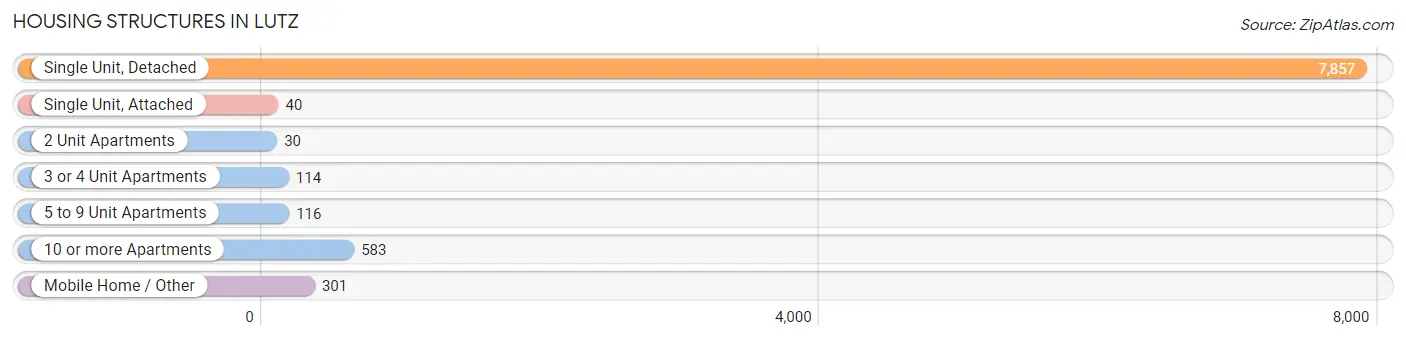
| Structure Type | # Housing Units | % Housing Units |
| Single Unit, Detached | 7,857 | 86.9% |
| Single Unit, Attached | 40 | 0.4% |
| 2 Unit Apartments | 30 | 0.3% |
| 3 or 4 Unit Apartments | 114 | 1.3% |
| 5 to 9 Unit Apartments | 116 | 1.3% |
| 10 or more Apartments | 583 | 6.5% |
| Mobile Home / Other | 301 | 3.3% |
| Total | 9,041 | 100.0% |
Housing Structures by Occupancy in Lutz
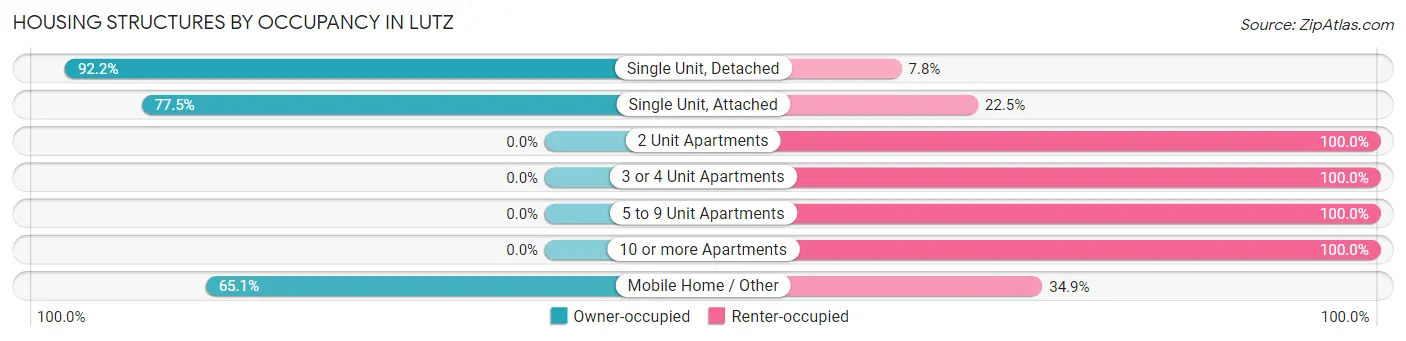
| Structure Type | Owner-occupied | Renter-occupied |
| Single Unit, Detached | 7,246 (92.2%) | 611 (7.8%) |
| Single Unit, Attached | 31 (77.5%) | 9 (22.5%) |
| 2 Unit Apartments | 0 (0.0%) | 30 (100.0%) |
| 3 or 4 Unit Apartments | 0 (0.0%) | 114 (100.0%) |
| 5 to 9 Unit Apartments | 0 (0.0%) | 116 (100.0%) |
| 10 or more Apartments | 0 (0.0%) | 583 (100.0%) |
| Mobile Home / Other | 196 (65.1%) | 105 (34.9%) |
| Total | 7,473 (82.7%) | 1,568 (17.3%) |
Housing Structures by Number of Rooms in Lutz
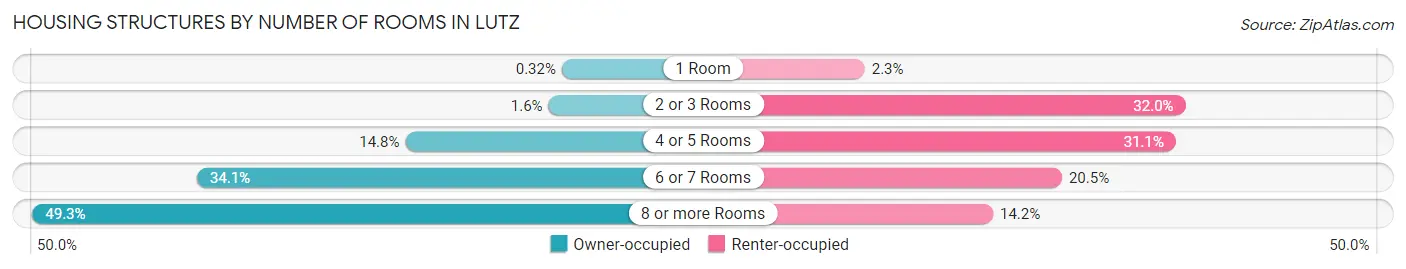
| Number of Rooms | Owner-occupied | Renter-occupied |
| 1 Room | 24 (0.3%) | 36 (2.3%) |
| 2 or 3 Rooms | 116 (1.5%) | 501 (32.0%) |
| 4 or 5 Rooms | 1,105 (14.8%) | 487 (31.1%) |
| 6 or 7 Rooms | 2,545 (34.1%) | 322 (20.5%) |
| 8 or more Rooms | 3,683 (49.3%) | 222 (14.2%) |
| Total | 7,473 (100.0%) | 1,568 (100.0%) |
Housing Structure by Heating Type in Lutz
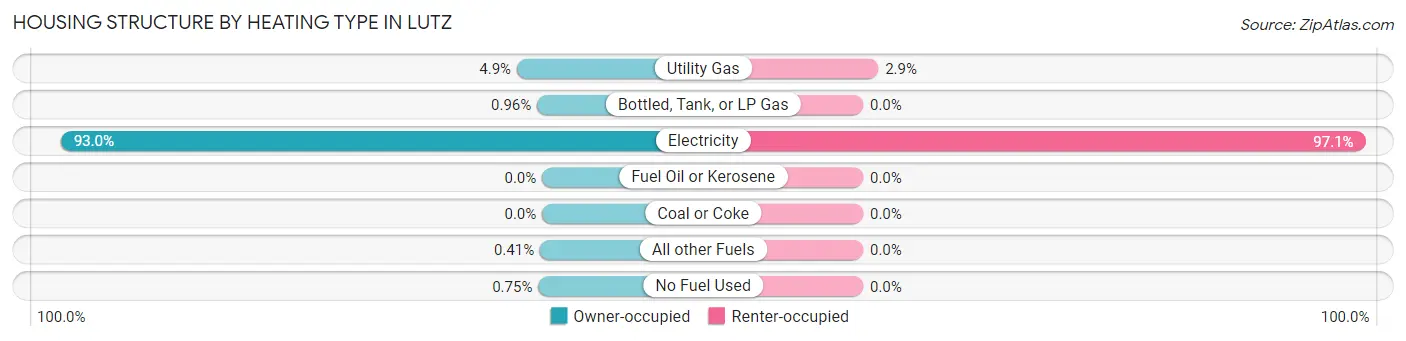
| Heating Type | Owner-occupied | Renter-occupied |
| Utility Gas | 363 (4.9%) | 46 (2.9%) |
| Bottled, Tank, or LP Gas | 72 (1.0%) | 0 (0.0%) |
| Electricity | 6,951 (93.0%) | 1,522 (97.1%) |
| Fuel Oil or Kerosene | 0 (0.0%) | 0 (0.0%) |
| Coal or Coke | 0 (0.0%) | 0 (0.0%) |
| All other Fuels | 31 (0.4%) | 0 (0.0%) |
| No Fuel Used | 56 (0.7%) | 0 (0.0%) |
| Total | 7,473 (100.0%) | 1,568 (100.0%) |
Household Vehicle Usage in Lutz
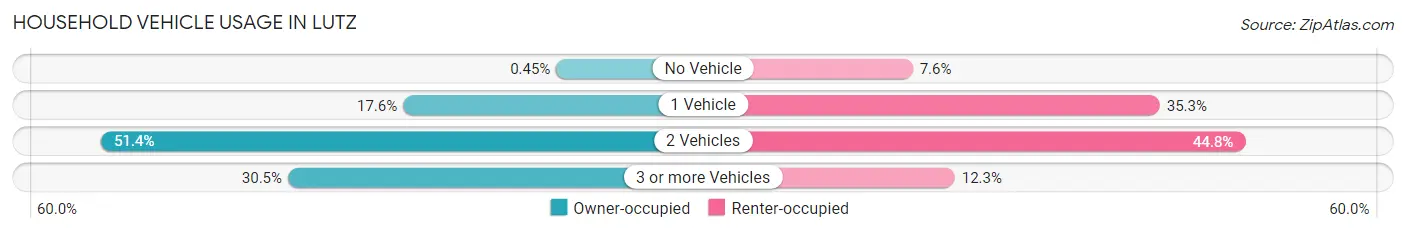
| Vehicles per Household | Owner-occupied | Renter-occupied |
| No Vehicle | 34 (0.4%) | 119 (7.6%) |
| 1 Vehicle | 1,316 (17.6%) | 553 (35.3%) |
| 2 Vehicles | 3,843 (51.4%) | 703 (44.8%) |
| 3 or more Vehicles | 2,280 (30.5%) | 193 (12.3%) |
| Total | 7,473 (100.0%) | 1,568 (100.0%) |
Real Estate & Mortgages in Lutz
Real Estate and Mortgage Overview in Lutz
| Characteristic | Without Mortgage | With Mortgage |
| Housing Units | 2,784 | 4,689 |
| Median Property Value | $385,300 | $413,300 |
| Median Household Income | $88,269 | $1,912 |
| Monthly Housing Costs | $667 | $1,083 |
| Real Estate Taxes | $3,027 | $89 |
Property Value by Mortgage Status in Lutz
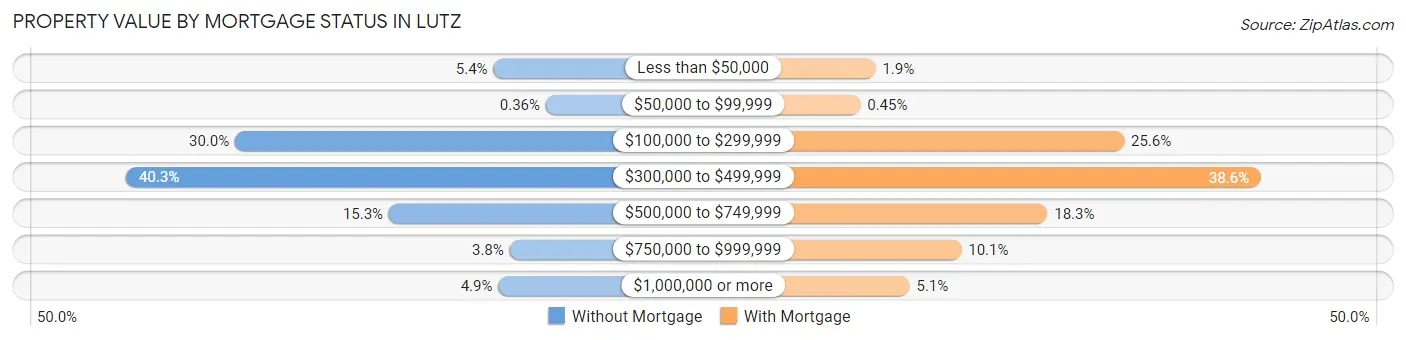
| Property Value | Without Mortgage | With Mortgage |
| Less than $50,000 | 149 (5.3%) | 89 (1.9%) |
| $50,000 to $99,999 | 10 (0.4%) | 21 (0.4%) |
| $100,000 to $299,999 | 834 (30.0%) | 1,199 (25.6%) |
| $300,000 to $499,999 | 1,123 (40.3%) | 1,811 (38.6%) |
| $500,000 to $749,999 | 426 (15.3%) | 856 (18.3%) |
| $750,000 to $999,999 | 106 (3.8%) | 472 (10.1%) |
| $1,000,000 or more | 136 (4.9%) | 241 (5.1%) |
| Total | 2,784 (100.0%) | 4,689 (100.0%) |
Household Income by Mortgage Status in Lutz
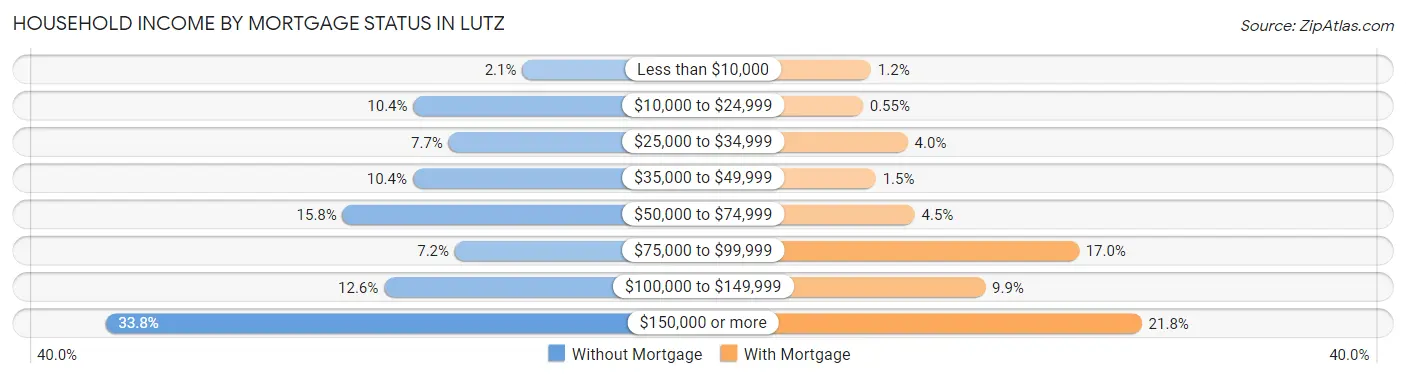
| Household Income | Without Mortgage | With Mortgage |
| Less than $10,000 | 58 (2.1%) | 55 (1.2%) |
| $10,000 to $24,999 | 289 (10.4%) | 26 (0.5%) |
| $25,000 to $34,999 | 214 (7.7%) | 186 (4.0%) |
| $35,000 to $49,999 | 290 (10.4%) | 72 (1.5%) |
| $50,000 to $74,999 | 439 (15.8%) | 211 (4.5%) |
| $75,000 to $99,999 | 201 (7.2%) | 797 (17.0%) |
| $100,000 to $149,999 | 351 (12.6%) | 463 (9.9%) |
| $150,000 or more | 942 (33.8%) | 1,022 (21.8%) |
| Total | 2,784 (100.0%) | 4,689 (100.0%) |
Property Value to Household Income Ratio in Lutz
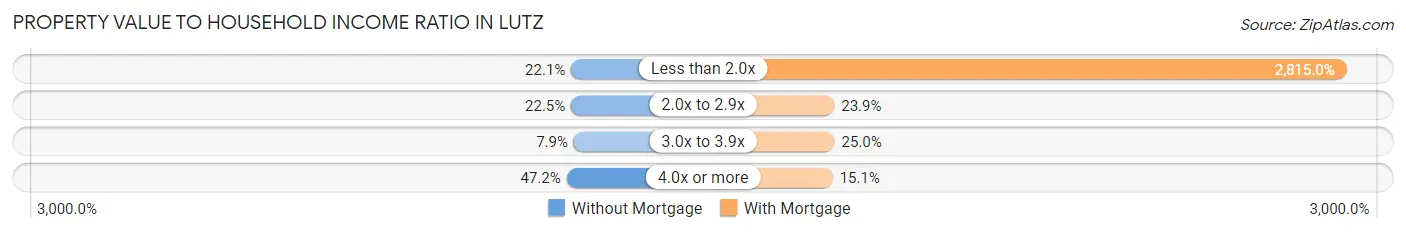
| Value-to-Income Ratio | Without Mortgage | With Mortgage |
| Less than 2.0x | 616 (22.1%) | 131,996 (2,815.0%) |
| 2.0x to 2.9x | 625 (22.5%) | 1,122 (23.9%) |
| 3.0x to 3.9x | 221 (7.9%) | 1,174 (25.0%) |
| 4.0x or more | 1,313 (47.2%) | 709 (15.1%) |
| Total | 2,784 (100.0%) | 4,689 (100.0%) |
Real Estate Taxes by Mortgage Status in Lutz
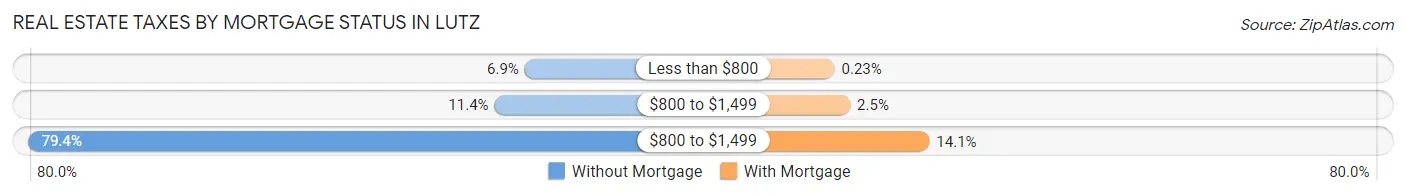
| Property Taxes | Without Mortgage | With Mortgage |
| Less than $800 | 193 (6.9%) | 11 (0.2%) |
| $800 to $1,499 | 316 (11.4%) | 117 (2.5%) |
| $800 to $1,499 | 2,211 (79.4%) | 660 (14.1%) |
| Total | 2,784 (100.0%) | 4,689 (100.0%) |
Health & Disability in Lutz
Health Insurance Coverage by Age in Lutz
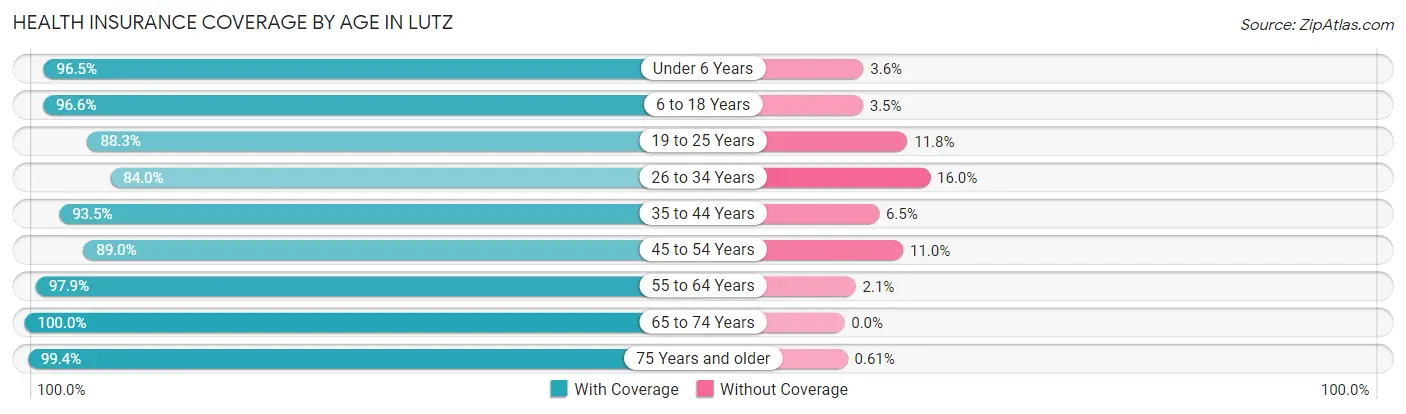
| Age Bracket | With Coverage | Without Coverage |
| Under 6 Years | 1,441 (96.5%) | 53 (3.5%) |
| 6 to 18 Years | 4,536 (96.6%) | 162 (3.5%) |
| 19 to 25 Years | 1,502 (88.2%) | 200 (11.7%) |
| 26 to 34 Years | 2,142 (84.0%) | 408 (16.0%) |
| 35 to 44 Years | 2,939 (93.5%) | 203 (6.5%) |
| 45 to 54 Years | 2,998 (89.0%) | 369 (11.0%) |
| 55 to 64 Years | 3,106 (97.9%) | 67 (2.1%) |
| 65 to 74 Years | 2,834 (100.0%) | 0 (0.0%) |
| 75 Years and older | 1,478 (99.4%) | 9 (0.6%) |
| Total | 22,976 (94.0%) | 1,471 (6.0%) |
Health Insurance Coverage by Citizenship Status in Lutz

| Citizenship Status | With Coverage | Without Coverage |
| Native Born | 1,441 (96.5%) | 53 (3.5%) |
| Foreign Born, Citizen | 4,536 (96.6%) | 162 (3.5%) |
| Foreign Born, not a Citizen | 1,502 (88.2%) | 200 (11.7%) |
Health Insurance Coverage by Household Income in Lutz
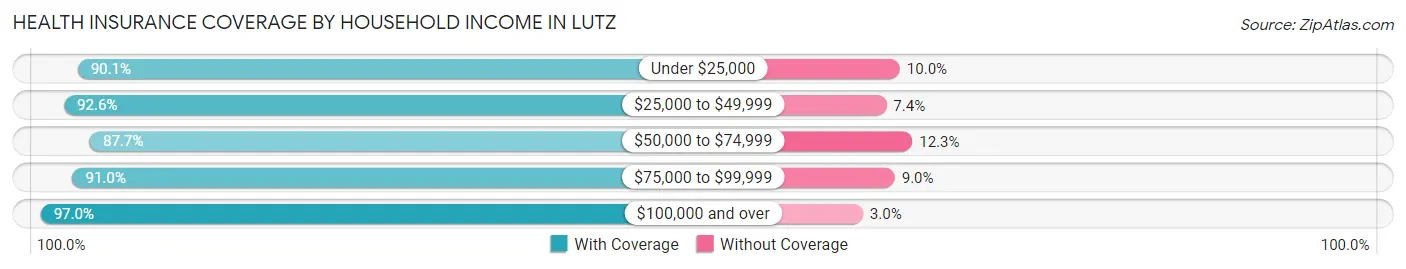
| Household Income | With Coverage | Without Coverage |
| Under $25,000 | 1,122 (90.0%) | 124 (10.0%) |
| $25,000 to $49,999 | 2,010 (92.6%) | 161 (7.4%) |
| $50,000 to $74,999 | 3,867 (87.7%) | 541 (12.3%) |
| $75,000 to $99,999 | 1,974 (91.0%) | 195 (9.0%) |
| $100,000 and over | 13,960 (97.0%) | 435 (3.0%) |
Public vs Private Health Insurance Coverage by Age in Lutz
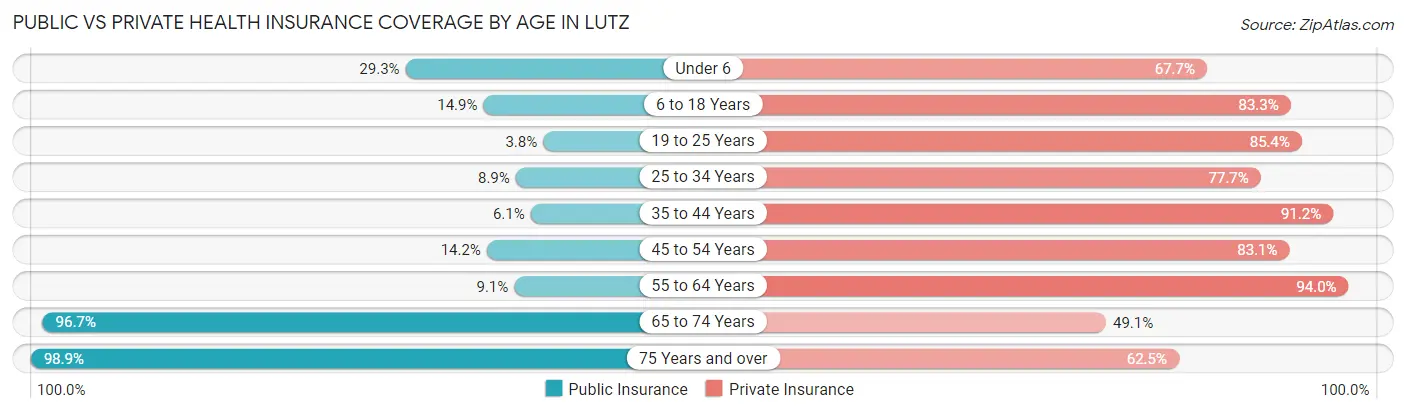
| Age Bracket | Public Insurance | Private Insurance |
| Under 6 | 438 (29.3%) | 1,012 (67.7%) |
| 6 to 18 Years | 698 (14.9%) | 3,913 (83.3%) |
| 19 to 25 Years | 64 (3.8%) | 1,453 (85.4%) |
| 25 to 34 Years | 226 (8.9%) | 1,982 (77.7%) |
| 35 to 44 Years | 191 (6.1%) | 2,865 (91.2%) |
| 45 to 54 Years | 479 (14.2%) | 2,797 (83.1%) |
| 55 to 64 Years | 290 (9.1%) | 2,984 (94.0%) |
| 65 to 74 Years | 2,739 (96.7%) | 1,390 (49.0%) |
| 75 Years and over | 1,470 (98.9%) | 930 (62.5%) |
| Total | 6,595 (27.0%) | 19,326 (79.0%) |
Disability Status by Sex by Age in Lutz
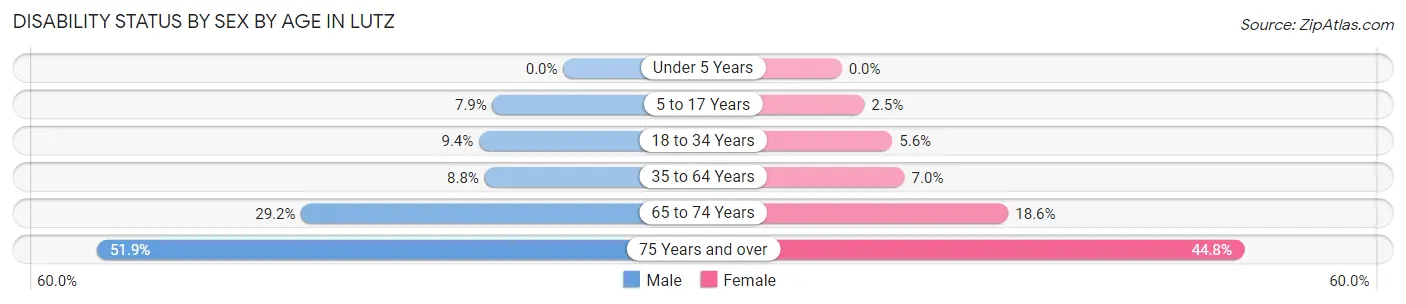
| Age Bracket | Male | Female |
| Under 5 Years | 0 (0.0%) | 0 (0.0%) |
| 5 to 17 Years | 183 (7.9%) | 59 (2.5%) |
| 18 to 34 Years | 194 (9.4%) | 139 (5.6%) |
| 35 to 64 Years | 420 (8.8%) | 342 (7.0%) |
| 65 to 74 Years | 440 (29.2%) | 246 (18.5%) |
| 75 Years and over | 335 (51.9%) | 377 (44.8%) |
Disability Class by Sex by Age in Lutz
Disability Class: Hearing Difficulty
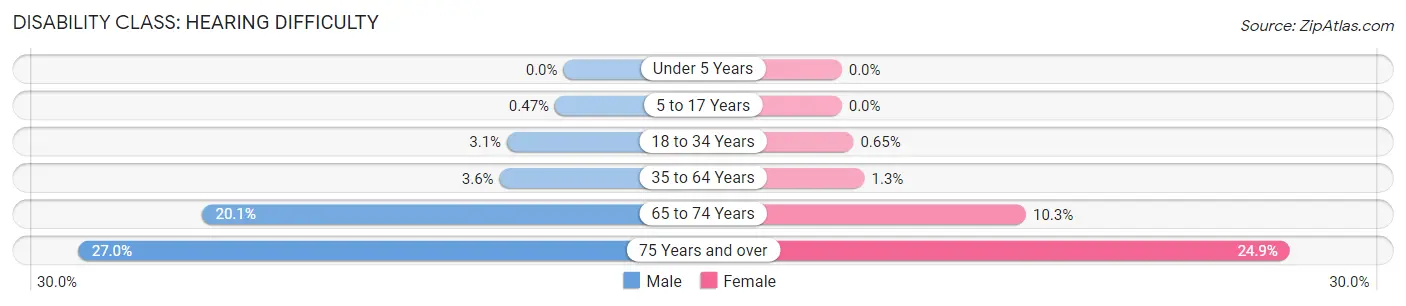
| Age Bracket | Male | Female |
| Under 5 Years | 0 (0.0%) | 0 (0.0%) |
| 5 to 17 Years | 11 (0.5%) | 0 (0.0%) |
| 18 to 34 Years | 65 (3.1%) | 16 (0.6%) |
| 35 to 64 Years | 171 (3.6%) | 62 (1.3%) |
| 65 to 74 Years | 303 (20.1%) | 136 (10.3%) |
| 75 Years and over | 174 (27.0%) | 210 (24.9%) |
Disability Class: Vision Difficulty
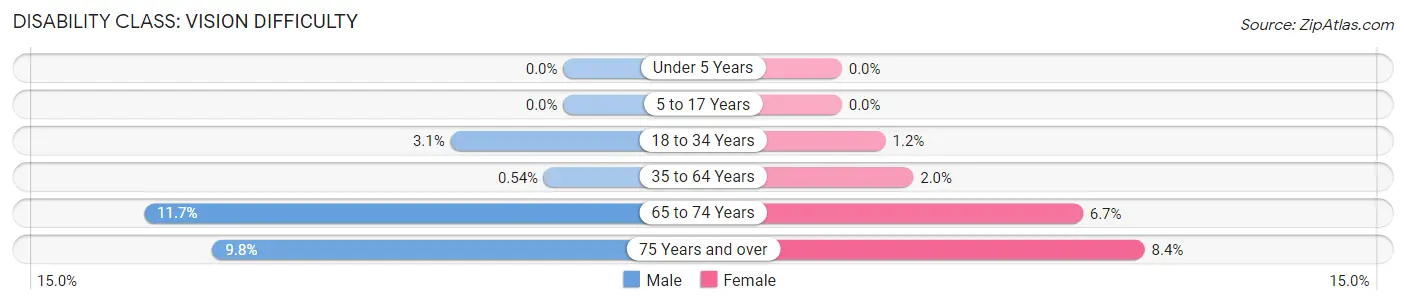
| Age Bracket | Male | Female |
| Under 5 Years | 0 (0.0%) | 0 (0.0%) |
| 5 to 17 Years | 0 (0.0%) | 0 (0.0%) |
| 18 to 34 Years | 65 (3.1%) | 30 (1.2%) |
| 35 to 64 Years | 26 (0.5%) | 97 (2.0%) |
| 65 to 74 Years | 176 (11.7%) | 89 (6.7%) |
| 75 Years and over | 63 (9.8%) | 71 (8.4%) |
Disability Class: Cognitive Difficulty
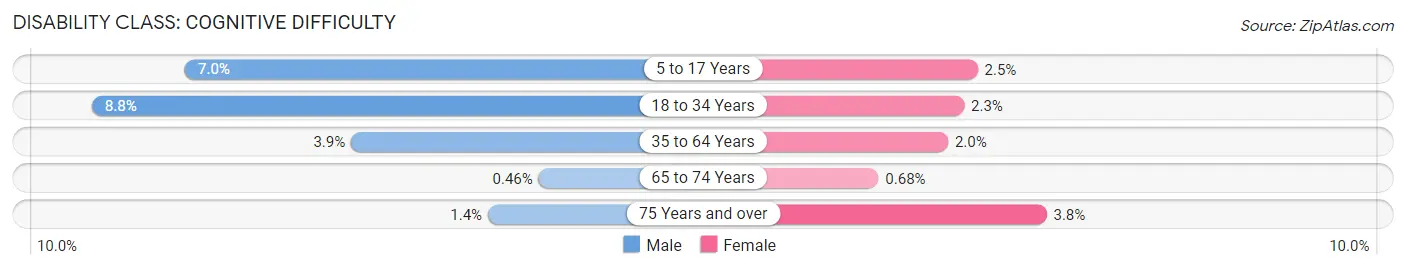
| Age Bracket | Male | Female |
| 5 to 17 Years | 163 (7.0%) | 59 (2.5%) |
| 18 to 34 Years | 181 (8.7%) | 56 (2.3%) |
| 35 to 64 Years | 189 (3.9%) | 96 (2.0%) |
| 65 to 74 Years | 7 (0.5%) | 9 (0.7%) |
| 75 Years and over | 9 (1.4%) | 32 (3.8%) |
Disability Class: Ambulatory Difficulty
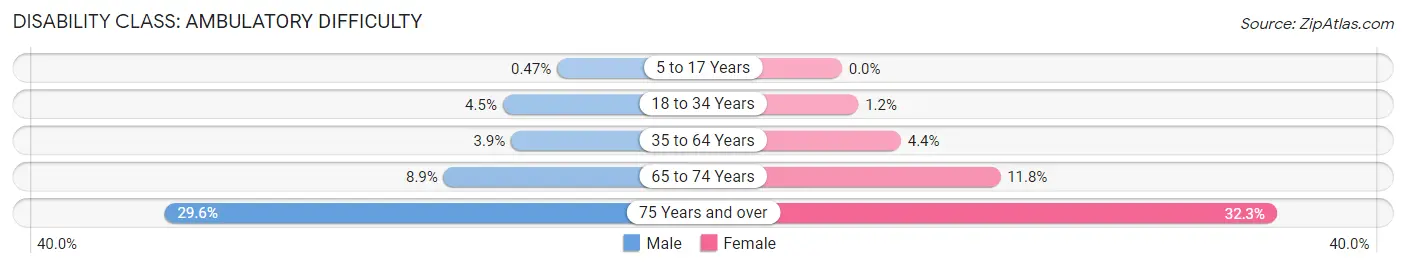
| Age Bracket | Male | Female |
| 5 to 17 Years | 11 (0.5%) | 0 (0.0%) |
| 18 to 34 Years | 93 (4.5%) | 30 (1.2%) |
| 35 to 64 Years | 186 (3.9%) | 214 (4.4%) |
| 65 to 74 Years | 134 (8.9%) | 156 (11.8%) |
| 75 Years and over | 191 (29.6%) | 272 (32.3%) |
Disability Class: Self-Care Difficulty
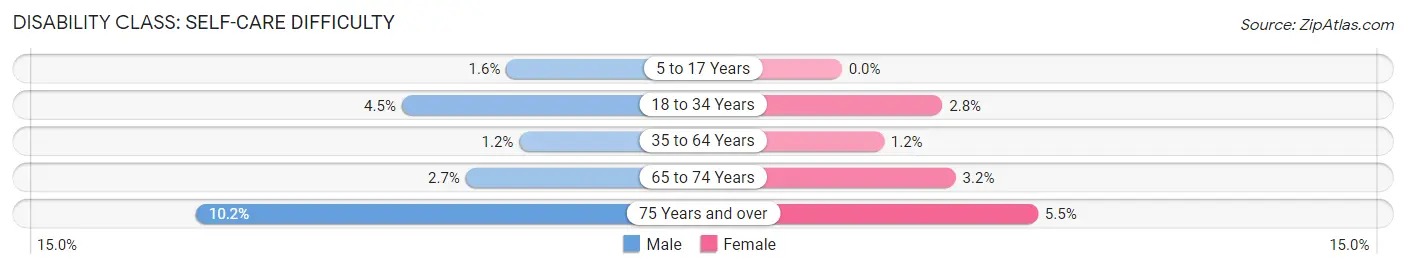
| Age Bracket | Male | Female |
| 5 to 17 Years | 37 (1.6%) | 0 (0.0%) |
| 18 to 34 Years | 93 (4.5%) | 69 (2.8%) |
| 35 to 64 Years | 59 (1.2%) | 57 (1.2%) |
| 65 to 74 Years | 41 (2.7%) | 42 (3.2%) |
| 75 Years and over | 66 (10.2%) | 46 (5.5%) |
Technology Access in Lutz
Computing Device Access in Lutz
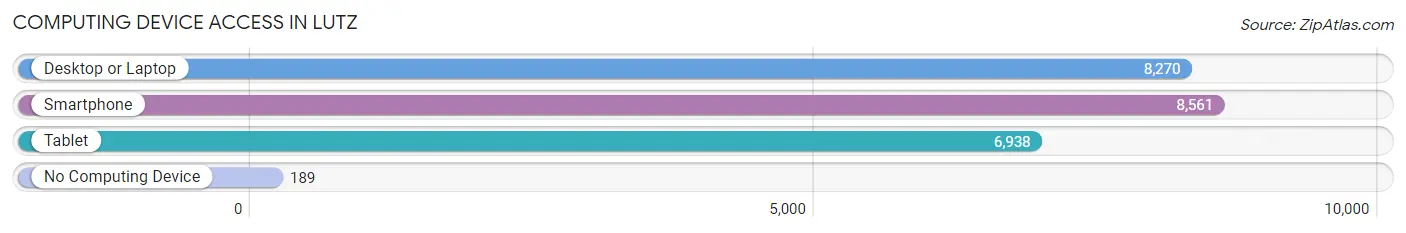
| Device Type | # Households | % Households |
| Desktop or Laptop | 8,270 | 91.5% |
| Smartphone | 8,561 | 94.7% |
| Tablet | 6,938 | 76.7% |
| No Computing Device | 189 | 2.1% |
| Total | 9,041 | 100.0% |
Internet Access in Lutz
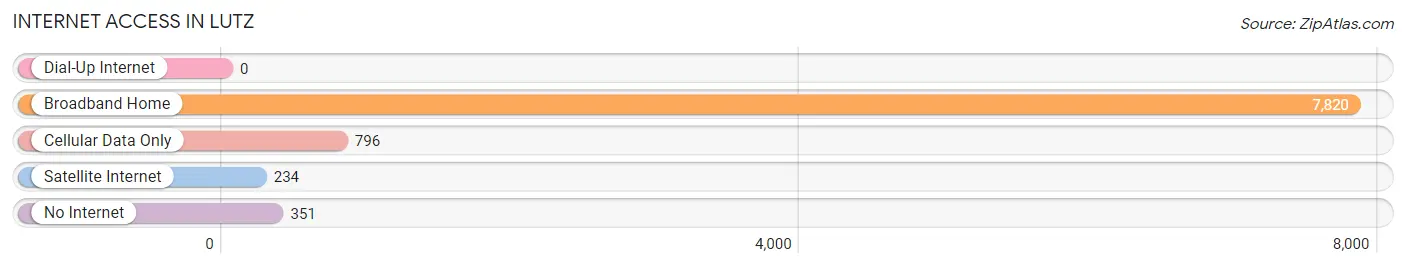
| Internet Type | # Households | % Households |
| Dial-Up Internet | 0 | 0.0% |
| Broadband Home | 7,820 | 86.5% |
| Cellular Data Only | 796 | 8.8% |
| Satellite Internet | 234 | 2.6% |
| No Internet | 351 | 3.9% |
| Total | 9,041 | 100.0% |
Lutz Summary
Lutz is an unincorporated census-designated place in Hillsborough County, Florida, United States. It is located north of Tampa and is part of the Tampa Bay Area metropolitan area. The population was 19,344 at the 2010 census.
History
Lutz was founded in 1880 by William and Mary Lutz, who moved to the area from Ohio. The Lutzes purchased 40 acres of land and built a two-story home, which still stands today. The area was originally known as Lutzville, but the name was changed to Lutz in 1910.
In the early 1900s, the area was a popular destination for vacationers from Tampa. The Lutzes opened a post office in their home, and the area began to grow. By the 1920s, the area had become a popular spot for weekend getaways and fishing trips.
In the 1950s, the area began to experience rapid growth as Tampa's population increased. The area was annexed by Hillsborough County in 1959, and the population continued to grow. By the 1970s, Lutz had become a popular bedroom community for Tampa.
Geography
Lutz is located in Hillsborough County, Florida, at 28°7'25" North, 82°25'25" West (28.123611, -82.423889). The elevation is 33 feet (10 m).
Lutz is located in the Tampa Bay Area, approximately 20 miles (32 km) north of downtown Tampa. It is bordered by the cities of Tampa, Land O' Lakes, and Odessa.
Economy
Lutz is home to a variety of businesses, including retail stores, restaurants, and professional services. The area is also home to several corporate headquarters, including the headquarters of the Outback Steakhouse chain.
The area is also home to several industrial parks, including the Lutz Industrial Park and the Lutz Business Park. These parks are home to a variety of businesses, including manufacturing, distribution, and technology companies.
Demographics
As of the 2010 census, there were 19,344 people, 7,845 households, and 5,717 families residing in Lutz. The population density was 1,845.3 people per square mile (715.2/km2). The racial makeup of the CDP was 87.2% White, 5.3% African American, 0.3% Native American, 2.7% Asian, 0.1% Pacific Islander, 2.2% from other races, and 2.3% from two or more races. Hispanic or Latino of any race were 8.7% of the population.
The median income for a household in the CDP was $63,945, and the median income for a family was $71,945. Males had a median income of $50,945 versus $37,945 for females. The per capita income for the CDP was $30,945. About 4.2% of families and 5.7% of the population were below the poverty line, including 7.2% of those under age 18 and 4.2% of those age 65 or over.
Common Questions
What is Per Capita Income in Lutz?
Per Capita income in Lutz is $51,515.
What is the Median Family Income in Lutz?
Median Family Income in Lutz is $131,209.
What is the Median Household income in Lutz?
Median Household Income in Lutz is $101,159.
What is Income or Wage Gap in Lutz?
Income or Wage Gap in Lutz is 31.3%.
Women in Lutz earn 68.7 cents for every dollar earned by a man.
What is Inequality or Gini Index in Lutz?
Inequality or Gini Index in Lutz is 0.45.
What is the Total Population of Lutz?
Total Population of Lutz is 24,721.
What is the Total Male Population of Lutz?
Total Male Population of Lutz is 12,284.
What is the Total Female Population of Lutz?
Total Female Population of Lutz is 12,437.
What is the Ratio of Males per 100 Females in Lutz?
There are 98.77 Males per 100 Females in Lutz.
What is the Ratio of Females per 100 Males in Lutz?
There are 101.25 Females per 100 Males in Lutz.
What is the Median Population Age in Lutz?
Median Population Age in Lutz is 41.0 Years.
What is the Average Family Size in Lutz
Average Family Size in Lutz is 3.2 People.
What is the Average Household Size in Lutz
Average Household Size in Lutz is 2.7 People.
How Large is the Labor Force in Lutz?
There are 12,725 People in the Labor Forcein in Lutz.
What is the Percentage of People in the Labor Force in Lutz?
65.0% of People are in the Labor Force in Lutz.
What is the Unemployment Rate in Lutz?
Unemployment Rate in Lutz is 2.7%.