Zip Codes with the Highest Percentage of Population Employed in Accommodation & Food Services in Lake City, FL
RELATED REPORTS & OPTIONS
Accommodation & Food Services
Lake City
Compare Zip Codes
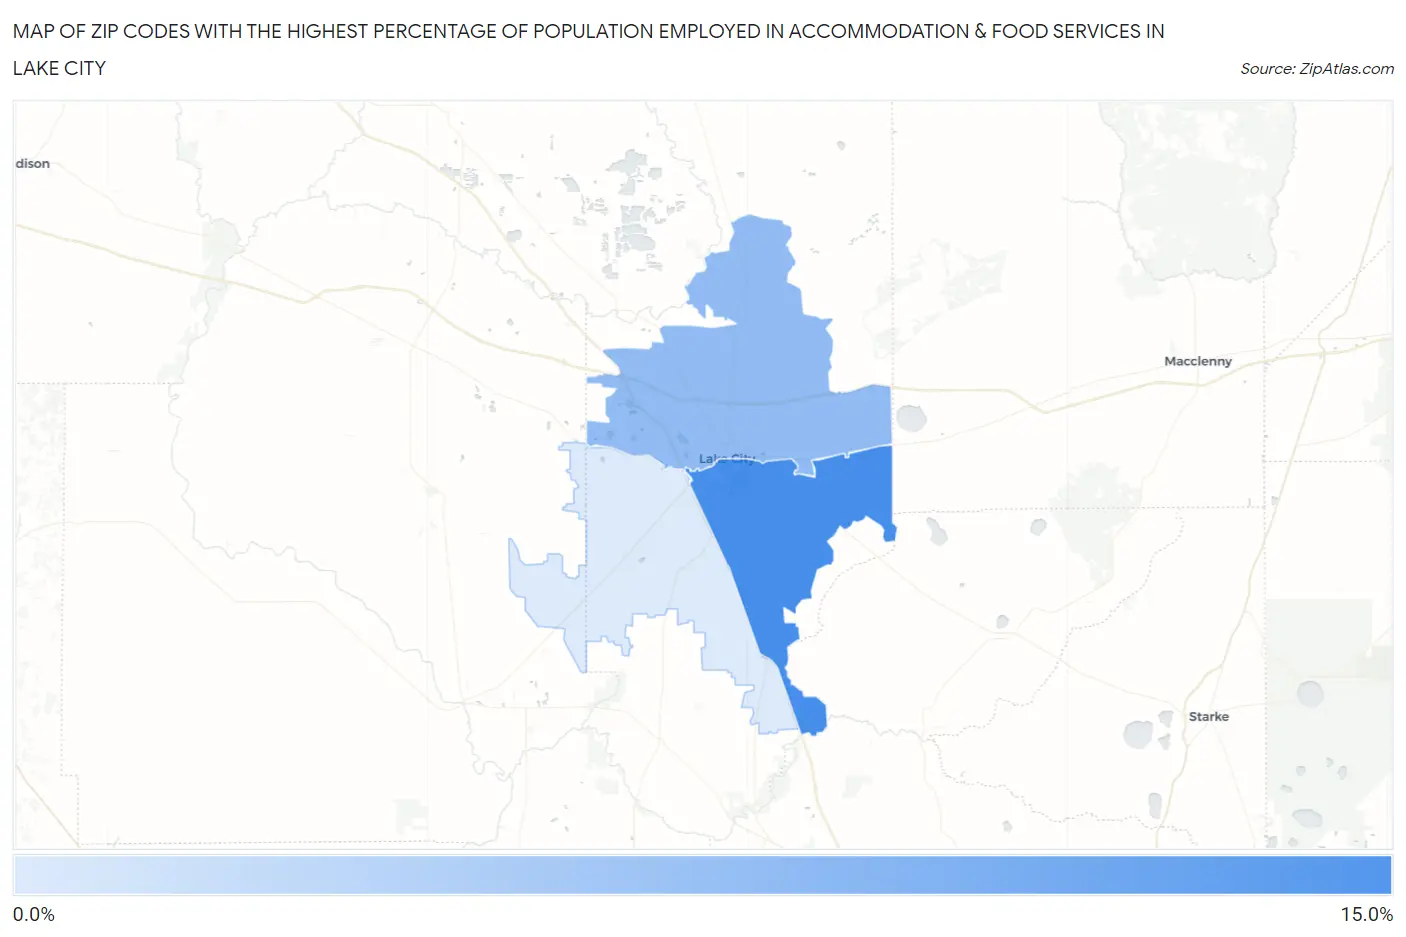
Map of Zip Codes with the Highest Percentage of Population Employed in Accommodation & Food Services in Lake City
4.5%
14.9%
Zip Codes with the Highest Percentage of Population Employed in Accommodation & Food Services in Lake City, FL
| Zip Code | % Employed | vs State | vs National | |
| 1. | 32025 | 14.9% | 8.4%(+6.57)#62 | 6.9%(+8.06)#1,684 |
| 2. | 32055 | 9.7% | 8.4%(+1.32)#288 | 6.9%(+2.81)#4,940 |
| 3. | 32024 | 4.5% | 8.4%(-3.88)#836 | 6.9%(-2.39)#18,535 |
1
Common Questions
What are the Top Zip Codes with the Highest Percentage of Population Employed in Accommodation & Food Services in Lake City, FL?
Top Zip Codes with the Highest Percentage of Population Employed in Accommodation & Food Services in Lake City, FL are:
What zip code has the Highest Percentage of Population Employed in Accommodation & Food Services in Lake City, FL?
32025 has the Highest Percentage of Population Employed in Accommodation & Food Services in Lake City, FL with 14.9%.
What is the Percentage of Population Employed in Accommodation & Food Services in Lake City, FL?
Percentage of Population Employed in Accommodation & Food Services in Lake City is 13.0%.
What is the Percentage of Population Employed in Accommodation & Food Services in Florida?
Percentage of Population Employed in Accommodation & Food Services in Florida is 8.4%.
What is the Percentage of Population Employed in Accommodation & Food Services in the United States?
Percentage of Population Employed in Accommodation & Food Services in the United States is 6.9%.