Zip Codes with the Highest Percentage of Population Employed in Life, Physical & Social Science in Homestead, FL

RELATED REPORTS & OPTIONS

Life, Physical & Social Science
Population
Families and Households
Female Fertility
Female Fertility (Unmarried)
Race (Community Size)
Race (Percentage)
Ancestry (Community Size)
AfricanAmericanArabArgentineanBahamianBelizeanBhutaneseBlackfeetBolivianBrazilianBritishBritish West IndianBulgarianBurmeseCanadianCape VerdeanCentral AmericanCentral American IndianCherokeeChileanColombianCosta RicanCubanCzechDominicanDutchEastern EuropeanEcuadorianEnglishEuropeanFinnishFrenchFrench CanadianGermanGreekGuatemalanGuyaneseHaitianHonduranHungarianIndian (Asian)IrishItalianJamaicanJapaneseKoreanLebaneseLithuanianMalaysianMexicanMexican American IndianNicaraguanNigerianNorthern EuropeanNorwegianPanamanianPeruvianPolishPortuguesePuerto RicanRussianSalvadoranScandinavianScotch-IrishScottishSlavicSouth AmericanSouth American IndianSpaniardSpanishSri LankanSubsaharan AfricanSwedishSyrianThaiTrinidadian and TobagonianTurkishU.S. Virgin IslanderUruguayanVenezuelanVietnameseWelshWest Indian
Ancestry (Percentage)
AfricanAmericanArabArgentineanBahamianBelizeanBhutaneseBlackfeetBolivianBrazilianBritishBritish West IndianBulgarianBurmeseCanadianCape VerdeanCentral AmericanCentral American IndianCherokeeChileanColombianCosta RicanCubanCzechDominicanDutchEastern EuropeanEcuadorianEnglishEuropeanFinnishFrenchFrench CanadianGermanGreekGuatemalanGuyaneseHaitianHonduranHungarianIndian (Asian)IrishItalianJamaicanJapaneseKoreanLebaneseLithuanianMalaysianMexicanMexican American IndianNicaraguanNigerianNorthern EuropeanNorwegianPanamanianPeruvianPolishPortuguesePuerto RicanRussianSalvadoranScandinavianScotch-IrishScottishSlavicSouth AmericanSouth American IndianSpaniardSpanishSri LankanSubsaharan AfricanSwedishSyrianThaiTrinidadian and TobagonianTurkishU.S. Virgin IslanderUruguayanVenezuelanVietnameseWelshWest Indian
Immigrant Origin (Total)
Immigrant Origin (Percentage)
Income
Income (Families)
Income (Households)
Poverty
Poverty (Families)
Unemployment
Employment Occupations
Employment Industries
Employer Class
Commute Time
Commute Means
School Enrollment
Education by Degree Field
Occupancy
Finances
Physical Characteristics
Homestead
States
Florida Cities
Altamonte SpringsApopkaBoca RatonBonita SpringsBoynton BeachBradentonBrandonBrooksvilleCape CoralCasselberryClearwaterClermontCocoaCoral SpringsCrestviewDade CityDavenportDaytona BeachDeerfield BeachDefuniak SpringsDelray BeachDeltonaDunnellonEnglewoodEustisFort LauderdaleFort MyersFort PierceFort Walton BeachGainesvilleGulf BreezeHialeahHolidayHollywoodHomesteadHudsonInvernessJacksonvilleJupiterKissimmeeLake CityLake WorthLakelandLand O LakesLargoLehigh AcresLongwoodLutzMelbourneMerritt IslandMiamiMiami BeachMiltonNaplesNew Port RicheyNew Smyrna BeachNorth PortOcalaOkeechobeeOrange ParkOrlandoOrmond BeachOviedoPalm BayPalm Beach GardensPalm CoastPalm HarborPanama CityPanama City BeachPensacolaPinellas ParkPlant CityPompano BeachPort CharlottePort OrangePort Saint LuciePunta GordaQuincyRiverviewSaint AugustineSaint CloudSaint PetersburgSanfordSarasotaSebastianSebringSeminoleSpring HillStuartTallahasseeTampaTarpon SpringsThe VillagesTitusvilleValricoVeniceVero BeachWesley ChapelWest Palm BeachWinter HavenWinter ParkZephyrhills
Compare Zip Codes
Comparison Subject

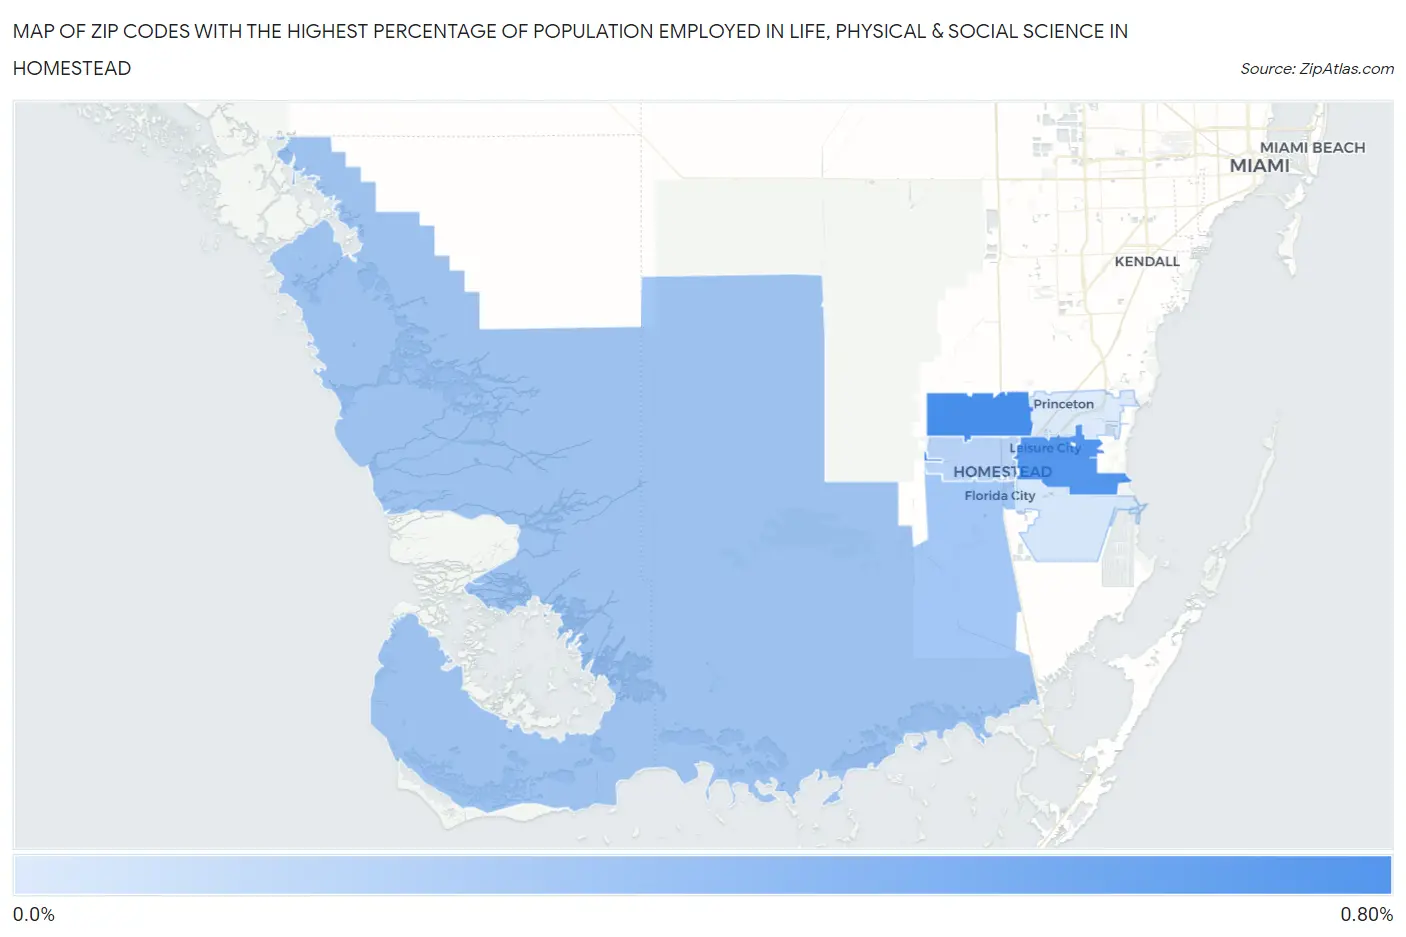
Map of Zip Codes with the Highest Percentage of Population Employed in Life, Physical & Social Science in Homestead

0.0%
0.80%
Zip Codes with the Highest Percentage of Population Employed in Life, Physical & Social Science in Homestead Map

Zip Codes with the Highest Percentage of Population Employed in Life, Physical & Social Science in Homestead, FL

Zip Code % Employed vs State vs National
1.330310.64%0.67%(-0.027)#3581.1%(-0.449)#12,753
2.330330.59%0.67%(-0.081)#3941.1%(-0.503)#13,447
3.330340.28%0.67%(-0.390)#6181.1%(-0.812)#17,295
4.330300.20%0.67%(-0.470)#6661.1%(-0.892)#18,211
5.330350.086%0.67%(-0.583)#7381.1%(-1.00)#19,160
6.330320.057%0.67%(-0.612)#7461.1%(-1.03)#19,303

Common Questions

What are the Top 5 Zip Codes with the Highest Percentage of Population Employed in Life, Physical & Social Science in Homestead, FL?
Top 5 Zip Codes with the Highest Percentage of Population Employed in Life, Physical & Social Science in Homestead, FL are:
#1
0.64%
#2
0.59%
#3
0.28%
#4
0.20%
#5
0.086%
What zip code has the Highest Percentage of Population Employed in Life, Physical & Social Science in Homestead, FL?
33031 has the Highest Percentage of Population Employed in Life, Physical & Social Science in Homestead, FL with 0.64%.
What is the Percentage of Population Employed in Life, Physical & Social Science in Homestead, FL?
Percentage of Population Employed in Life, Physical & Social Science in Homestead is 0.31%.
What is the Percentage of Population Employed in Life, Physical & Social Science in Florida?
Percentage of Population Employed in Life, Physical & Social Science in Florida is 0.67%.
What is the Percentage of Population Employed in Life, Physical & Social Science in the United States?
Percentage of Population Employed in Life, Physical & Social Science in the United States is 1.1%.