Fort Walton Beach, FL Map & Demographics
Fort Walton Beach Map
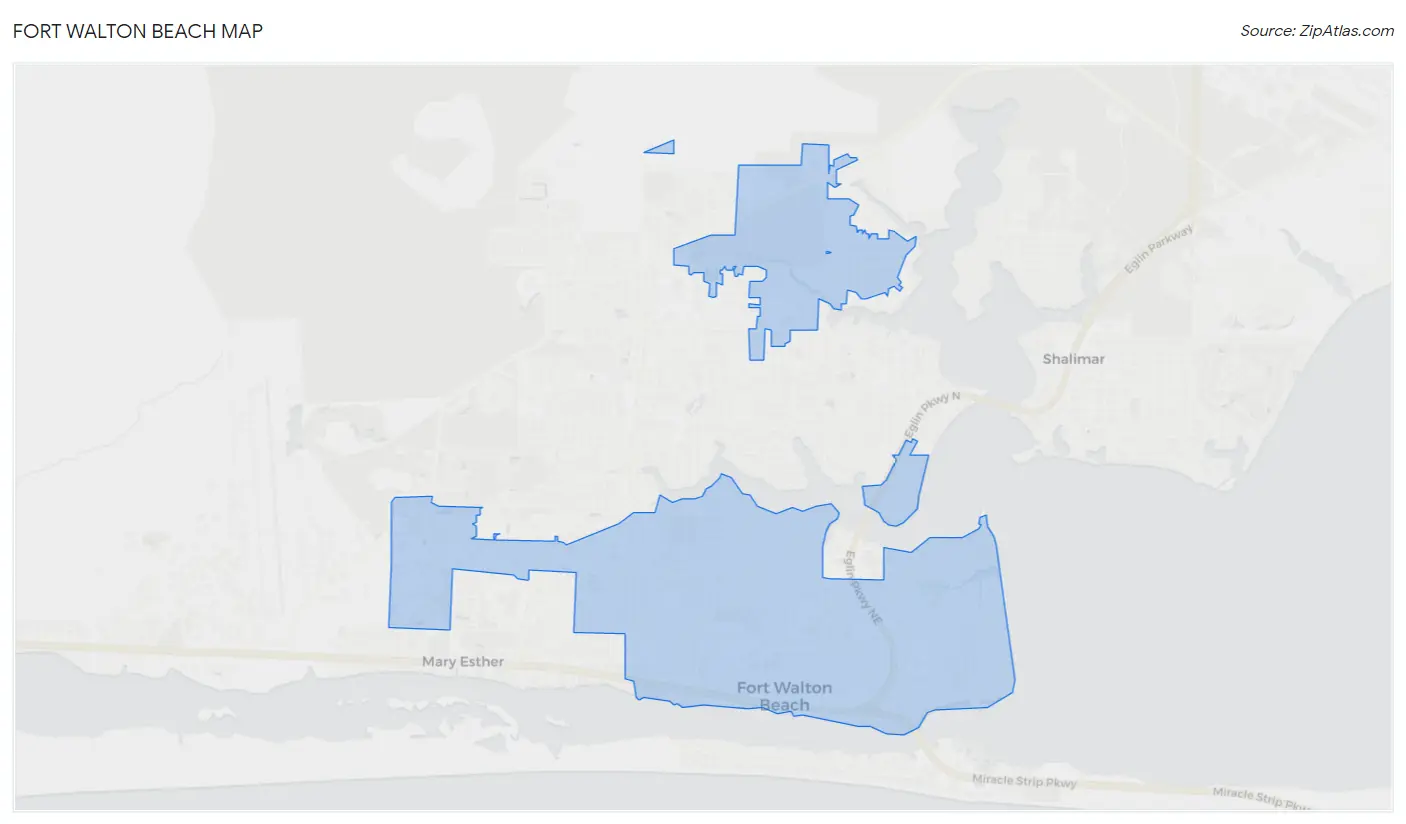
Fort Walton Beach Overview
$36,251
PER CAPITA INCOME
$80,000
AVG FAMILY INCOME
$61,820
AVG HOUSEHOLD INCOME
33.8%
WAGE / INCOME GAP [ % ]
66.2¢/ $1
WAGE / INCOME GAP [ $ ]
$6,646
FAMILY INCOME DEFICIT
0.45
INEQUALITY / GINI INDEX
20,919
TOTAL POPULATION
10,704
MALE POPULATION
10,215
FEMALE POPULATION
104.79
MALES / 100 FEMALES
95.43
FEMALES / 100 MALES
39.7
MEDIAN AGE
3.0
AVG FAMILY SIZE
2.3
AVG HOUSEHOLD SIZE
11,043
LABOR FORCE [ PEOPLE ]
66.4%
PERCENT IN LABOR FORCE
3.9%
UNEMPLOYMENT RATE
Fort Walton Beach Area Codes
Income in Fort Walton Beach
Income Overview in Fort Walton Beach
Per Capita Income in Fort Walton Beach is $36,251, while median incomes of families and households are $80,000 and $61,820 respectively.
| Characteristic | Number | Measure |
| Per Capita Income | 20,919 | $36,251 |
| Median Family Income | 5,078 | $80,000 |
| Mean Family Income | 5,078 | $105,579 |
| Median Household Income | 8,840 | $61,820 |
| Mean Household Income | 8,840 | $84,455 |
| Income Deficit | 5,078 | $6,646 |
| Wage / Income Gap (%) | 20,919 | 33.83% |
| Wage / Income Gap ($) | 20,919 | 66.17¢ per $1 |
| Gini / Inequality Index | 20,919 | 0.45 |
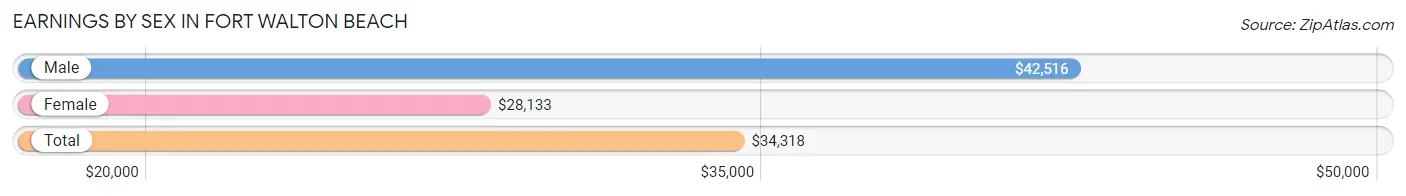
Earnings by Sex in Fort Walton Beach
Average Earnings in Fort Walton Beach are $34,318, $42,516 for men and $28,133 for women, a difference of 33.8%.
| Sex | Number | Average Earnings |
| Male | 6,292 (55.2%) | $42,516 |
| Female | 5,114 (44.8%) | $28,133 |
| Total | 11,406 (100.0%) | $34,318 |
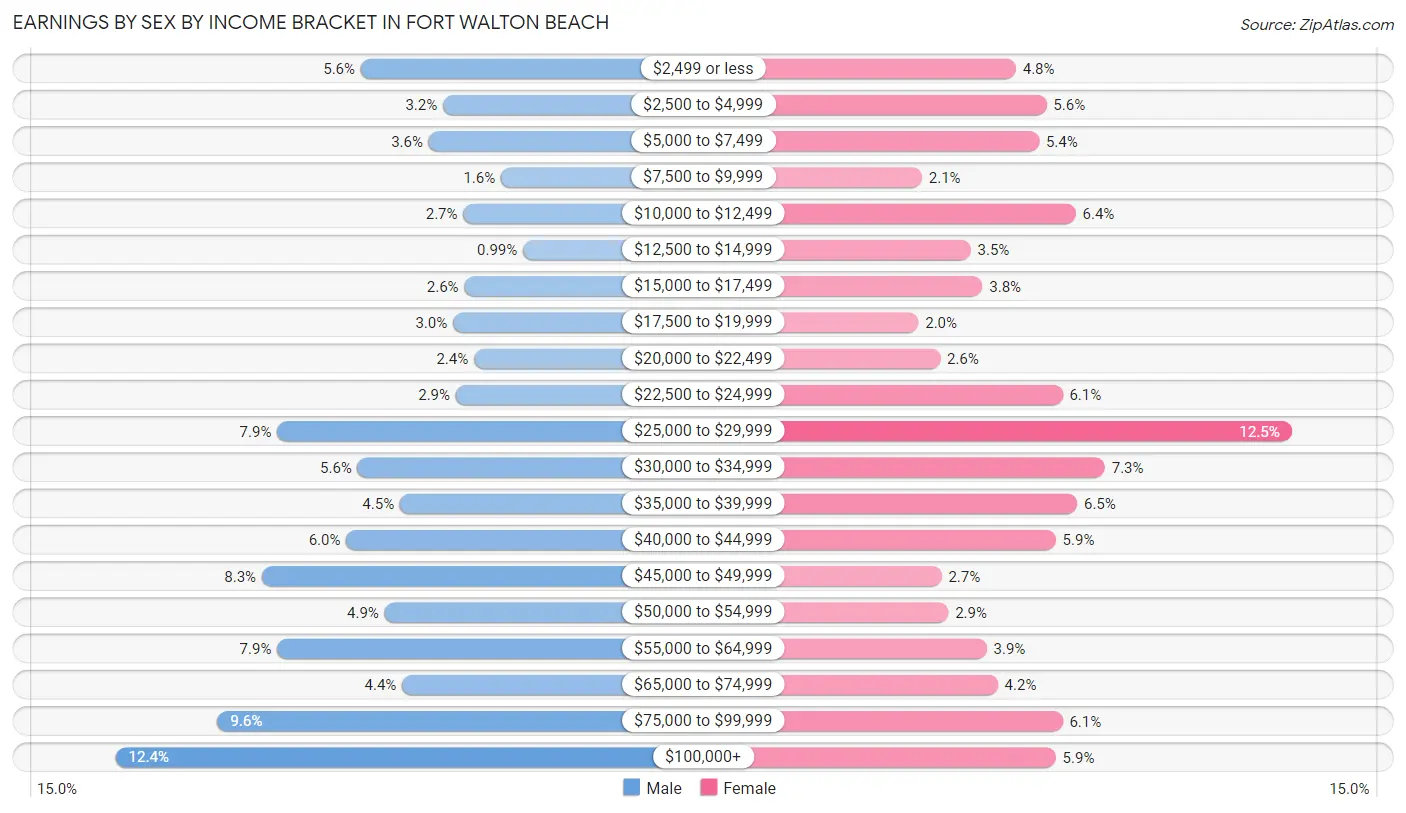
Earnings by Sex by Income Bracket in Fort Walton Beach
The most common earnings brackets in Fort Walton Beach are $100,000+ for men (783 | 12.4%) and $25,000 to $29,999 for women (639 | 12.5%).
| Income | Male | Female |
| $2,499 or less | 349 (5.6%) | 243 (4.8%) |
| $2,500 to $4,999 | 204 (3.2%) | 287 (5.6%) |
| $5,000 to $7,499 | 229 (3.6%) | 276 (5.4%) |
| $7,500 to $9,999 | 101 (1.6%) | 108 (2.1%) |
| $10,000 to $12,499 | 168 (2.7%) | 329 (6.4%) |
| $12,500 to $14,999 | 62 (1.0%) | 178 (3.5%) |
| $15,000 to $17,499 | 166 (2.6%) | 195 (3.8%) |
| $17,500 to $19,999 | 186 (3.0%) | 103 (2.0%) |
| $20,000 to $22,499 | 149 (2.4%) | 134 (2.6%) |
| $22,500 to $24,999 | 181 (2.9%) | 310 (6.1%) |
| $25,000 to $29,999 | 497 (7.9%) | 639 (12.5%) |
| $30,000 to $34,999 | 355 (5.6%) | 371 (7.2%) |
| $35,000 to $39,999 | 280 (4.4%) | 331 (6.5%) |
| $40,000 to $44,999 | 375 (6.0%) | 300 (5.9%) |
| $45,000 to $49,999 | 524 (8.3%) | 136 (2.7%) |
| $50,000 to $54,999 | 307 (4.9%) | 146 (2.9%) |
| $55,000 to $64,999 | 497 (7.9%) | 201 (3.9%) |
| $65,000 to $74,999 | 276 (4.4%) | 217 (4.2%) |
| $75,000 to $99,999 | 603 (9.6%) | 310 (6.1%) |
| $100,000+ | 783 (12.4%) | 300 (5.9%) |
| Total | 6,292 (100.0%) | 5,114 (100.0%) |
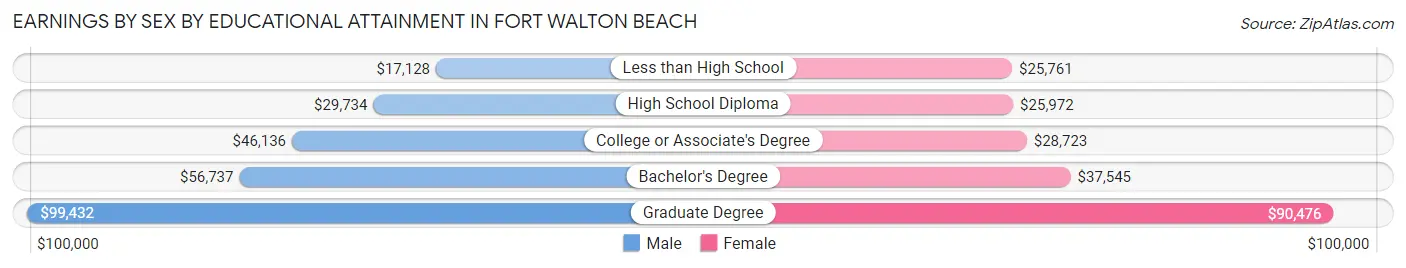
Earnings by Sex by Educational Attainment in Fort Walton Beach
Average earnings in Fort Walton Beach are $46,067 for men and $29,422 for women, a difference of 36.1%. Men with an educational attainment of graduate degree enjoy the highest average annual earnings of $99,432, while those with less than high school education earn the least with $17,128. Women with an educational attainment of graduate degree earn the most with the average annual earnings of $90,476, while those with less than high school education have the smallest earnings of $25,761.
| Educational Attainment | Male Income | Female Income |
| Less than High School | $17,128 | $25,761 |
| High School Diploma | $29,734 | $25,972 |
| College or Associate's Degree | $46,136 | $28,723 |
| Bachelor's Degree | $56,737 | $37,545 |
| Graduate Degree | $99,432 | $90,476 |
| Total | $46,067 | $29,422 |
Family Income in Fort Walton Beach
Family Income Brackets in Fort Walton Beach
According to the Fort Walton Beach family income data, there are 1,148 families falling into the $50,000 to $74,999 income range, which is the most common income bracket and makes up 22.6% of all families. Conversely, the less than $10,000 income bracket is the least frequent group with only 46 families (0.9%) belonging to this category.
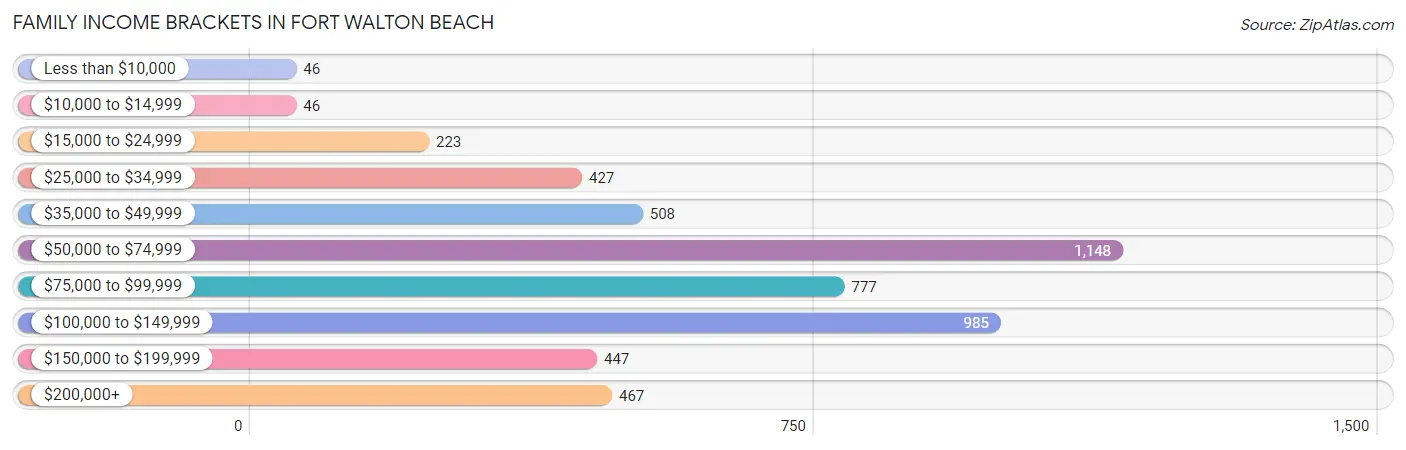
| Income Bracket | # Families | % Families |
| Less than $10,000 | 46 | 0.9% |
| $10,000 to $14,999 | 46 | 0.9% |
| $15,000 to $24,999 | 223 | 4.4% |
| $25,000 to $34,999 | 427 | 8.4% |
| $35,000 to $49,999 | 508 | 10.0% |
| $50,000 to $74,999 | 1,148 | 22.6% |
| $75,000 to $99,999 | 777 | 15.3% |
| $100,000 to $149,999 | 985 | 19.4% |
| $150,000 to $199,999 | 447 | 8.8% |
| $200,000+ | 467 | 9.2% |
Family Income by Famaliy Size in Fort Walton Beach
4-person families (792 | 15.6%) account for the highest median family income in Fort Walton Beach with $92,426 per family, while 2-person families (2,501 | 49.2%) have the highest median income of $39,085 per family member.
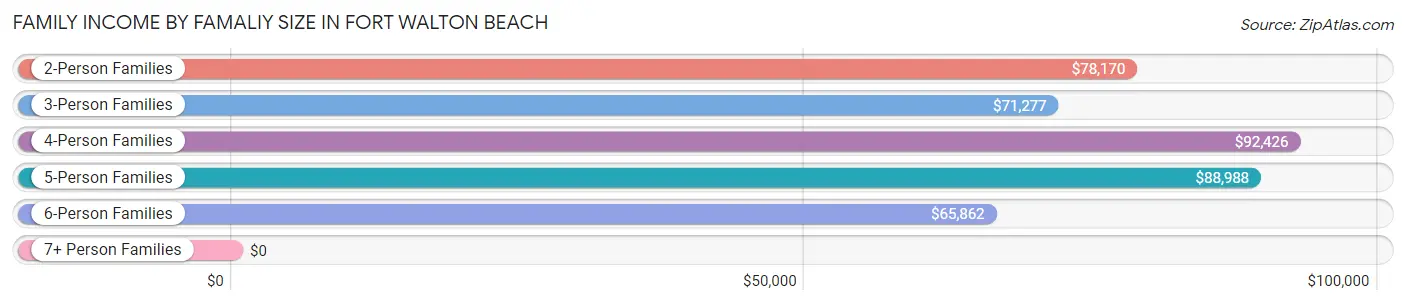
| Income Bracket | # Families | Median Income |
| 2-Person Families | 2,501 (49.2%) | $78,170 |
| 3-Person Families | 1,196 (23.5%) | $71,277 |
| 4-Person Families | 792 (15.6%) | $92,426 |
| 5-Person Families | 407 (8.0%) | $88,988 |
| 6-Person Families | 148 (2.9%) | $65,862 |
| 7+ Person Families | 34 (0.7%) | $0 |
| Total | 5,078 (100.0%) | $80,000 |
Family Income by Number of Earners in Fort Walton Beach
The median family income in Fort Walton Beach is $80,000, with families comprising 3+ earners (369) having the highest median family income of $137,050, while families with 1 earner (1,976) have the lowest median family income of $60,339, accounting for 7.3% and 38.9% of families, respectively.
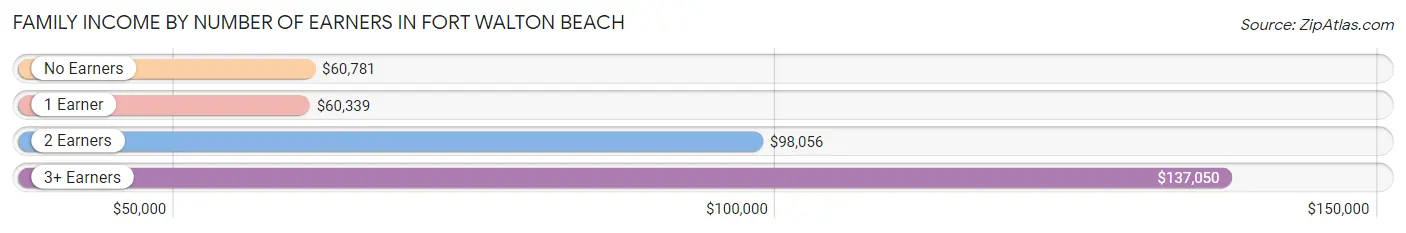
| Number of Earners | # Families | Median Income |
| No Earners | 539 (10.6%) | $60,781 |
| 1 Earner | 1,976 (38.9%) | $60,339 |
| 2 Earners | 2,194 (43.2%) | $98,056 |
| 3+ Earners | 369 (7.3%) | $137,050 |
| Total | 5,078 (100.0%) | $80,000 |
Household Income in Fort Walton Beach
Household Income Brackets in Fort Walton Beach
With 1,803 households falling in the category, the $50,000 to $74,999 income range is the most frequent in Fort Walton Beach, accounting for 20.4% of all households. In contrast, only 318 households (3.6%) fall into the $10,000 to $14,999 income bracket, making it the least populous group.
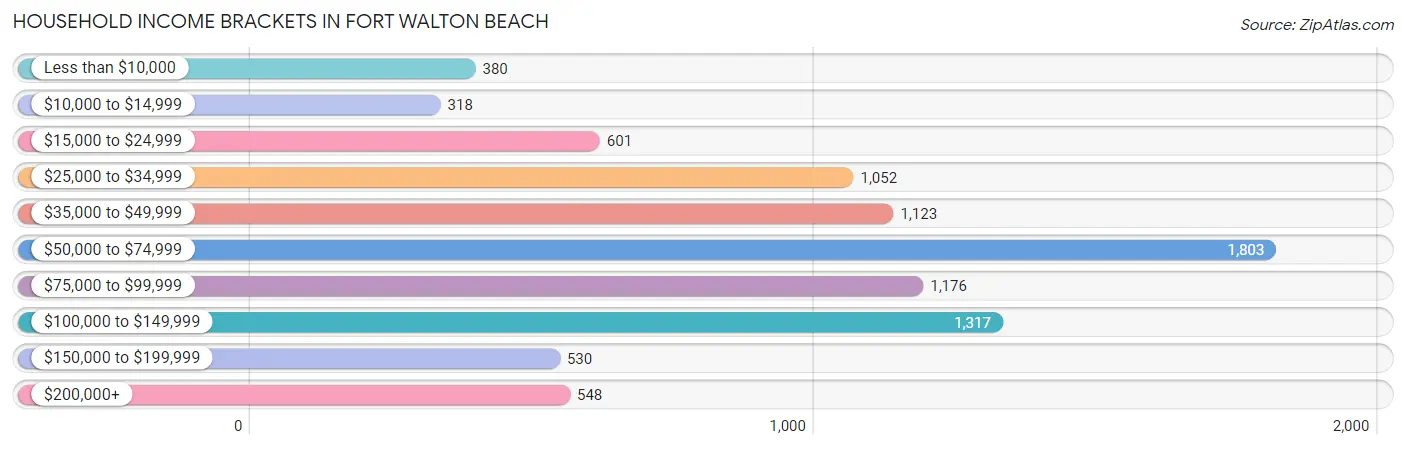
| Income Bracket | # Households | % Households |
| Less than $10,000 | 380 | 4.3% |
| $10,000 to $14,999 | 318 | 3.6% |
| $15,000 to $24,999 | 601 | 6.8% |
| $25,000 to $34,999 | 1,052 | 11.9% |
| $35,000 to $49,999 | 1,123 | 12.7% |
| $50,000 to $74,999 | 1,803 | 20.4% |
| $75,000 to $99,999 | 1,176 | 13.3% |
| $100,000 to $149,999 | 1,317 | 14.9% |
| $150,000 to $199,999 | 530 | 6.0% |
| $200,000+ | 548 | 6.2% |
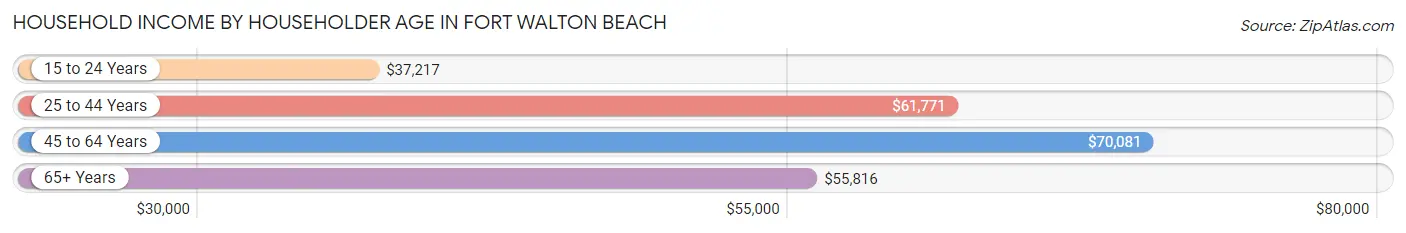
Household Income by Householder Age in Fort Walton Beach
The median household income in Fort Walton Beach is $61,820, with the highest median household income of $70,081 found in the 45 to 64 years age bracket for the primary householder. A total of 3,019 households (34.2%) fall into this category. Meanwhile, the 15 to 24 years age bracket for the primary householder has the lowest median household income of $37,217, with 404 households (4.6%) in this group.
| Income Bracket | # Households | Median Income |
| 15 to 24 Years | 404 (4.6%) | $37,217 |
| 25 to 44 Years | 2,710 (30.7%) | $61,771 |
| 45 to 64 Years | 3,019 (34.2%) | $70,081 |
| 65+ Years | 2,707 (30.6%) | $55,816 |
| Total | 8,840 (100.0%) | $61,820 |
Poverty in Fort Walton Beach
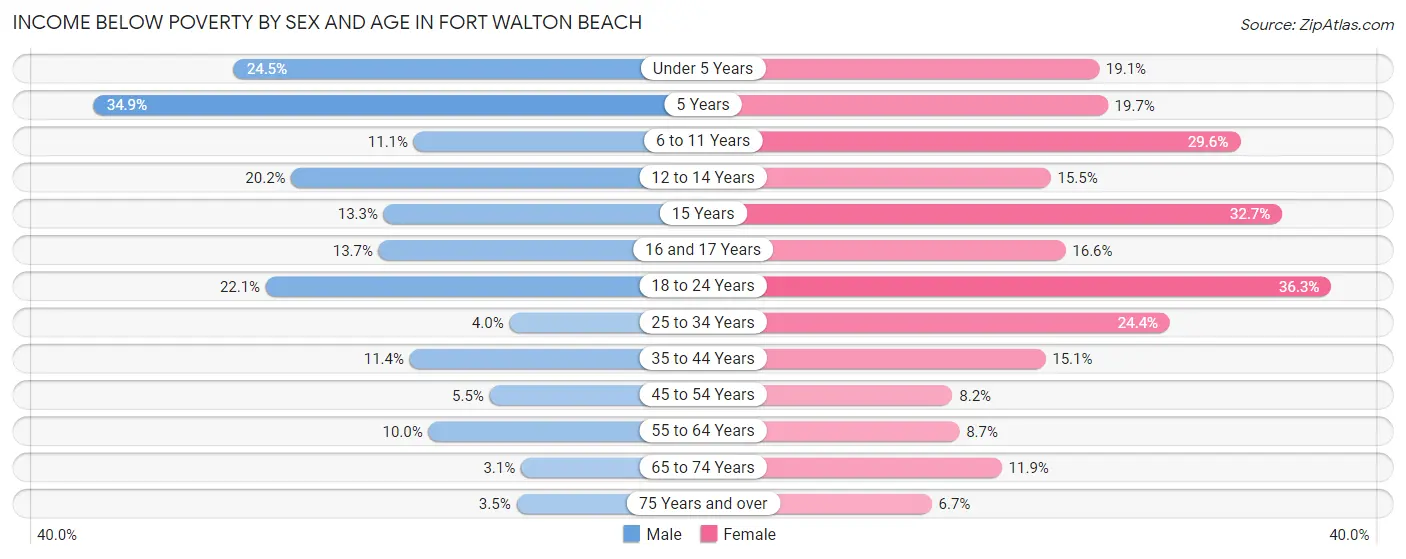
Income Below Poverty by Sex and Age in Fort Walton Beach
With 11.1% poverty level for males and 16.1% for females among the residents of Fort Walton Beach, 5 year old males and 18 to 24 year old females are the most vulnerable to poverty, with 122 males (34.9%) and 222 females (36.3%) in their respective age groups living below the poverty level.
| Age Bracket | Male | Female |
| Under 5 Years | 136 (24.5%) | 109 (19.1%) |
| 5 Years | 122 (34.9%) | 60 (19.7%) |
| 6 to 11 Years | 89 (11.1%) | 175 (29.6%) |
| 12 to 14 Years | 109 (20.2%) | 31 (15.5%) |
| 15 Years | 18 (13.3%) | 51 (32.7%) |
| 16 and 17 Years | 30 (13.7%) | 39 (16.6%) |
| 18 to 24 Years | 157 (22.1%) | 222 (36.3%) |
| 25 to 34 Years | 51 (4.0%) | 297 (24.4%) |
| 35 to 44 Years | 187 (11.4%) | 231 (15.1%) |
| 45 to 54 Years | 67 (5.5%) | 91 (8.2%) |
| 55 to 64 Years | 140 (10.0%) | 115 (8.7%) |
| 65 to 74 Years | 32 (3.1%) | 117 (11.9%) |
| 75 Years and over | 22 (3.5%) | 80 (6.7%) |
| Total | 1,160 (11.1%) | 1,618 (16.1%) |
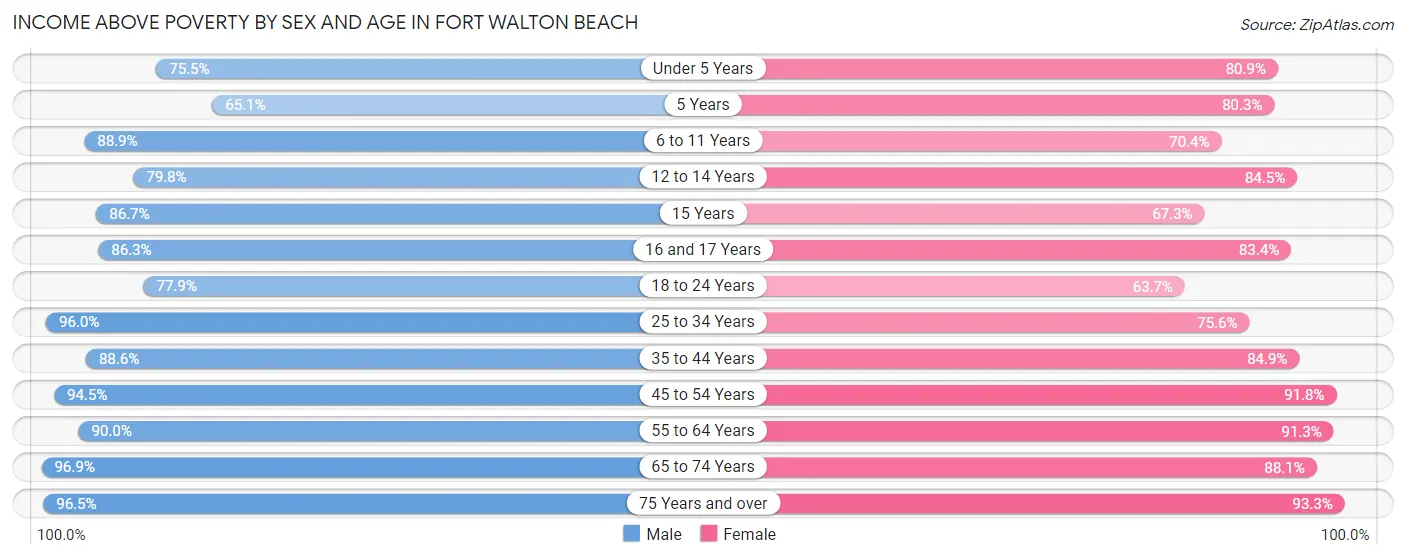
Income Above Poverty by Sex and Age in Fort Walton Beach
According to the poverty statistics in Fort Walton Beach, males aged 65 to 74 years and females aged 75 years and over are the age groups that are most secure financially, with 96.9% of males and 93.3% of females in these age groups living above the poverty line.
| Age Bracket | Male | Female |
| Under 5 Years | 420 (75.5%) | 462 (80.9%) |
| 5 Years | 228 (65.1%) | 244 (80.3%) |
| 6 to 11 Years | 713 (88.9%) | 417 (70.4%) |
| 12 to 14 Years | 431 (79.8%) | 169 (84.5%) |
| 15 Years | 117 (86.7%) | 105 (67.3%) |
| 16 and 17 Years | 189 (86.3%) | 196 (83.4%) |
| 18 to 24 Years | 554 (77.9%) | 389 (63.7%) |
| 25 to 34 Years | 1,223 (96.0%) | 922 (75.6%) |
| 35 to 44 Years | 1,454 (88.6%) | 1,298 (84.9%) |
| 45 to 54 Years | 1,157 (94.5%) | 1,018 (91.8%) |
| 55 to 64 Years | 1,258 (90.0%) | 1,204 (91.3%) |
| 65 to 74 Years | 986 (96.9%) | 869 (88.1%) |
| 75 Years and over | 611 (96.5%) | 1,120 (93.3%) |
| Total | 9,341 (88.9%) | 8,413 (83.9%) |
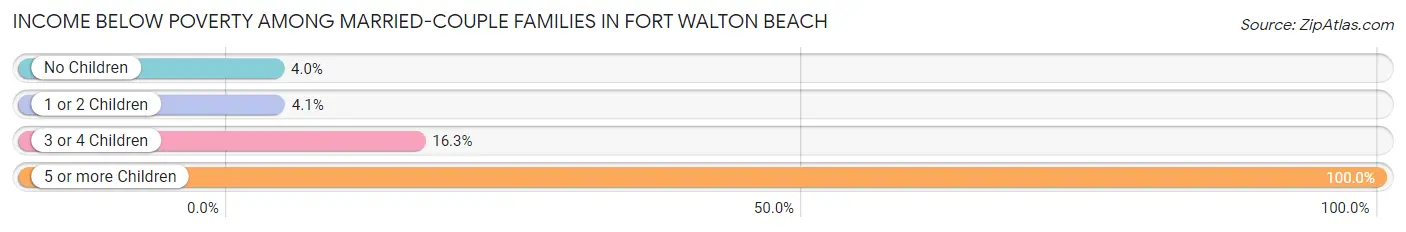
Income Below Poverty Among Married-Couple Families in Fort Walton Beach
The poverty statistics for married-couple families in Fort Walton Beach show that 5.4% or 197 of the total 3,673 families live below the poverty line. Families with 5 or more children have the highest poverty rate of 100.0%, comprising of 4 families. On the other hand, families with no children have the lowest poverty rate of 4.0%, which includes 88 families.
| Children | Above Poverty | Below Poverty |
| No Children | 2,109 (96.0%) | 88 (4.0%) |
| 1 or 2 Children | 1,059 (95.9%) | 45 (4.1%) |
| 3 or 4 Children | 308 (83.7%) | 60 (16.3%) |
| 5 or more Children | 0 (0.0%) | 4 (100.0%) |
| Total | 3,476 (94.6%) | 197 (5.4%) |
Income Below Poverty Among Single-Parent Households in Fort Walton Beach
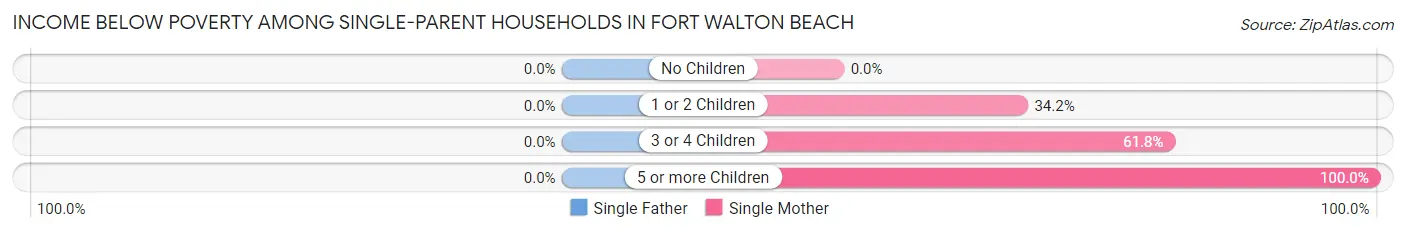
| Children | Single Father | Single Mother |
| No Children | 0 (0.0%) | 0 (0.0%) |
| 1 or 2 Children | 0 (0.0%) | 177 (34.2%) |
| 3 or 4 Children | 0 (0.0%) | 63 (61.8%) |
| 5 or more Children | 0 (0.0%) | 17 (100.0%) |
| Total | 0 (0.0%) | 257 (26.6%) |
Income Below Poverty Among Married-Couple vs Single-Parent Households in Fort Walton Beach
The poverty data for Fort Walton Beach shows that 197 of the married-couple family households (5.4%) and 257 of the single-parent households (18.3%) are living below the poverty level. Within the married-couple family households, those with 5 or more children have the highest poverty rate, with 4 households (100.0%) falling below the poverty line. Among the single-parent households, those with 5 or more children have the highest poverty rate, with 17 household (100.0%) living below poverty.
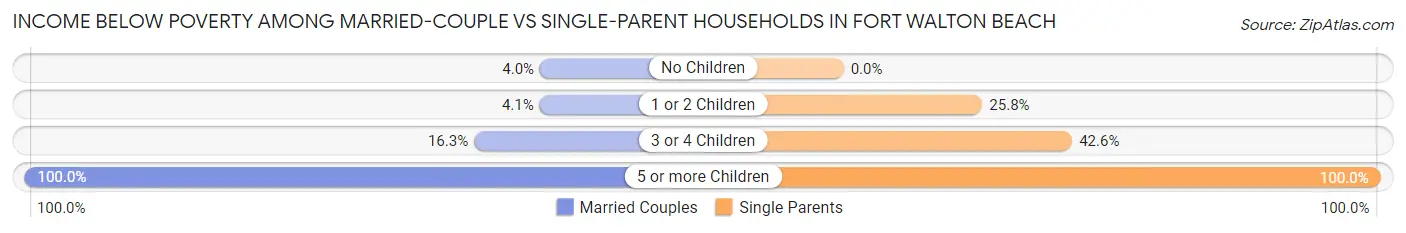
| Children | Married-Couple Families | Single-Parent Households |
| No Children | 88 (4.0%) | 0 (0.0%) |
| 1 or 2 Children | 45 (4.1%) | 177 (25.8%) |
| 3 or 4 Children | 60 (16.3%) | 63 (42.6%) |
| 5 or more Children | 4 (100.0%) | 17 (100.0%) |
| Total | 197 (5.4%) | 257 (18.3%) |
Race in Fort Walton Beach
The most populous races in Fort Walton Beach are White / Caucasian (14,787 | 70.7%), Hispanic or Latino (2,329 | 11.1%), and Black / African American (2,314 | 11.1%).
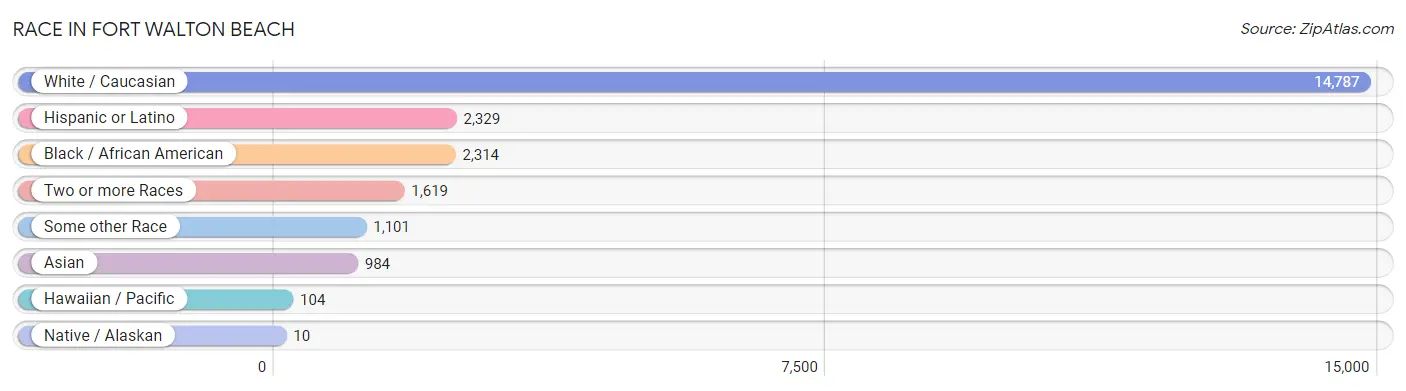
| Race | # Population | % Population |
| Asian | 984 | 4.7% |
| Black / African American | 2,314 | 11.1% |
| Hawaiian / Pacific | 104 | 0.5% |
| Hispanic or Latino | 2,329 | 11.1% |
| Native / Alaskan | 10 | 0.1% |
| White / Caucasian | 14,787 | 70.7% |
| Two or more Races | 1,619 | 7.7% |
| Some other Race | 1,101 | 5.3% |
| Total | 20,919 | 100.0% |
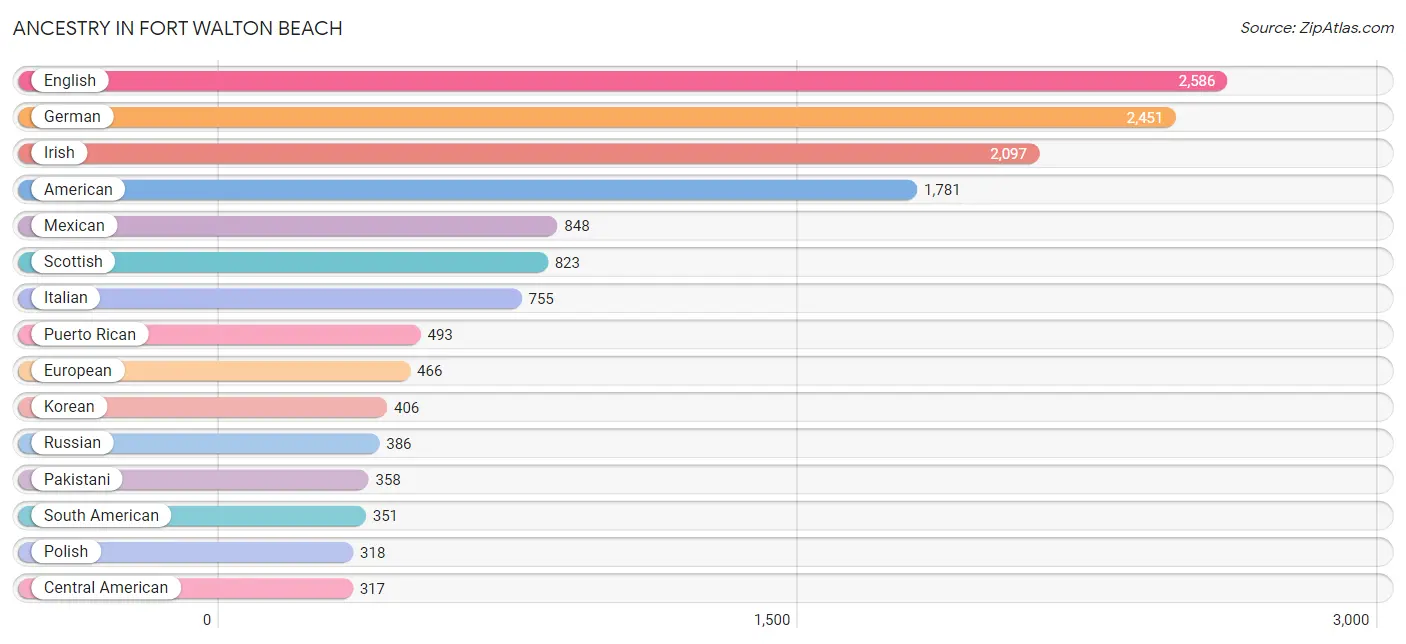
Ancestry in Fort Walton Beach
The most populous ancestries reported in Fort Walton Beach are English (2,586 | 12.4%), German (2,451 | 11.7%), Irish (2,097 | 10.0%), American (1,781 | 8.5%), and Mexican (848 | 4.1%), together accounting for 46.7% of all Fort Walton Beach residents.
| Ancestry | # Population | % Population |
| African | 29 | 0.1% |
| American | 1,781 | 8.5% |
| Arab | 53 | 0.3% |
| Argentinean | 42 | 0.2% |
| Australian | 7 | 0.0% |
| Austrian | 8 | 0.0% |
| Belgian | 53 | 0.3% |
| Belizean | 2 | 0.0% |
| Bhutanese | 91 | 0.4% |
| Brazilian | 29 | 0.1% |
| British | 294 | 1.4% |
| Bulgarian | 4 | 0.0% |
| Burmese | 176 | 0.8% |
| Canadian | 50 | 0.2% |
| Central American | 317 | 1.5% |
| Central American Indian | 35 | 0.2% |
| Cherokee | 62 | 0.3% |
| Colombian | 139 | 0.7% |
| Costa Rican | 10 | 0.1% |
| Cree | 15 | 0.1% |
| Croatian | 23 | 0.1% |
| Cuban | 88 | 0.4% |
| Czech | 11 | 0.1% |
| Czechoslovakian | 6 | 0.0% |
| Danish | 24 | 0.1% |
| Dominican | 1 | 0.0% |
| Dutch | 185 | 0.9% |
| Dutch West Indian | 52 | 0.3% |
| Ecuadorian | 69 | 0.3% |
| English | 2,586 | 12.4% |
| Estonian | 17 | 0.1% |
| European | 466 | 2.2% |
| Finnish | 79 | 0.4% |
| French | 230 | 1.1% |
| French Canadian | 172 | 0.8% |
| German | 2,451 | 11.7% |
| Greek | 259 | 1.2% |
| Guamanian / Chamorro | 104 | 0.5% |
| Guatemalan | 68 | 0.3% |
| Haitian | 51 | 0.2% |
| Honduran | 172 | 0.8% |
| Hungarian | 11 | 0.1% |
| Indian (Asian) | 131 | 0.6% |
| Irish | 2,097 | 10.0% |
| Italian | 755 | 3.6% |
| Jamaican | 102 | 0.5% |
| Korean | 406 | 1.9% |
| Laotian | 32 | 0.2% |
| Lebanese | 7 | 0.0% |
| Liberian | 19 | 0.1% |
| Lithuanian | 12 | 0.1% |
| Macedonian | 7 | 0.0% |
| Malaysian | 8 | 0.0% |
| Mexican | 848 | 4.1% |
| Native Hawaiian | 28 | 0.1% |
| Nicaraguan | 26 | 0.1% |
| Nigerian | 35 | 0.2% |
| Northern European | 48 | 0.2% |
| Norwegian | 115 | 0.5% |
| Pakistani | 358 | 1.7% |
| Panamanian | 41 | 0.2% |
| Peruvian | 3 | 0.0% |
| Polish | 318 | 1.5% |
| Portuguese | 124 | 0.6% |
| Puerto Rican | 493 | 2.4% |
| Romanian | 7 | 0.0% |
| Russian | 386 | 1.8% |
| Scandinavian | 42 | 0.2% |
| Scotch-Irish | 235 | 1.1% |
| Scottish | 823 | 3.9% |
| Serbian | 10 | 0.1% |
| Sioux | 55 | 0.3% |
| South American | 351 | 1.7% |
| Spaniard | 24 | 0.1% |
| Spanish | 73 | 0.4% |
| Sri Lankan | 216 | 1.0% |
| Subsaharan African | 83 | 0.4% |
| Swedish | 177 | 0.9% |
| Swiss | 42 | 0.2% |
| Syrian | 6 | 0.0% |
| Thai | 37 | 0.2% |
| Trinidadian and Tobagonian | 13 | 0.1% |
| Turkish | 67 | 0.3% |
| Ukrainian | 9 | 0.0% |
| Venezuelan | 98 | 0.5% |
| Welsh | 201 | 1.0% |
| West Indian | 35 | 0.2% | View All 87 Rows |
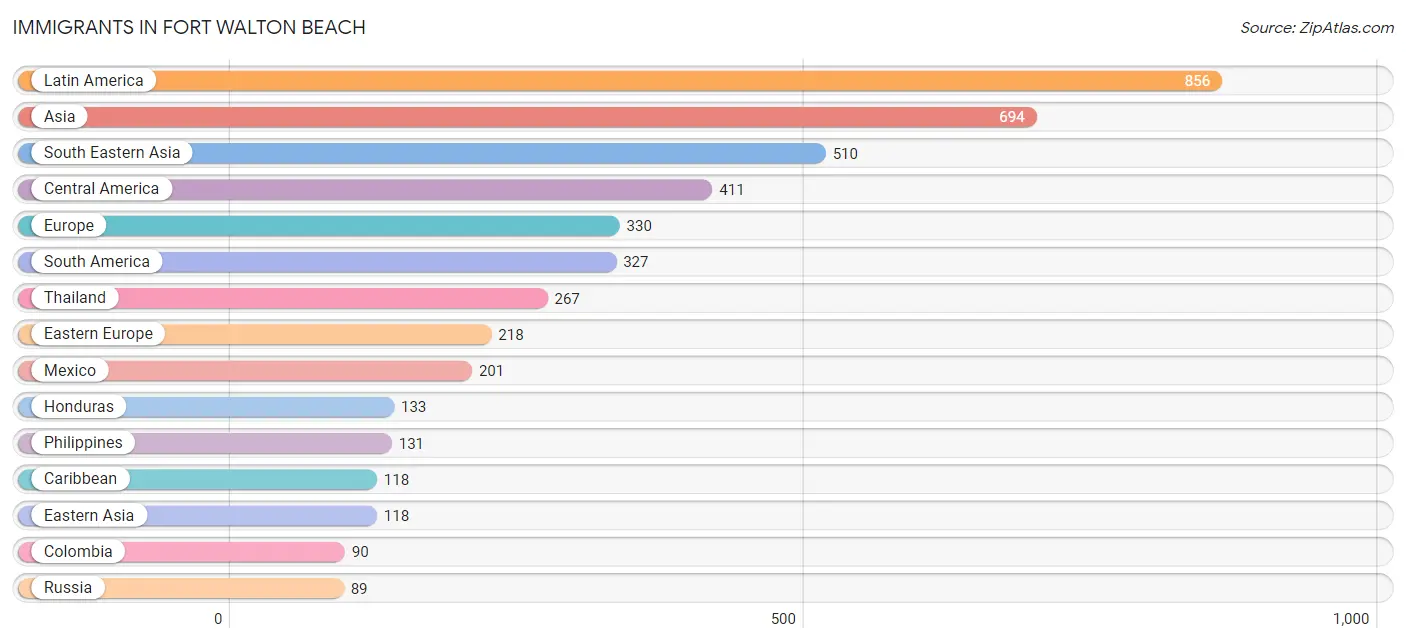
Immigrants in Fort Walton Beach
The most numerous immigrant groups reported in Fort Walton Beach came from Latin America (856 | 4.1%), Asia (694 | 3.3%), South Eastern Asia (510 | 2.4%), Central America (411 | 2.0%), and Europe (330 | 1.6%), together accounting for 13.4% of all Fort Walton Beach residents.
| Immigration Origin | # Population | % Population |
| Africa | 32 | 0.2% |
| Argentina | 42 | 0.2% |
| Asia | 694 | 3.3% |
| Australia | 4 | 0.0% |
| Belgium | 8 | 0.0% |
| Brazil | 81 | 0.4% |
| Bulgaria | 16 | 0.1% |
| Canada | 23 | 0.1% |
| Caribbean | 118 | 0.6% |
| Central America | 411 | 2.0% |
| China | 50 | 0.2% |
| Colombia | 90 | 0.4% |
| Costa Rica | 10 | 0.1% |
| Cuba | 39 | 0.2% |
| Czechoslovakia | 34 | 0.2% |
| Denmark | 8 | 0.0% |
| Dominican Republic | 1 | 0.0% |
| Eastern Asia | 118 | 0.6% |
| Eastern Europe | 218 | 1.0% |
| Ecuador | 69 | 0.3% |
| England | 21 | 0.1% |
| Europe | 330 | 1.6% |
| France | 16 | 0.1% |
| Germany | 52 | 0.3% |
| Guatemala | 47 | 0.2% |
| Honduras | 133 | 0.6% |
| India | 13 | 0.1% |
| Indonesia | 32 | 0.2% |
| Italy | 5 | 0.0% |
| Jamaica | 78 | 0.4% |
| Japan | 26 | 0.1% |
| Korea | 42 | 0.2% |
| Kuwait | 7 | 0.0% |
| Latin America | 856 | 4.1% |
| Liberia | 19 | 0.1% |
| Mexico | 201 | 1.0% |
| Moldova | 7 | 0.0% |
| Morocco | 13 | 0.1% |
| Nicaragua | 8 | 0.0% |
| Northern Africa | 13 | 0.1% |
| Northern Europe | 31 | 0.2% |
| Oceania | 4 | 0.0% |
| Panama | 12 | 0.1% |
| Peru | 1 | 0.0% |
| Philippines | 131 | 0.6% |
| Poland | 32 | 0.2% |
| Romania | 13 | 0.1% |
| Russia | 89 | 0.4% |
| Serbia | 10 | 0.1% |
| South America | 327 | 1.6% |
| South Central Asia | 24 | 0.1% |
| South Eastern Asia | 510 | 2.4% |
| Southern Europe | 5 | 0.0% |
| Thailand | 267 | 1.3% |
| Turkey | 29 | 0.1% |
| Venezuela | 44 | 0.2% |
| Vietnam | 80 | 0.4% |
| Western Africa | 19 | 0.1% |
| Western Asia | 42 | 0.2% |
| Western Europe | 76 | 0.4% | View All 60 Rows |
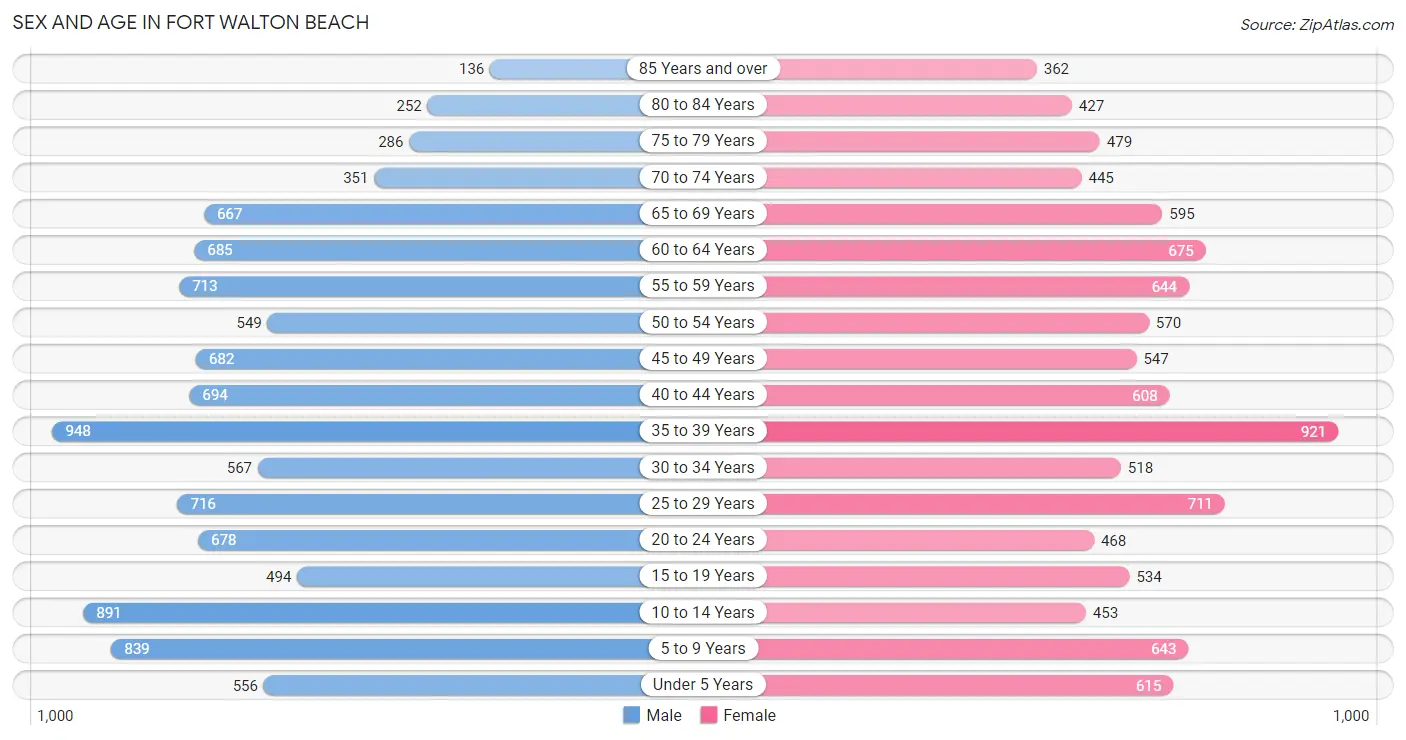
Sex and Age in Fort Walton Beach
Sex and Age in Fort Walton Beach
The most populous age groups in Fort Walton Beach are 35 to 39 Years (948 | 8.9%) for men and 35 to 39 Years (921 | 9.0%) for women.
| Age Bracket | Male | Female |
| Under 5 Years | 556 (5.2%) | 615 (6.0%) |
| 5 to 9 Years | 839 (7.8%) | 643 (6.3%) |
| 10 to 14 Years | 891 (8.3%) | 453 (4.4%) |
| 15 to 19 Years | 494 (4.6%) | 534 (5.2%) |
| 20 to 24 Years | 678 (6.3%) | 468 (4.6%) |
| 25 to 29 Years | 716 (6.7%) | 711 (7.0%) |
| 30 to 34 Years | 567 (5.3%) | 518 (5.1%) |
| 35 to 39 Years | 948 (8.9%) | 921 (9.0%) |
| 40 to 44 Years | 694 (6.5%) | 608 (5.9%) |
| 45 to 49 Years | 682 (6.4%) | 547 (5.3%) |
| 50 to 54 Years | 549 (5.1%) | 570 (5.6%) |
| 55 to 59 Years | 713 (6.7%) | 644 (6.3%) |
| 60 to 64 Years | 685 (6.4%) | 675 (6.6%) |
| 65 to 69 Years | 667 (6.2%) | 595 (5.8%) |
| 70 to 74 Years | 351 (3.3%) | 445 (4.4%) |
| 75 to 79 Years | 286 (2.7%) | 479 (4.7%) |
| 80 to 84 Years | 252 (2.4%) | 427 (4.2%) |
| 85 Years and over | 136 (1.3%) | 362 (3.5%) |
| Total | 10,704 (100.0%) | 10,215 (100.0%) |
Families and Households in Fort Walton Beach
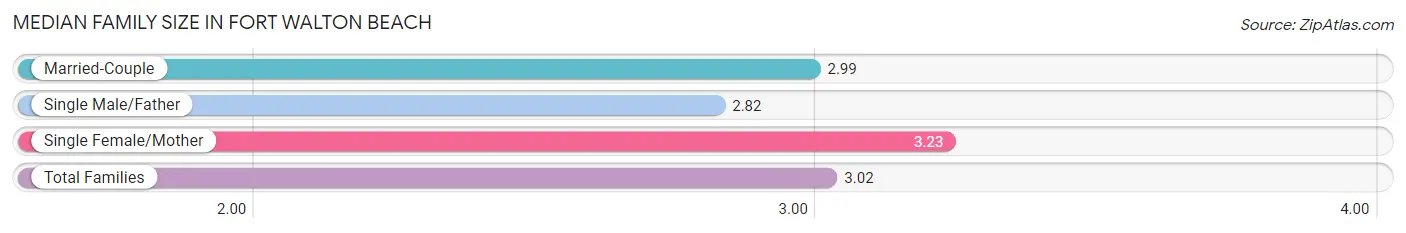
Median Family Size in Fort Walton Beach
The median family size in Fort Walton Beach is 3.02 persons per family, with single female/mother families (966 | 19.0%) accounting for the largest median family size of 3.23 persons per family. On the other hand, single male/father families (439 | 8.6%) represent the smallest median family size with 2.82 persons per family.
| Family Type | # Families | Family Size |
| Married-Couple | 3,673 (72.3%) | 2.99 |
| Single Male/Father | 439 (8.6%) | 2.82 |
| Single Female/Mother | 966 (19.0%) | 3.23 |
| Total Families | 5,078 (100.0%) | 3.02 |
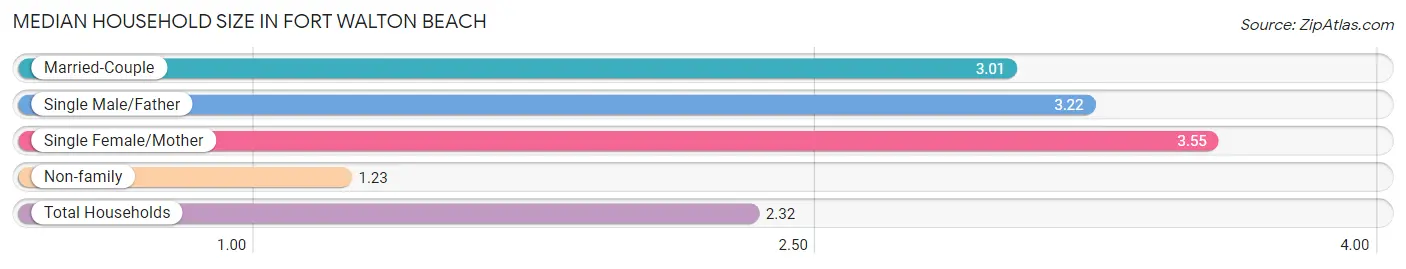
Median Household Size in Fort Walton Beach
The median household size in Fort Walton Beach is 2.32 persons per household, with single female/mother households (966 | 10.9%) accounting for the largest median household size of 3.55 persons per household. non-family households (3,762 | 42.6%) represent the smallest median household size with 1.23 persons per household.
| Household Type | # Households | Household Size |
| Married-Couple | 3,673 (41.5%) | 3.01 |
| Single Male/Father | 439 (5.0%) | 3.22 |
| Single Female/Mother | 966 (10.9%) | 3.55 |
| Non-family | 3,762 (42.6%) | 1.23 |
| Total Households | 8,840 (100.0%) | 2.32 |
Household Size by Marriage Status in Fort Walton Beach
Out of a total of 8,840 households in Fort Walton Beach, 5,078 (57.4%) are family households, while 3,762 (42.6%) are nonfamily households. The most numerous type of family households are 2-person households, comprising 2,344, and the most common type of nonfamily households are 1-person households, comprising 3,230.
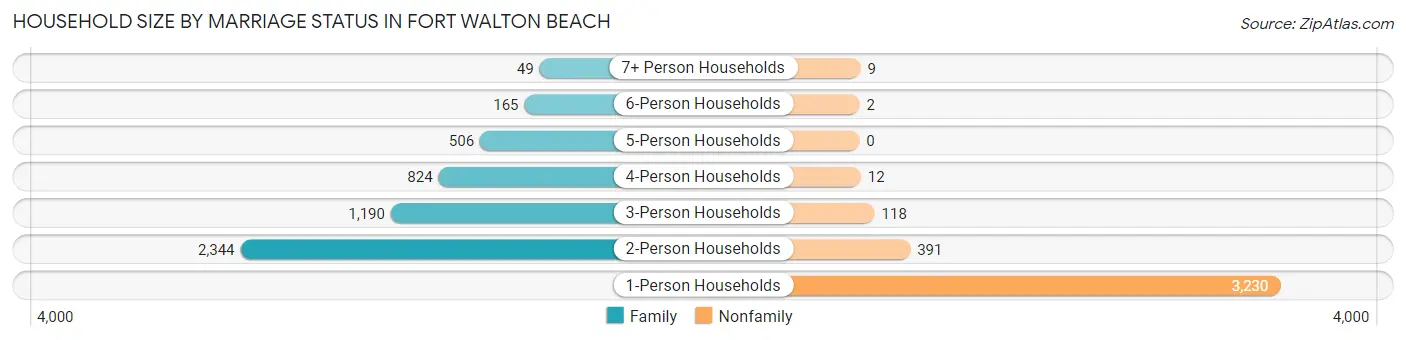
| Household Size | Family Households | Nonfamily Households |
| 1-Person Households | - | 3,230 (36.5%) |
| 2-Person Households | 2,344 (26.5%) | 391 (4.4%) |
| 3-Person Households | 1,190 (13.5%) | 118 (1.3%) |
| 4-Person Households | 824 (9.3%) | 12 (0.1%) |
| 5-Person Households | 506 (5.7%) | 0 (0.0%) |
| 6-Person Households | 165 (1.9%) | 2 (0.0%) |
| 7+ Person Households | 49 (0.5%) | 9 (0.1%) |
| Total | 5,078 (57.4%) | 3,762 (42.6%) |
Female Fertility in Fort Walton Beach
Fertility by Age in Fort Walton Beach
Average fertility rate in Fort Walton Beach is 69.0 births per 1,000 women. Women in the age bracket of 20 to 34 years have the highest fertility rate with 148.0 births per 1,000 women. Women in the age bracket of 20 to 34 years acount for 82.9% of all women with births.
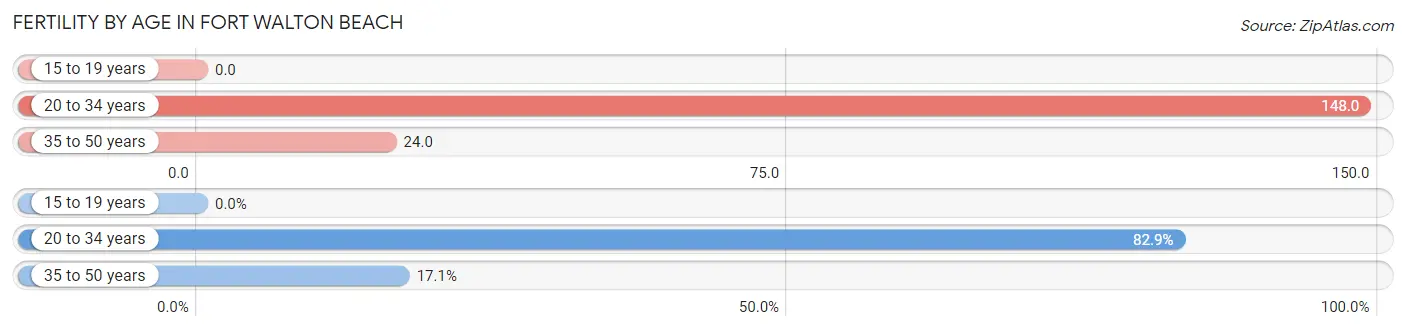
| Age Bracket | Women with Births | Births / 1,000 Women |
| 15 to 19 years | 0 (0.0%) | 0.0 |
| 20 to 34 years | 252 (82.9%) | 148.0 |
| 35 to 50 years | 52 (17.1%) | 24.0 |
| Total | 304 (100.0%) | 69.0 |
Fertility by Age by Marriage Status in Fort Walton Beach
69.4% of women with births (304) in Fort Walton Beach are married. The highest percentage of unmarried women with births falls into 20 to 34 years age bracket with 36.9% of them unmarried at the time of birth, while the lowest percentage of unmarried women with births belong to 35 to 50 years age bracket with 0.0% of them unmarried.
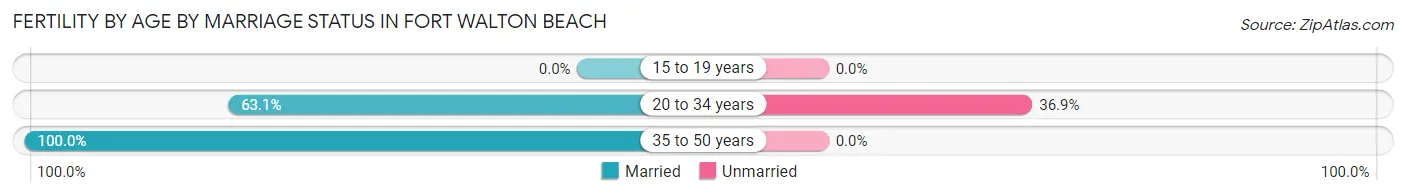
| Age Bracket | Married | Unmarried |
| 15 to 19 years | 0 (0.0%) | 0 (0.0%) |
| 20 to 34 years | 159 (63.1%) | 93 (36.9%) |
| 35 to 50 years | 52 (100.0%) | 0 (0.0%) |
| Total | 211 (69.4%) | 93 (30.6%) |
Fertility by Education in Fort Walton Beach
Average fertility rate in Fort Walton Beach is 69.0 births per 1,000 women. Women with the education attainment of college or associate's degree have the highest fertility rate of 95.0 births per 1,000 women, while women with the education attainment of graduate degree have the lowest fertility at 21.0 births per 1,000 women. Women with the education attainment of college or associate's degree represent 44.4% of all women with births.
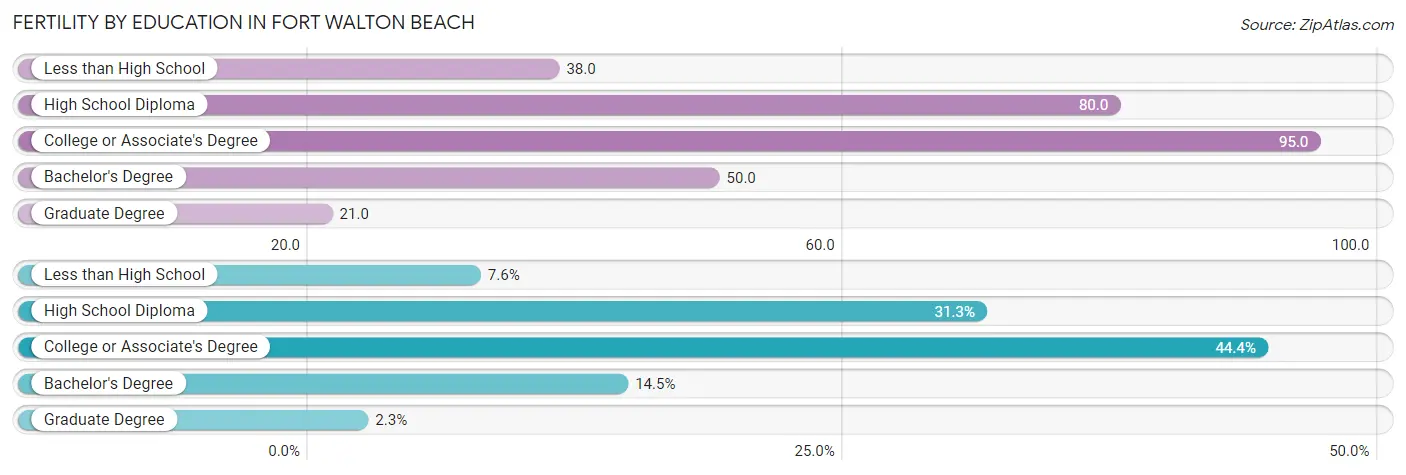
| Educational Attainment | Women with Births | Births / 1,000 Women |
| Less than High School | 23 (7.6%) | 38.0 |
| High School Diploma | 95 (31.2%) | 80.0 |
| College or Associate's Degree | 135 (44.4%) | 95.0 |
| Bachelor's Degree | 44 (14.5%) | 50.0 |
| Graduate Degree | 7 (2.3%) | 21.0 |
| Total | 304 (100.0%) | 69.0 |
Fertility by Education by Marriage Status in Fort Walton Beach
30.6% of women with births in Fort Walton Beach are unmarried. Women with the educational attainment of graduate degree are most likely to be married with 100.0% of them married at childbirth, while women with the educational attainment of less than high school are least likely to be married with 100.0% of them unmarried at childbirth.
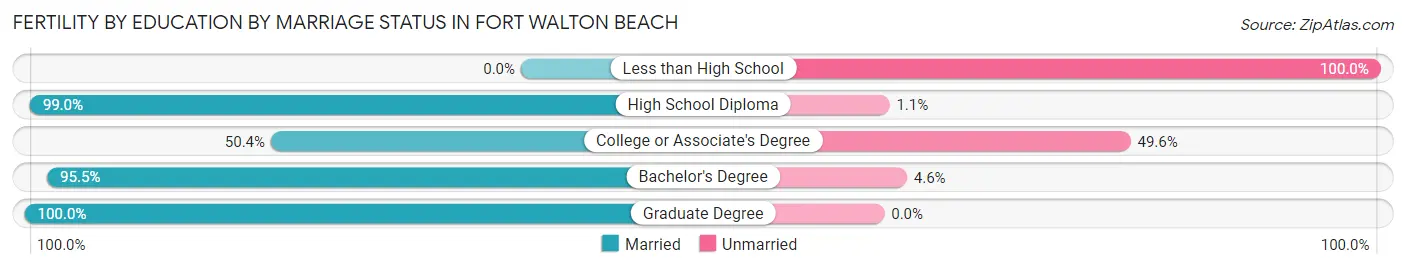
| Educational Attainment | Married | Unmarried |
| Less than High School | 0 (0.0%) | 23 (100.0%) |
| High School Diploma | 94 (99.0%) | 1 (1.1%) |
| College or Associate's Degree | 68 (50.4%) | 67 (49.6%) |
| Bachelor's Degree | 42 (95.5%) | 2 (4.5%) |
| Graduate Degree | 7 (100.0%) | 0 (0.0%) |
| Total | 211 (69.4%) | 93 (30.6%) |
Employment Characteristics in Fort Walton Beach
Employment by Class of Employer in Fort Walton Beach
Among the 10,521 employed individuals in Fort Walton Beach, private company employees (6,620 | 62.9%), federal government employees (1,613 | 15.3%), and self-employed (not incorporated) (796 | 7.6%) make up the most common classes of employment.
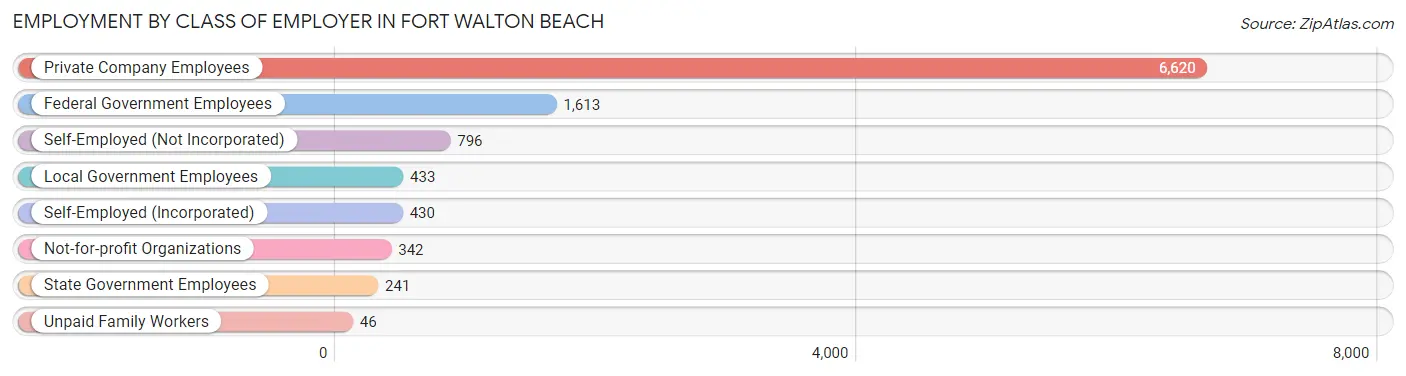
| Employer Class | # Employees | % Employees |
| Private Company Employees | 6,620 | 62.9% |
| Self-Employed (Incorporated) | 430 | 4.1% |
| Self-Employed (Not Incorporated) | 796 | 7.6% |
| Not-for-profit Organizations | 342 | 3.3% |
| Local Government Employees | 433 | 4.1% |
| State Government Employees | 241 | 2.3% |
| Federal Government Employees | 1,613 | 15.3% |
| Unpaid Family Workers | 46 | 0.4% |
| Total | 10,521 | 100.0% |
Employment Status by Age in Fort Walton Beach
According to the labor force statistics for Fort Walton Beach, out of the total population over 16 years of age (16,631), 66.4% or 11,043 individuals are in the labor force, with 3.9% or 431 of them unemployed. The age group with the highest labor force participation rate is 30 to 34 years, with 88.8% or 963 individuals in the labor force. Within the labor force, the 55 to 59 years age range has the highest percentage of unemployed individuals, with 5.9% or 59 of them being unemployed.
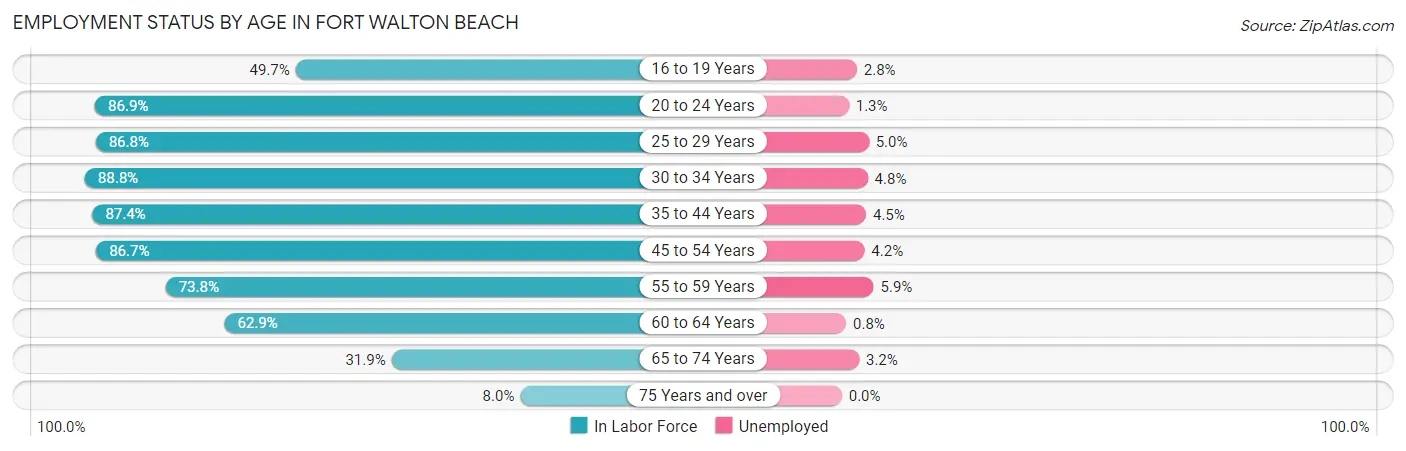
| Age Bracket | In Labor Force | Unemployed |
| 16 to 19 Years | 366 (49.7%) | 10 (2.8%) |
| 20 to 24 Years | 996 (86.9%) | 13 (1.3%) |
| 25 to 29 Years | 1,239 (86.8%) | 62 (5.0%) |
| 30 to 34 Years | 963 (88.8%) | 46 (4.8%) |
| 35 to 44 Years | 2,771 (87.4%) | 125 (4.5%) |
| 45 to 54 Years | 2,036 (86.7%) | 86 (4.2%) |
| 55 to 59 Years | 1,001 (73.8%) | 59 (5.9%) |
| 60 to 64 Years | 855 (62.9%) | 7 (0.8%) |
| 65 to 74 Years | 657 (31.9%) | 21 (3.2%) |
| 75 Years and over | 155 (8.0%) | 0 (0.0%) |
| Total | 11,043 (66.4%) | 431 (3.9%) |
Employment Status by Educational Attainment in Fort Walton Beach
According to labor force statistics for Fort Walton Beach, 82.5% of individuals (8,867) out of the total population between 25 and 64 years of age (10,748) are in the labor force, with 4.3% or 381 of them being unemployed. The group with the highest labor force participation rate are those with the educational attainment of bachelor's degree or higher, with 86.7% or 2,637 individuals in the labor force. Within the labor force, individuals with less than high school education have the highest percentage of unemployment, with 16.0% or 101 of them being unemployed.
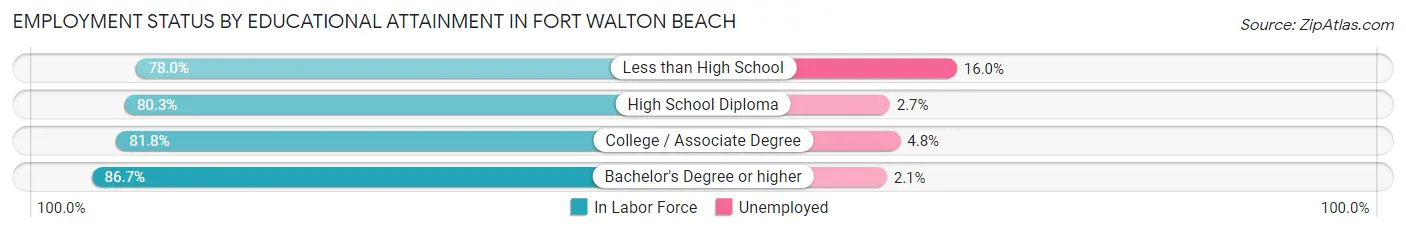
| Educational Attainment | In Labor Force | Unemployed |
| Less than High School | 633 (78.0%) | 130 (16.0%) |
| High School Diploma | 2,440 (80.3%) | 82 (2.7%) |
| College / Associate Degree | 3,154 (81.8%) | 185 (4.8%) |
| Bachelor's Degree or higher | 2,637 (86.7%) | 64 (2.1%) |
| Total | 8,867 (82.5%) | 462 (4.3%) |
Employment Occupations by Sex in Fort Walton Beach
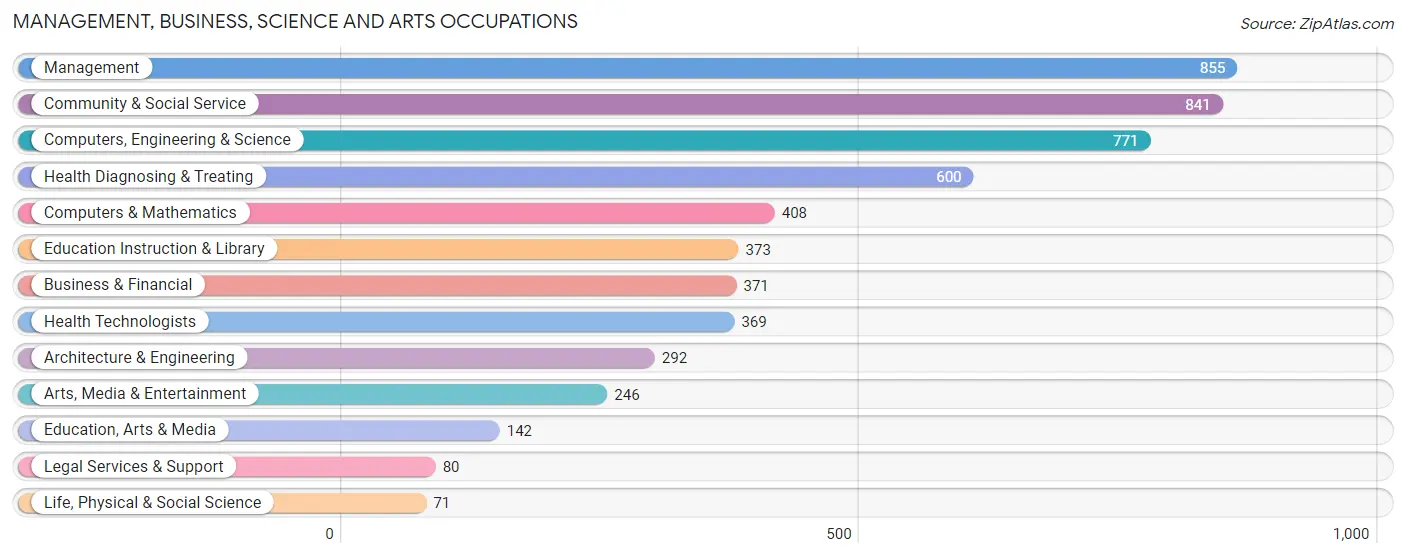
Management, Business, Science and Arts Occupations
The most common Management, Business, Science and Arts occupations in Fort Walton Beach are Management (855 | 8.7%), Community & Social Service (841 | 8.6%), Computers, Engineering & Science (771 | 7.9%), Health Diagnosing & Treating (600 | 6.1%), and Computers & Mathematics (408 | 4.2%).
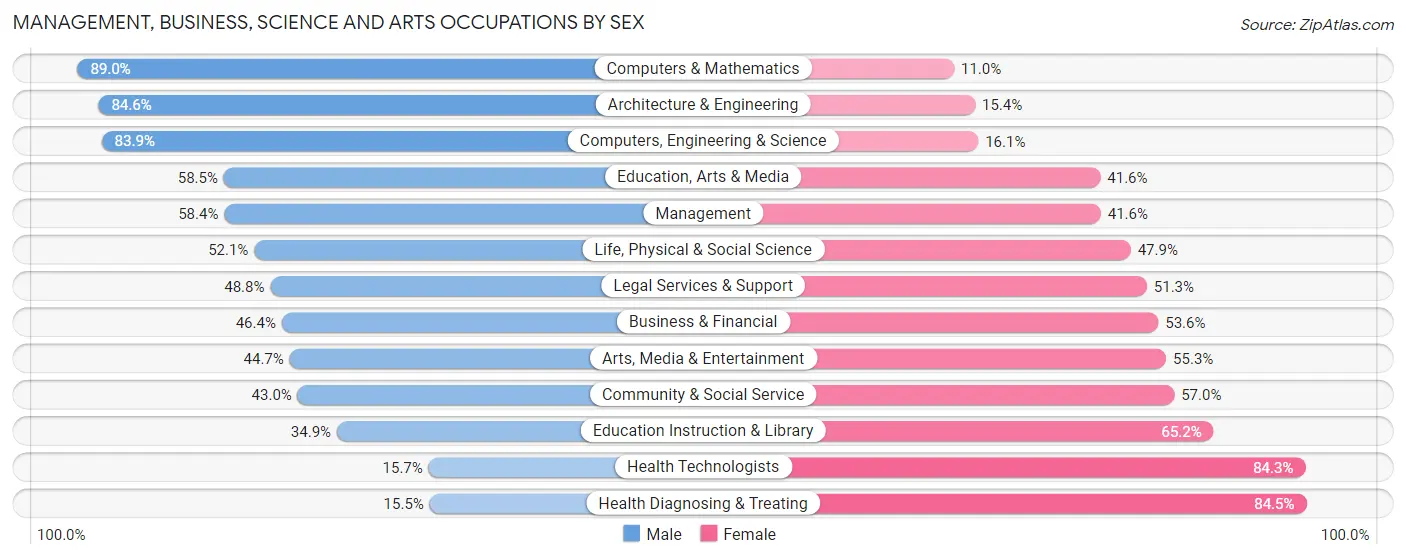
Management, Business, Science and Arts Occupations by Sex
Within the Management, Business, Science and Arts occupations in Fort Walton Beach, the most male-oriented occupations are Computers & Mathematics (89.0%), Architecture & Engineering (84.6%), and Computers, Engineering & Science (83.9%), while the most female-oriented occupations are Health Diagnosing & Treating (84.5%), Health Technologists (84.3%), and Education Instruction & Library (65.1%).
| Occupation | Male | Female |
| Management | 499 (58.4%) | 356 (41.6%) |
| Business & Financial | 172 (46.4%) | 199 (53.6%) |
| Computers, Engineering & Science | 647 (83.9%) | 124 (16.1%) |
| Computers & Mathematics | 363 (89.0%) | 45 (11.0%) |
| Architecture & Engineering | 247 (84.6%) | 45 (15.4%) |
| Life, Physical & Social Science | 37 (52.1%) | 34 (47.9%) |
| Community & Social Service | 362 (43.0%) | 479 (57.0%) |
| Education, Arts & Media | 83 (58.5%) | 59 (41.5%) |
| Legal Services & Support | 39 (48.7%) | 41 (51.2%) |
| Education Instruction & Library | 130 (34.8%) | 243 (65.1%) |
| Arts, Media & Entertainment | 110 (44.7%) | 136 (55.3%) |
| Health Diagnosing & Treating | 93 (15.5%) | 507 (84.5%) |
| Health Technologists | 58 (15.7%) | 311 (84.3%) |
| Total (Category) | 1,773 (51.6%) | 1,665 (48.4%) |
| Total (Overall) | 5,201 (53.2%) | 4,581 (46.8%) |
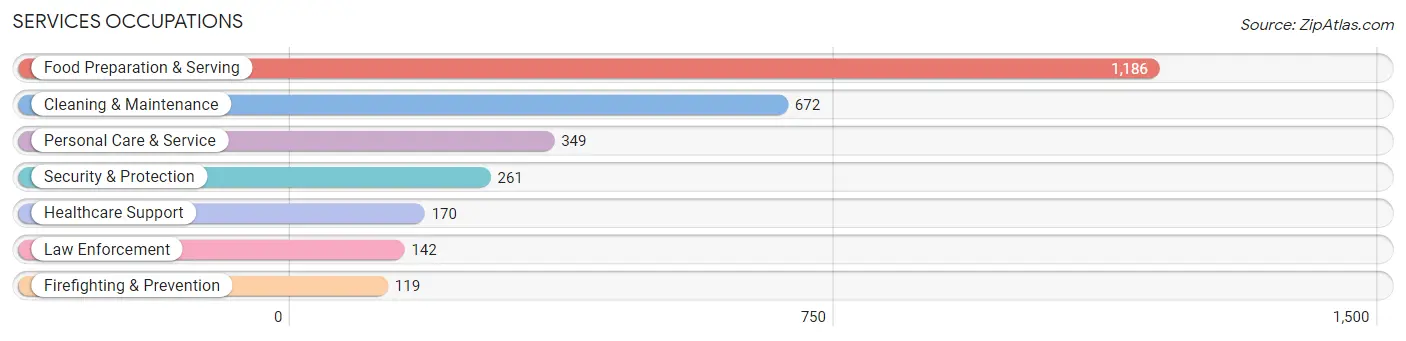
Services Occupations
The most common Services occupations in Fort Walton Beach are Food Preparation & Serving (1,186 | 12.1%), Cleaning & Maintenance (672 | 6.9%), Personal Care & Service (349 | 3.6%), Security & Protection (261 | 2.7%), and Healthcare Support (170 | 1.7%).
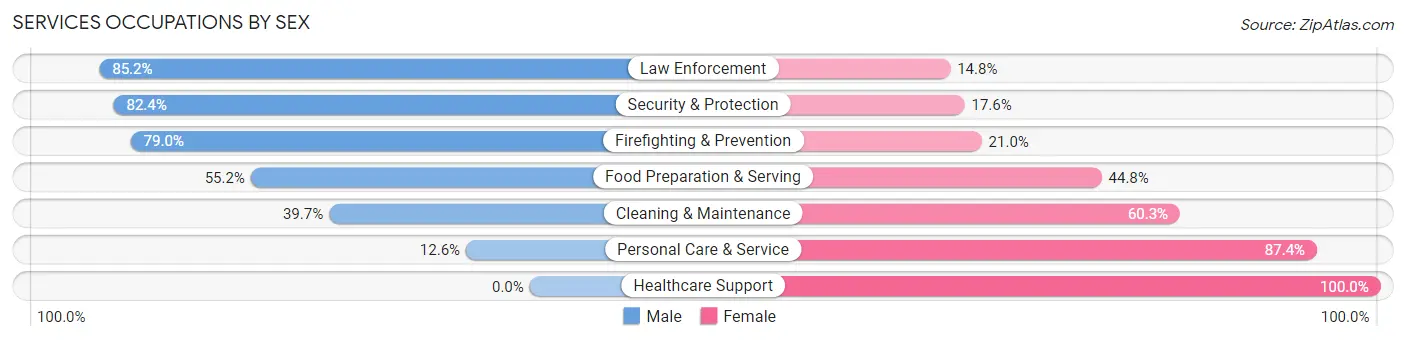
Services Occupations by Sex
Within the Services occupations in Fort Walton Beach, the most male-oriented occupations are Law Enforcement (85.2%), Security & Protection (82.4%), and Firefighting & Prevention (79.0%), while the most female-oriented occupations are Healthcare Support (100.0%), Personal Care & Service (87.4%), and Cleaning & Maintenance (60.3%).
| Occupation | Male | Female |
| Healthcare Support | 0 (0.0%) | 170 (100.0%) |
| Security & Protection | 215 (82.4%) | 46 (17.6%) |
| Firefighting & Prevention | 94 (79.0%) | 25 (21.0%) |
| Law Enforcement | 121 (85.2%) | 21 (14.8%) |
| Food Preparation & Serving | 655 (55.2%) | 531 (44.8%) |
| Cleaning & Maintenance | 267 (39.7%) | 405 (60.3%) |
| Personal Care & Service | 44 (12.6%) | 305 (87.4%) |
| Total (Category) | 1,181 (44.8%) | 1,457 (55.2%) |
| Total (Overall) | 5,201 (53.2%) | 4,581 (46.8%) |
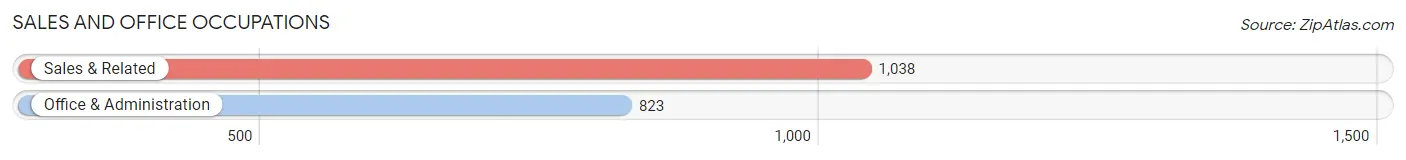
Sales and Office Occupations
The most common Sales and Office occupations in Fort Walton Beach are Sales & Related (1,038 | 10.6%), and Office & Administration (823 | 8.4%).
Sales and Office Occupations by Sex
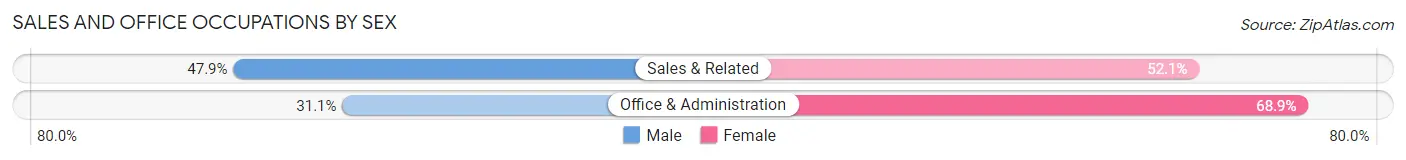
| Occupation | Male | Female |
| Sales & Related | 497 (47.9%) | 541 (52.1%) |
| Office & Administration | 256 (31.1%) | 567 (68.9%) |
| Total (Category) | 753 (40.5%) | 1,108 (59.5%) |
| Total (Overall) | 5,201 (53.2%) | 4,581 (46.8%) |
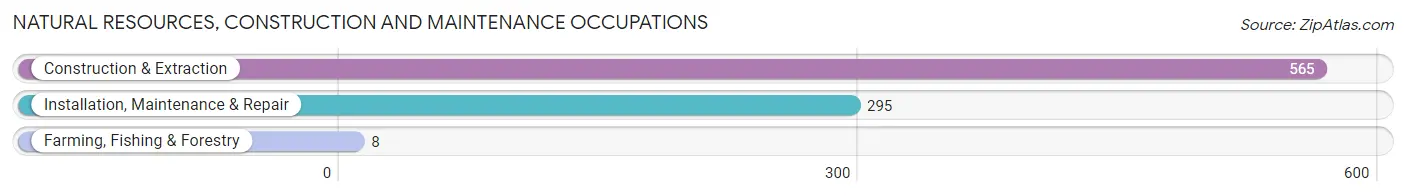
Natural Resources, Construction and Maintenance Occupations
The most common Natural Resources, Construction and Maintenance occupations in Fort Walton Beach are Construction & Extraction (565 | 5.8%), Installation, Maintenance & Repair (295 | 3.0%), and Farming, Fishing & Forestry (8 | 0.1%).
Natural Resources, Construction and Maintenance Occupations by Sex
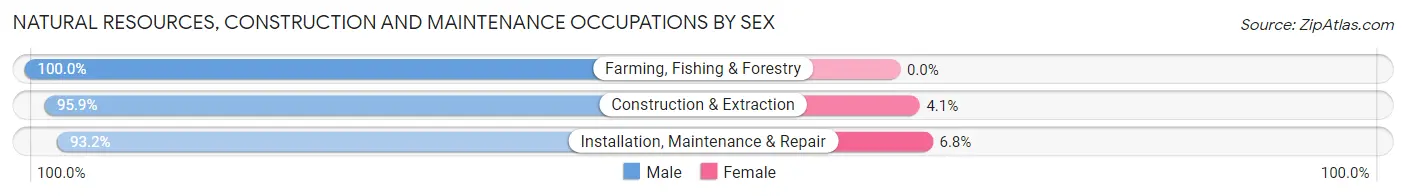
| Occupation | Male | Female |
| Farming, Fishing & Forestry | 8 (100.0%) | 0 (0.0%) |
| Construction & Extraction | 542 (95.9%) | 23 (4.1%) |
| Installation, Maintenance & Repair | 275 (93.2%) | 20 (6.8%) |
| Total (Category) | 825 (95.1%) | 43 (5.0%) |
| Total (Overall) | 5,201 (53.2%) | 4,581 (46.8%) |
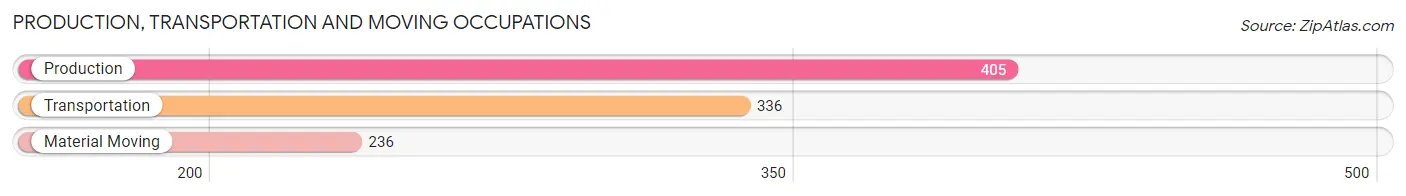
Production, Transportation and Moving Occupations
The most common Production, Transportation and Moving occupations in Fort Walton Beach are Production (405 | 4.1%), Transportation (336 | 3.4%), and Material Moving (236 | 2.4%).
Production, Transportation and Moving Occupations by Sex
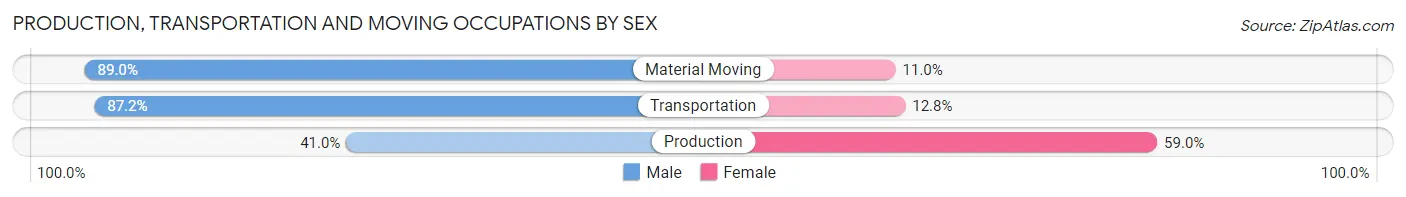
| Occupation | Male | Female |
| Production | 166 (41.0%) | 239 (59.0%) |
| Transportation | 293 (87.2%) | 43 (12.8%) |
| Material Moving | 210 (89.0%) | 26 (11.0%) |
| Total (Category) | 669 (68.5%) | 308 (31.5%) |
| Total (Overall) | 5,201 (53.2%) | 4,581 (46.8%) |
Employment Industries by Sex in Fort Walton Beach
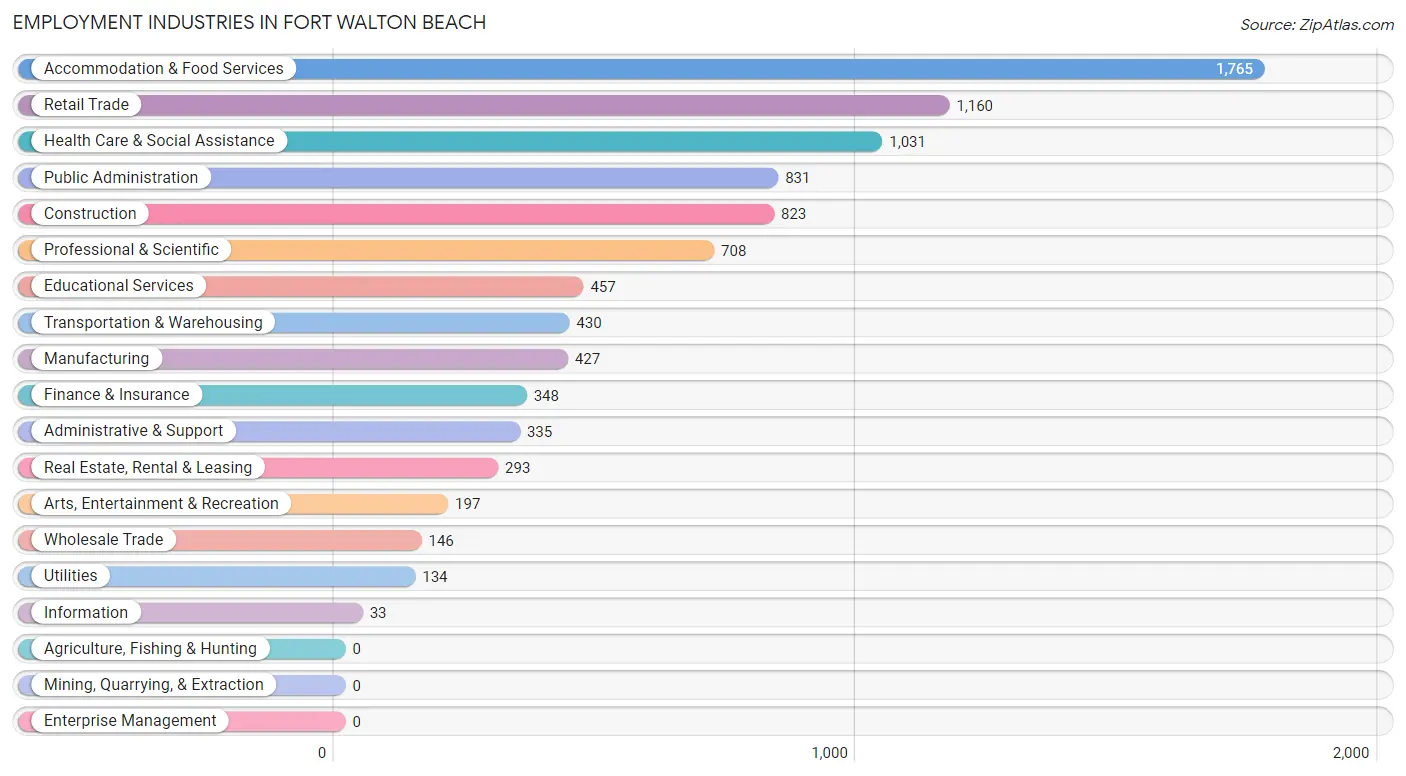
Employment Industries in Fort Walton Beach
The major employment industries in Fort Walton Beach include Accommodation & Food Services (1,765 | 18.0%), Retail Trade (1,160 | 11.9%), Health Care & Social Assistance (1,031 | 10.5%), Public Administration (831 | 8.5%), and Construction (823 | 8.4%).
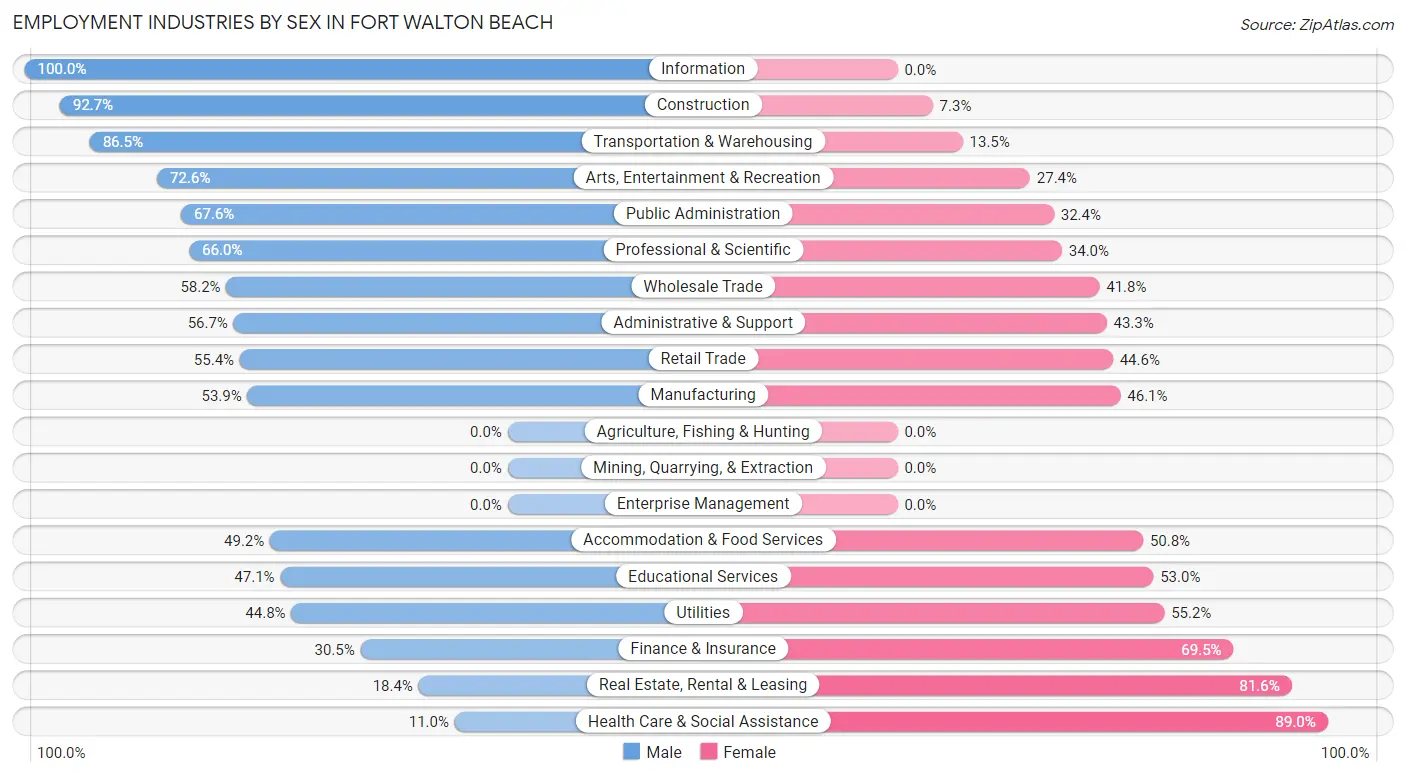
Employment Industries by Sex in Fort Walton Beach
The Fort Walton Beach industries that see more men than women are Information (100.0%), Construction (92.7%), and Transportation & Warehousing (86.5%), whereas the industries that tend to have a higher number of women are Health Care & Social Assistance (89.0%), Real Estate, Rental & Leasing (81.6%), and Finance & Insurance (69.5%).
| Industry | Male | Female |
| Agriculture, Fishing & Hunting | 0 (0.0%) | 0 (0.0%) |
| Mining, Quarrying, & Extraction | 0 (0.0%) | 0 (0.0%) |
| Construction | 763 (92.7%) | 60 (7.3%) |
| Manufacturing | 230 (53.9%) | 197 (46.1%) |
| Wholesale Trade | 85 (58.2%) | 61 (41.8%) |
| Retail Trade | 643 (55.4%) | 517 (44.6%) |
| Transportation & Warehousing | 372 (86.5%) | 58 (13.5%) |
| Utilities | 60 (44.8%) | 74 (55.2%) |
| Information | 33 (100.0%) | 0 (0.0%) |
| Finance & Insurance | 106 (30.5%) | 242 (69.5%) |
| Real Estate, Rental & Leasing | 54 (18.4%) | 239 (81.6%) |
| Professional & Scientific | 467 (66.0%) | 241 (34.0%) |
| Enterprise Management | 0 (0.0%) | 0 (0.0%) |
| Administrative & Support | 190 (56.7%) | 145 (43.3%) |
| Educational Services | 215 (47.0%) | 242 (52.9%) |
| Health Care & Social Assistance | 113 (11.0%) | 918 (89.0%) |
| Arts, Entertainment & Recreation | 143 (72.6%) | 54 (27.4%) |
| Accommodation & Food Services | 868 (49.2%) | 897 (50.8%) |
| Public Administration | 562 (67.6%) | 269 (32.4%) |
| Total | 5,201 (53.2%) | 4,581 (46.8%) |
Education in Fort Walton Beach
School Enrollment in Fort Walton Beach
The most common levels of schooling among the 4,516 students in Fort Walton Beach are high school (1,026 | 22.7%), middle school (1,018 | 22.5%), and elementary school (747 | 16.5%).
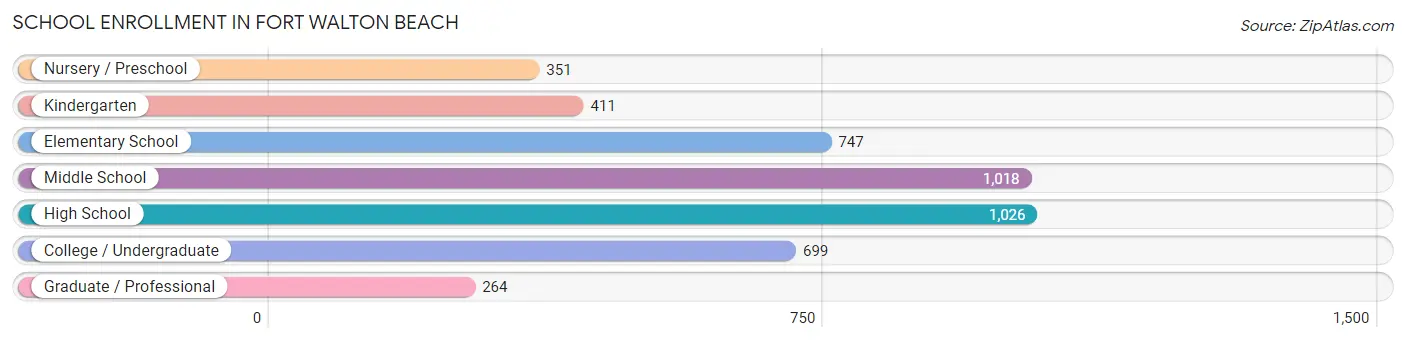
| School Level | # Students | % Students |
| Nursery / Preschool | 351 | 7.8% |
| Kindergarten | 411 | 9.1% |
| Elementary School | 747 | 16.5% |
| Middle School | 1,018 | 22.5% |
| High School | 1,026 | 22.7% |
| College / Undergraduate | 699 | 15.5% |
| Graduate / Professional | 264 | 5.9% |
| Total | 4,516 | 100.0% |
School Enrollment by Age by Funding Source in Fort Walton Beach
Out of a total of 4,516 students who are enrolled in schools in Fort Walton Beach, 804 (17.8%) attend a private institution, while the remaining 3,712 (82.2%) are enrolled in public schools. The age group of 3 to 4 year olds has the highest likelihood of being enrolled in private schools, with 130 (48.1% in the age bracket) enrolled. Conversely, the age group of 15 to 17 year olds has the lowest likelihood of being enrolled in a private school, with 657 (89.1% in the age bracket) attending a public institution.
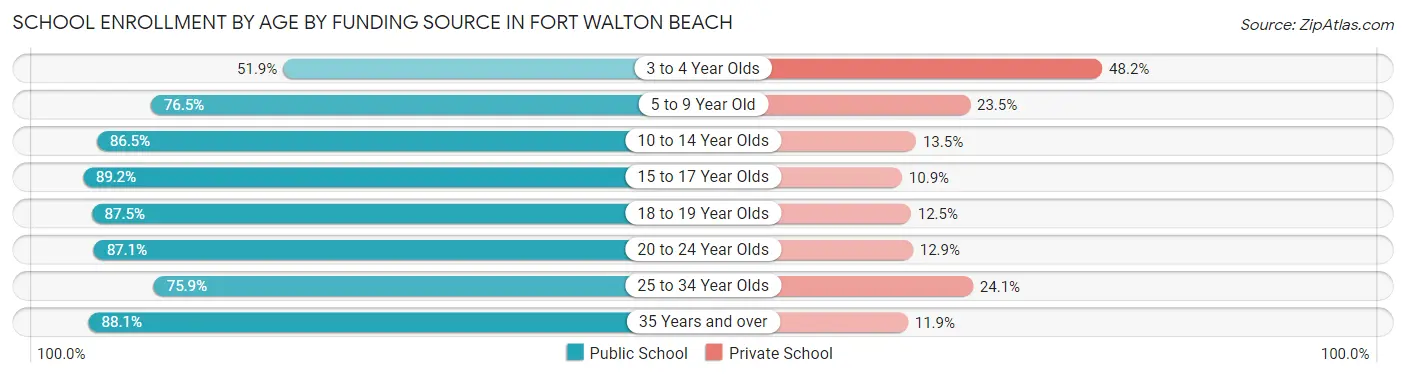
| Age Bracket | Public School | Private School |
| 3 to 4 Year Olds | 140 (51.8%) | 130 (48.1%) |
| 5 to 9 Year Old | 825 (76.5%) | 254 (23.5%) |
| 10 to 14 Year Olds | 1,143 (86.5%) | 178 (13.5%) |
| 15 to 17 Year Olds | 657 (89.1%) | 80 (10.8%) |
| 18 to 19 Year Olds | 147 (87.5%) | 21 (12.5%) |
| 20 to 24 Year Olds | 318 (87.1%) | 47 (12.9%) |
| 25 to 34 Year Olds | 164 (75.9%) | 52 (24.1%) |
| 35 Years and over | 317 (88.1%) | 43 (11.9%) |
| Total | 3,712 (82.2%) | 804 (17.8%) |
Educational Attainment by Field of Study in Fort Walton Beach
Business (796 | 18.8%), education (543 | 12.8%), science & technology (467 | 11.0%), engineering (417 | 9.8%), and computers & mathematics (354 | 8.4%) are the most common fields of study among 4,236 individuals in Fort Walton Beach who have obtained a bachelor's degree or higher.
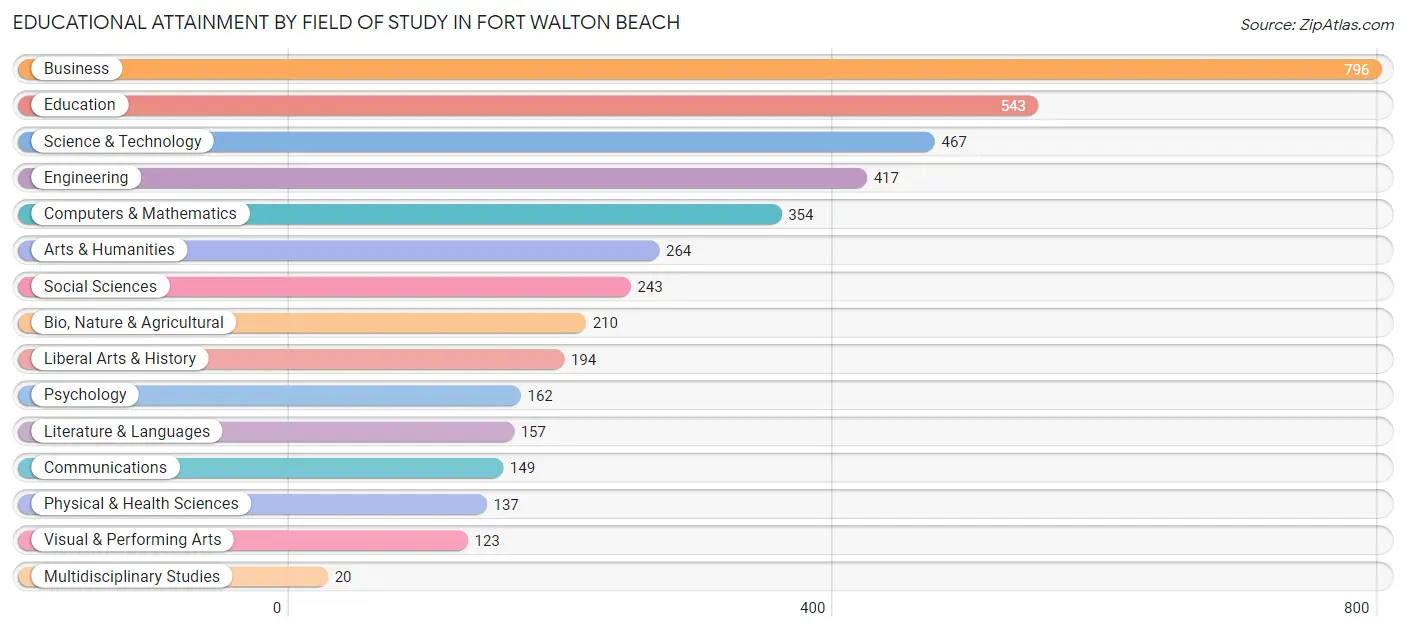
| Field of Study | # Graduates | % Graduates |
| Computers & Mathematics | 354 | 8.4% |
| Bio, Nature & Agricultural | 210 | 5.0% |
| Physical & Health Sciences | 137 | 3.2% |
| Psychology | 162 | 3.8% |
| Social Sciences | 243 | 5.7% |
| Engineering | 417 | 9.8% |
| Multidisciplinary Studies | 20 | 0.5% |
| Science & Technology | 467 | 11.0% |
| Business | 796 | 18.8% |
| Education | 543 | 12.8% |
| Literature & Languages | 157 | 3.7% |
| Liberal Arts & History | 194 | 4.6% |
| Visual & Performing Arts | 123 | 2.9% |
| Communications | 149 | 3.5% |
| Arts & Humanities | 264 | 6.2% |
| Total | 4,236 | 100.0% |
Transportation & Commute in Fort Walton Beach
Vehicle Availability by Sex in Fort Walton Beach
The most prevalent vehicle ownership categories in Fort Walton Beach are males with 2 vehicles (2,512, accounting for 43.6%) and females with 2 vehicles (1,811, making up 54.3%).
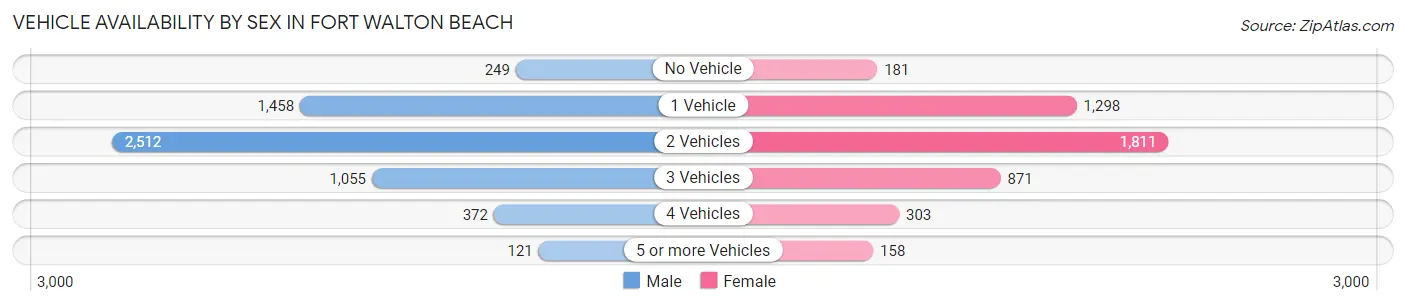
| Vehicles Available | Male | Female |
| No Vehicle | 249 (4.3%) | 181 (3.9%) |
| 1 Vehicle | 1,458 (25.3%) | 1,298 (28.1%) |
| 2 Vehicles | 2,512 (43.6%) | 1,811 (39.2%) |
| 3 Vehicles | 1,055 (18.3%) | 871 (18.8%) |
| 4 Vehicles | 372 (6.5%) | 303 (6.6%) |
| 5 or more Vehicles | 121 (2.1%) | 158 (3.4%) |
| Total | 5,767 (100.0%) | 4,622 (100.0%) |
Commute Time in Fort Walton Beach
The most frequently occuring commute durations in Fort Walton Beach are 20 to 24 minutes (1,950 commuters, 19.9%), 10 to 14 minutes (1,844 commuters, 18.9%), and 15 to 19 minutes (1,580 commuters, 16.2%).
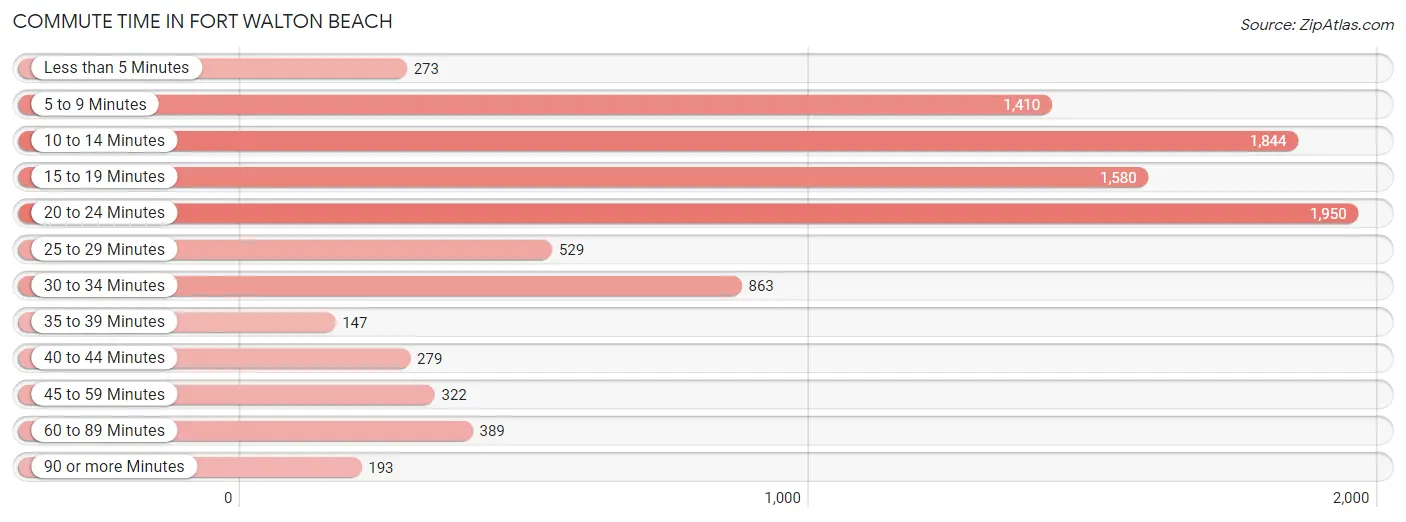
| Commute Time | # Commuters | % Commuters |
| Less than 5 Minutes | 273 | 2.8% |
| 5 to 9 Minutes | 1,410 | 14.4% |
| 10 to 14 Minutes | 1,844 | 18.9% |
| 15 to 19 Minutes | 1,580 | 16.2% |
| 20 to 24 Minutes | 1,950 | 19.9% |
| 25 to 29 Minutes | 529 | 5.4% |
| 30 to 34 Minutes | 863 | 8.8% |
| 35 to 39 Minutes | 147 | 1.5% |
| 40 to 44 Minutes | 279 | 2.9% |
| 45 to 59 Minutes | 322 | 3.3% |
| 60 to 89 Minutes | 389 | 4.0% |
| 90 or more Minutes | 193 | 2.0% |
Commute Time by Sex in Fort Walton Beach
The most common commute times in Fort Walton Beach are 20 to 24 minutes (1,348 commuters, 24.0%) for males and 10 to 14 minutes (987 commuters, 23.7%) for females.
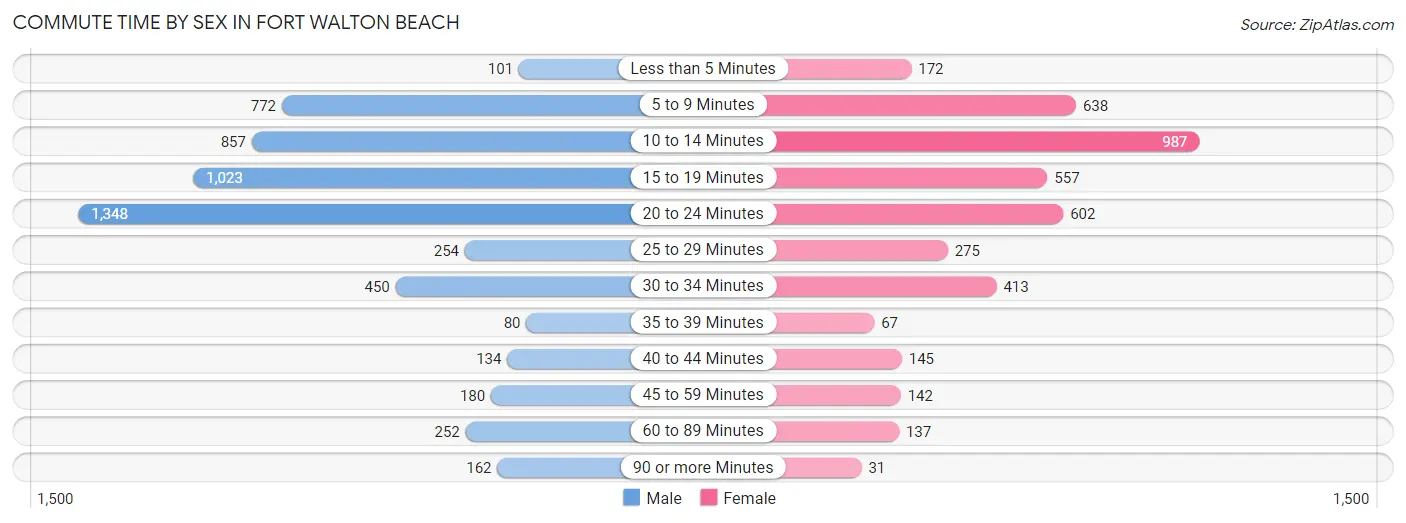
| Commute Time | Male | Female |
| Less than 5 Minutes | 101 (1.8%) | 172 (4.1%) |
| 5 to 9 Minutes | 772 (13.8%) | 638 (15.3%) |
| 10 to 14 Minutes | 857 (15.3%) | 987 (23.7%) |
| 15 to 19 Minutes | 1,023 (18.2%) | 557 (13.4%) |
| 20 to 24 Minutes | 1,348 (24.0%) | 602 (14.4%) |
| 25 to 29 Minutes | 254 (4.5%) | 275 (6.6%) |
| 30 to 34 Minutes | 450 (8.0%) | 413 (9.9%) |
| 35 to 39 Minutes | 80 (1.4%) | 67 (1.6%) |
| 40 to 44 Minutes | 134 (2.4%) | 145 (3.5%) |
| 45 to 59 Minutes | 180 (3.2%) | 142 (3.4%) |
| 60 to 89 Minutes | 252 (4.5%) | 137 (3.3%) |
| 90 or more Minutes | 162 (2.9%) | 31 (0.7%) |
Time of Departure to Work by Sex in Fort Walton Beach
The most frequent times of departure to work in Fort Walton Beach are 7:30 AM to 7:59 AM (885, 15.8%) for males and 7:30 AM to 7:59 AM (775, 18.6%) for females.
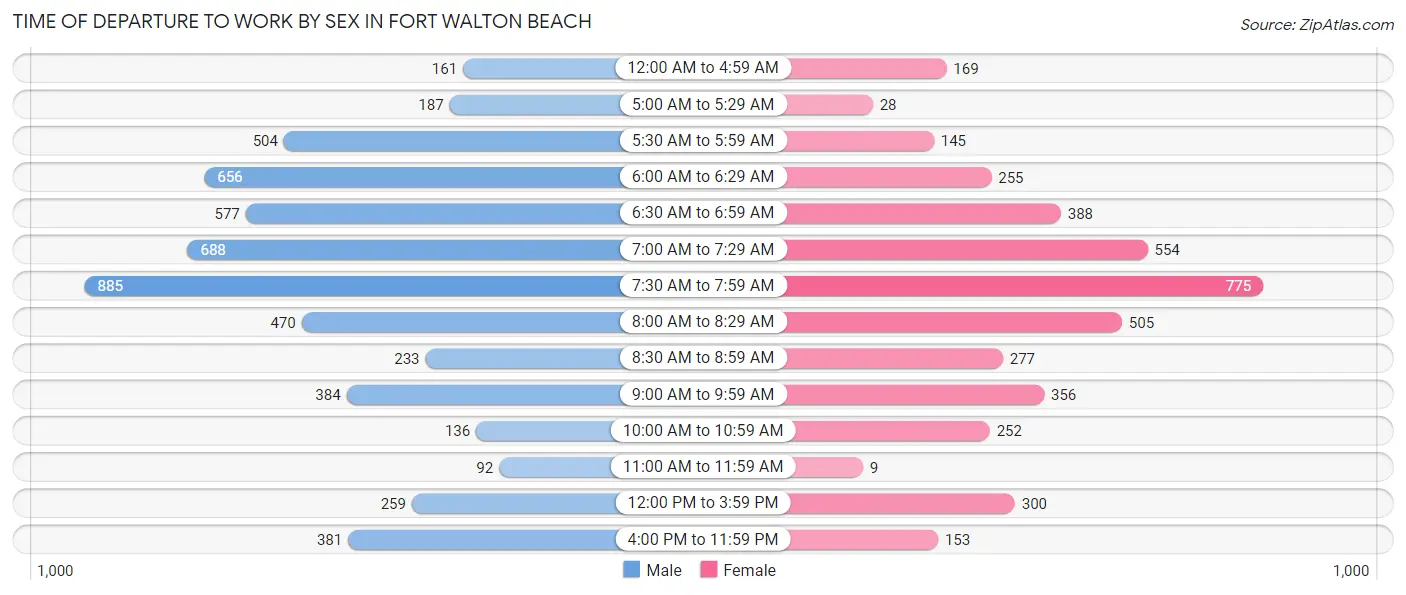
| Time of Departure | Male | Female |
| 12:00 AM to 4:59 AM | 161 (2.9%) | 169 (4.1%) |
| 5:00 AM to 5:29 AM | 187 (3.3%) | 28 (0.7%) |
| 5:30 AM to 5:59 AM | 504 (9.0%) | 145 (3.5%) |
| 6:00 AM to 6:29 AM | 656 (11.7%) | 255 (6.1%) |
| 6:30 AM to 6:59 AM | 577 (10.3%) | 388 (9.3%) |
| 7:00 AM to 7:29 AM | 688 (12.3%) | 554 (13.3%) |
| 7:30 AM to 7:59 AM | 885 (15.8%) | 775 (18.6%) |
| 8:00 AM to 8:29 AM | 470 (8.4%) | 505 (12.1%) |
| 8:30 AM to 8:59 AM | 233 (4.2%) | 277 (6.7%) |
| 9:00 AM to 9:59 AM | 384 (6.8%) | 356 (8.6%) |
| 10:00 AM to 10:59 AM | 136 (2.4%) | 252 (6.0%) |
| 11:00 AM to 11:59 AM | 92 (1.6%) | 9 (0.2%) |
| 12:00 PM to 3:59 PM | 259 (4.6%) | 300 (7.2%) |
| 4:00 PM to 11:59 PM | 381 (6.8%) | 153 (3.7%) |
| Total | 5,613 (100.0%) | 4,166 (100.0%) |
Housing Occupancy in Fort Walton Beach
Occupancy by Ownership in Fort Walton Beach
Of the total 8,840 dwellings in Fort Walton Beach, owner-occupied units account for 5,385 (60.9%), while renter-occupied units make up 3,455 (39.1%).
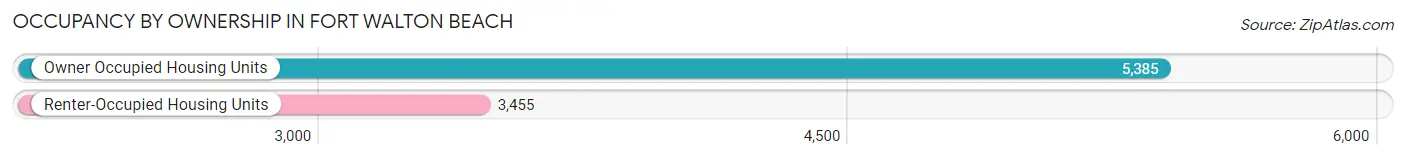
| Occupancy | # Housing Units | % Housing Units |
| Owner Occupied Housing Units | 5,385 | 60.9% |
| Renter-Occupied Housing Units | 3,455 | 39.1% |
| Total Occupied Housing Units | 8,840 | 100.0% |
Occupancy by Household Size in Fort Walton Beach
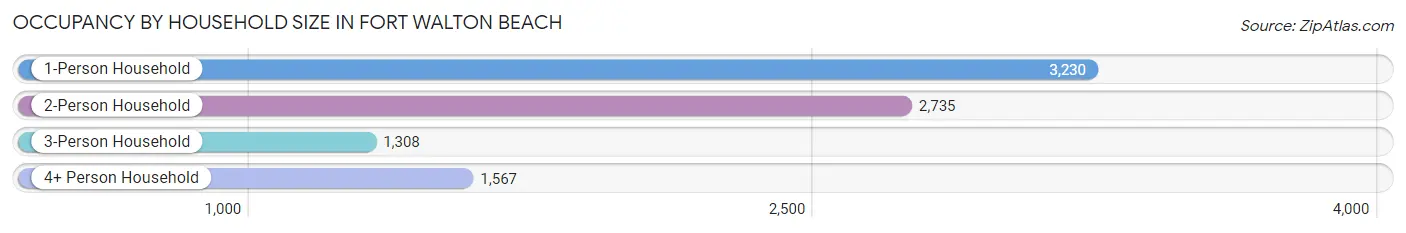
| Household Size | # Housing Units | % Housing Units |
| 1-Person Household | 3,230 | 36.5% |
| 2-Person Household | 2,735 | 30.9% |
| 3-Person Household | 1,308 | 14.8% |
| 4+ Person Household | 1,567 | 17.7% |
| Total Housing Units | 8,840 | 100.0% |
Occupancy by Ownership by Household Size in Fort Walton Beach
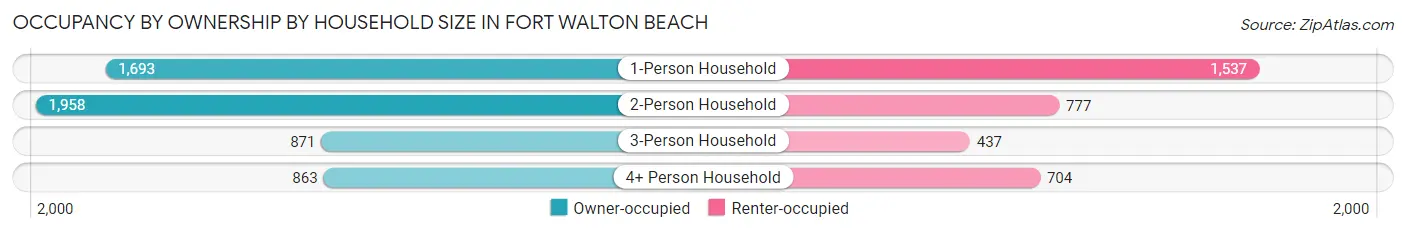
| Household Size | Owner-occupied | Renter-occupied |
| 1-Person Household | 1,693 (52.4%) | 1,537 (47.6%) |
| 2-Person Household | 1,958 (71.6%) | 777 (28.4%) |
| 3-Person Household | 871 (66.6%) | 437 (33.4%) |
| 4+ Person Household | 863 (55.1%) | 704 (44.9%) |
| Total Housing Units | 5,385 (60.9%) | 3,455 (39.1%) |
Occupancy by Educational Attainment in Fort Walton Beach
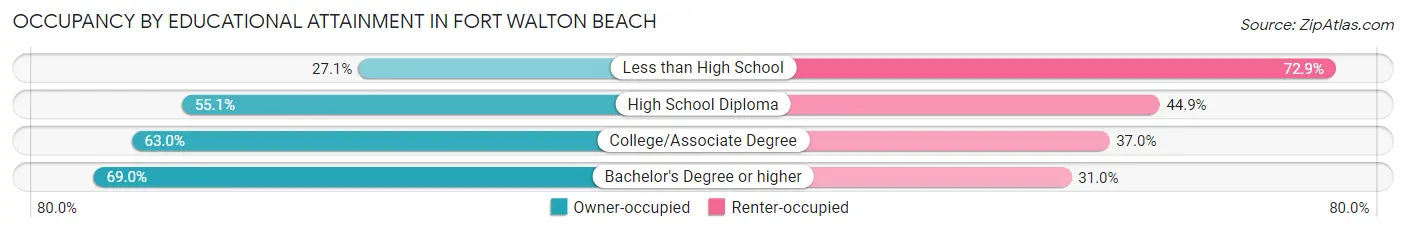
| Household Size | Owner-occupied | Renter-occupied |
| Less than High School | 116 (27.1%) | 312 (72.9%) |
| High School Diploma | 1,308 (55.1%) | 1,067 (44.9%) |
| College/Associate Degree | 2,170 (63.0%) | 1,273 (37.0%) |
| Bachelor's Degree or higher | 1,791 (69.0%) | 803 (31.0%) |
Occupancy by Age of Householder in Fort Walton Beach
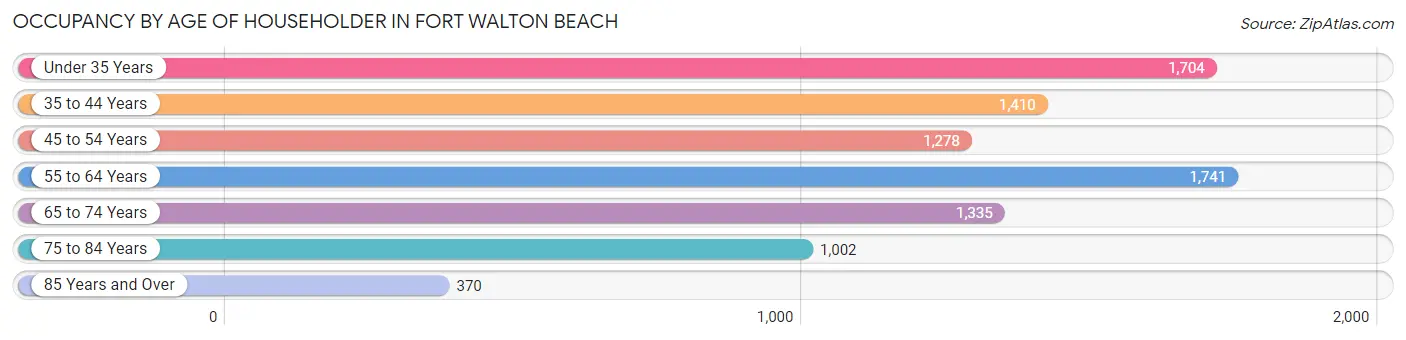
| Age Bracket | # Households | % Households |
| Under 35 Years | 1,704 | 19.3% |
| 35 to 44 Years | 1,410 | 16.0% |
| 45 to 54 Years | 1,278 | 14.5% |
| 55 to 64 Years | 1,741 | 19.7% |
| 65 to 74 Years | 1,335 | 15.1% |
| 75 to 84 Years | 1,002 | 11.3% |
| 85 Years and Over | 370 | 4.2% |
| Total | 8,840 | 100.0% |
Housing Finances in Fort Walton Beach
Median Income by Occupancy in Fort Walton Beach
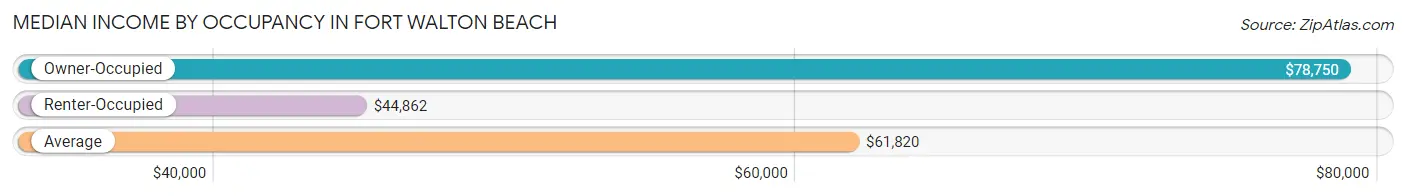
| Occupancy Type | # Households | Median Income |
| Owner-Occupied | 5,385 (60.9%) | $78,750 |
| Renter-Occupied | 3,455 (39.1%) | $44,862 |
| Average | 8,840 (100.0%) | $61,820 |
Occupancy by Householder Income Bracket in Fort Walton Beach
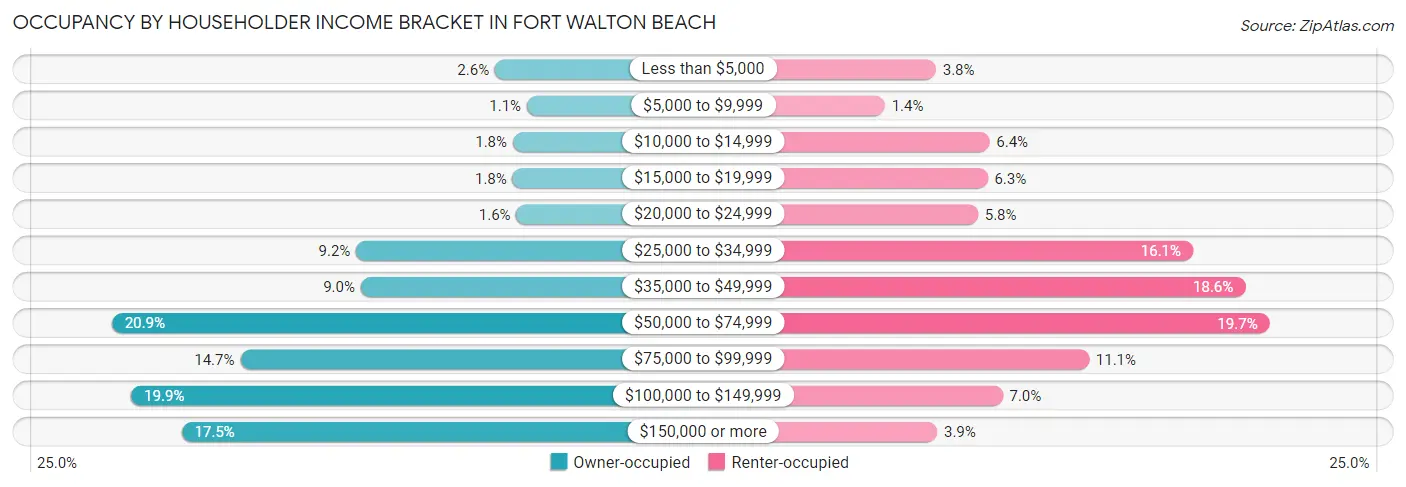
| Income Bracket | Owner-occupied | Renter-occupied |
| Less than $5,000 | 140 (2.6%) | 132 (3.8%) |
| $5,000 to $9,999 | 58 (1.1%) | 48 (1.4%) |
| $10,000 to $14,999 | 94 (1.8%) | 220 (6.4%) |
| $15,000 to $19,999 | 95 (1.8%) | 217 (6.3%) |
| $20,000 to $24,999 | 85 (1.6%) | 201 (5.8%) |
| $25,000 to $34,999 | 496 (9.2%) | 555 (16.1%) |
| $35,000 to $49,999 | 484 (9.0%) | 641 (18.5%) |
| $50,000 to $74,999 | 1,123 (20.8%) | 681 (19.7%) |
| $75,000 to $99,999 | 793 (14.7%) | 384 (11.1%) |
| $100,000 to $149,999 | 1,073 (19.9%) | 242 (7.0%) |
| $150,000 or more | 944 (17.5%) | 134 (3.9%) |
| Total | 5,385 (100.0%) | 3,455 (100.0%) |
Monthly Housing Cost Tiers in Fort Walton Beach
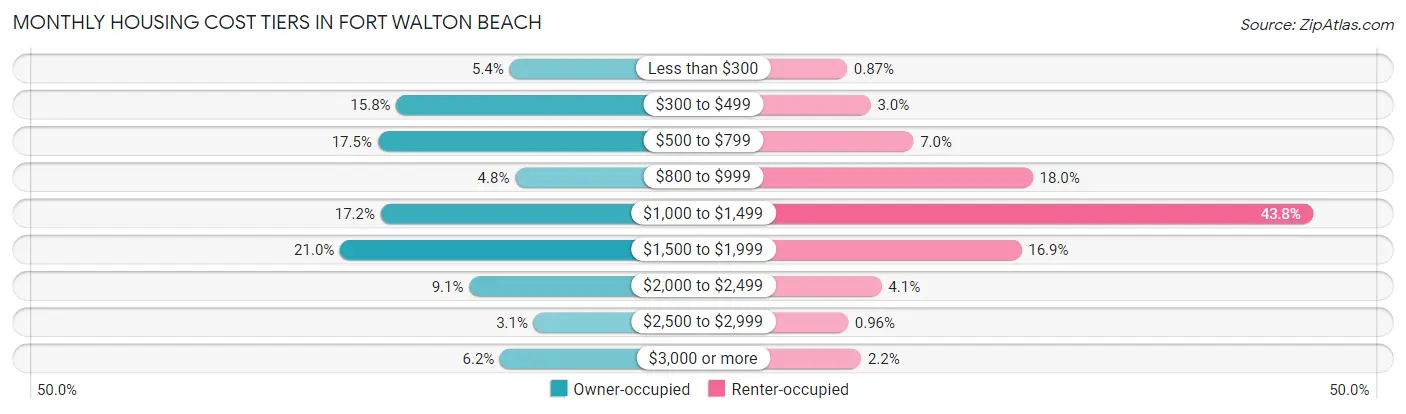
| Monthly Cost | Owner-occupied | Renter-occupied |
| Less than $300 | 288 (5.3%) | 30 (0.9%) |
| $300 to $499 | 849 (15.8%) | 105 (3.0%) |
| $500 to $799 | 942 (17.5%) | 241 (7.0%) |
| $800 to $999 | 260 (4.8%) | 621 (18.0%) |
| $1,000 to $1,499 | 927 (17.2%) | 1,512 (43.8%) |
| $1,500 to $1,999 | 1,128 (20.9%) | 585 (16.9%) |
| $2,000 to $2,499 | 488 (9.1%) | 140 (4.1%) |
| $2,500 to $2,999 | 168 (3.1%) | 33 (1.0%) |
| $3,000 or more | 335 (6.2%) | 75 (2.2%) |
| Total | 5,385 (100.0%) | 3,455 (100.0%) |
Physical Housing Characteristics in Fort Walton Beach
Housing Structures in Fort Walton Beach
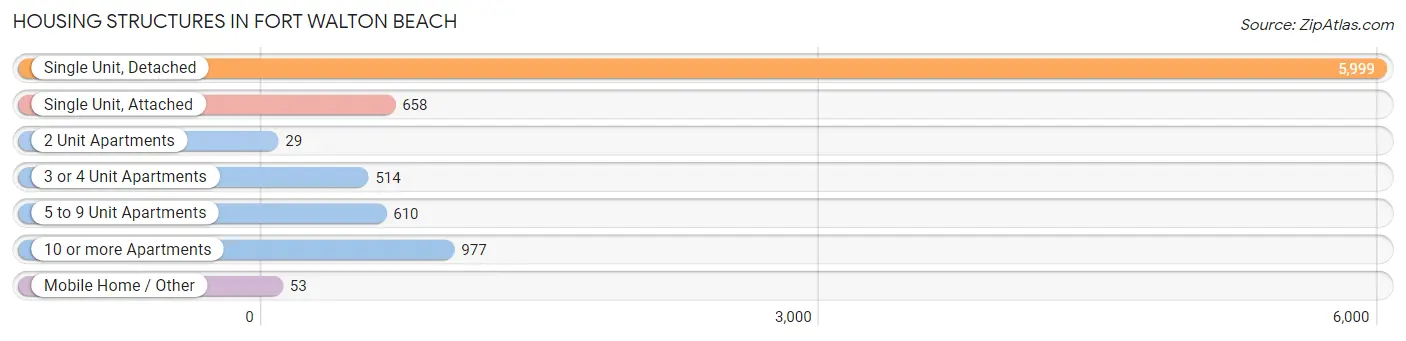
| Structure Type | # Housing Units | % Housing Units |
| Single Unit, Detached | 5,999 | 67.9% |
| Single Unit, Attached | 658 | 7.4% |
| 2 Unit Apartments | 29 | 0.3% |
| 3 or 4 Unit Apartments | 514 | 5.8% |
| 5 to 9 Unit Apartments | 610 | 6.9% |
| 10 or more Apartments | 977 | 11.1% |
| Mobile Home / Other | 53 | 0.6% |
| Total | 8,840 | 100.0% |
Housing Structures by Occupancy in Fort Walton Beach
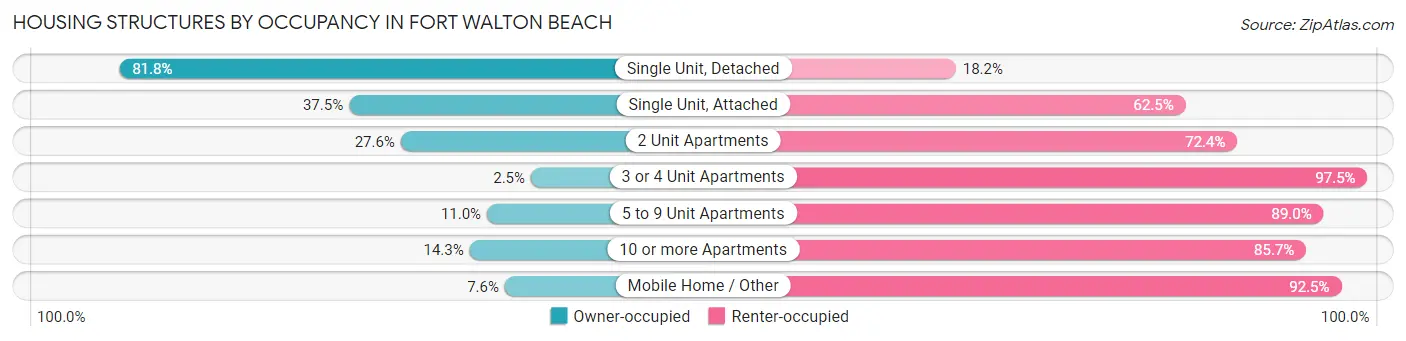
| Structure Type | Owner-occupied | Renter-occupied |
| Single Unit, Detached | 4,906 (81.8%) | 1,093 (18.2%) |
| Single Unit, Attached | 247 (37.5%) | 411 (62.5%) |
| 2 Unit Apartments | 8 (27.6%) | 21 (72.4%) |
| 3 or 4 Unit Apartments | 13 (2.5%) | 501 (97.5%) |
| 5 to 9 Unit Apartments | 67 (11.0%) | 543 (89.0%) |
| 10 or more Apartments | 140 (14.3%) | 837 (85.7%) |
| Mobile Home / Other | 4 (7.5%) | 49 (92.4%) |
| Total | 5,385 (60.9%) | 3,455 (39.1%) |
Housing Structures by Number of Rooms in Fort Walton Beach
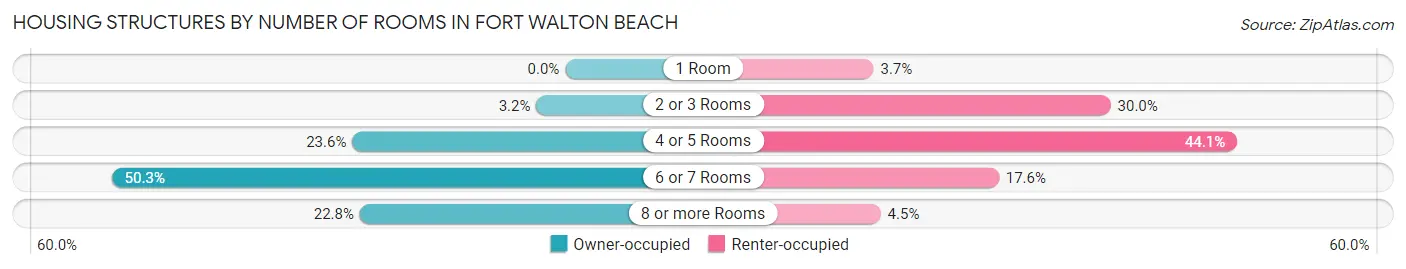
| Number of Rooms | Owner-occupied | Renter-occupied |
| 1 Room | 0 (0.0%) | 129 (3.7%) |
| 2 or 3 Rooms | 173 (3.2%) | 1,038 (30.0%) |
| 4 or 5 Rooms | 1,273 (23.6%) | 1,523 (44.1%) |
| 6 or 7 Rooms | 2,711 (50.3%) | 609 (17.6%) |
| 8 or more Rooms | 1,228 (22.8%) | 156 (4.5%) |
| Total | 5,385 (100.0%) | 3,455 (100.0%) |
Housing Structure by Heating Type in Fort Walton Beach
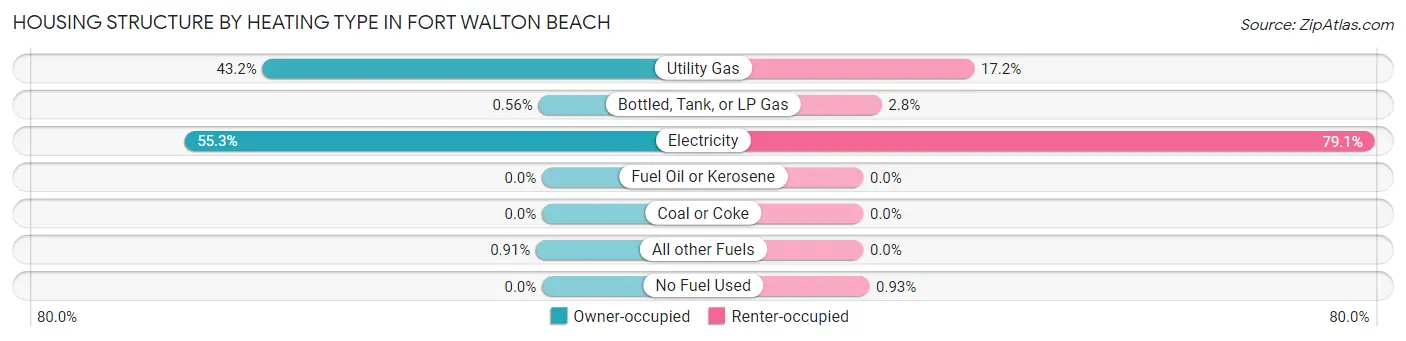
| Heating Type | Owner-occupied | Renter-occupied |
| Utility Gas | 2,327 (43.2%) | 593 (17.2%) |
| Bottled, Tank, or LP Gas | 30 (0.6%) | 98 (2.8%) |
| Electricity | 2,979 (55.3%) | 2,732 (79.1%) |
| Fuel Oil or Kerosene | 0 (0.0%) | 0 (0.0%) |
| Coal or Coke | 0 (0.0%) | 0 (0.0%) |
| All other Fuels | 49 (0.9%) | 0 (0.0%) |
| No Fuel Used | 0 (0.0%) | 32 (0.9%) |
| Total | 5,385 (100.0%) | 3,455 (100.0%) |
Household Vehicle Usage in Fort Walton Beach
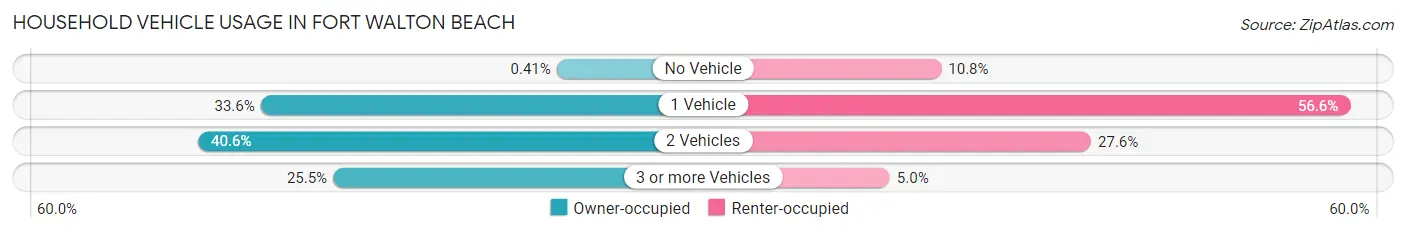
| Vehicles per Household | Owner-occupied | Renter-occupied |
| No Vehicle | 22 (0.4%) | 373 (10.8%) |
| 1 Vehicle | 1,808 (33.6%) | 1,955 (56.6%) |
| 2 Vehicles | 2,184 (40.6%) | 953 (27.6%) |
| 3 or more Vehicles | 1,371 (25.5%) | 174 (5.0%) |
| Total | 5,385 (100.0%) | 3,455 (100.0%) |
Real Estate & Mortgages in Fort Walton Beach
Real Estate and Mortgage Overview in Fort Walton Beach
| Characteristic | Without Mortgage | With Mortgage |
| Housing Units | 2,399 | 2,986 |
| Median Property Value | $248,600 | $288,400 |
| Median Household Income | $64,512 | $682 |
| Monthly Housing Costs | $519 | $327 |
| Real Estate Taxes | $1,313 | $202 |
Property Value by Mortgage Status in Fort Walton Beach
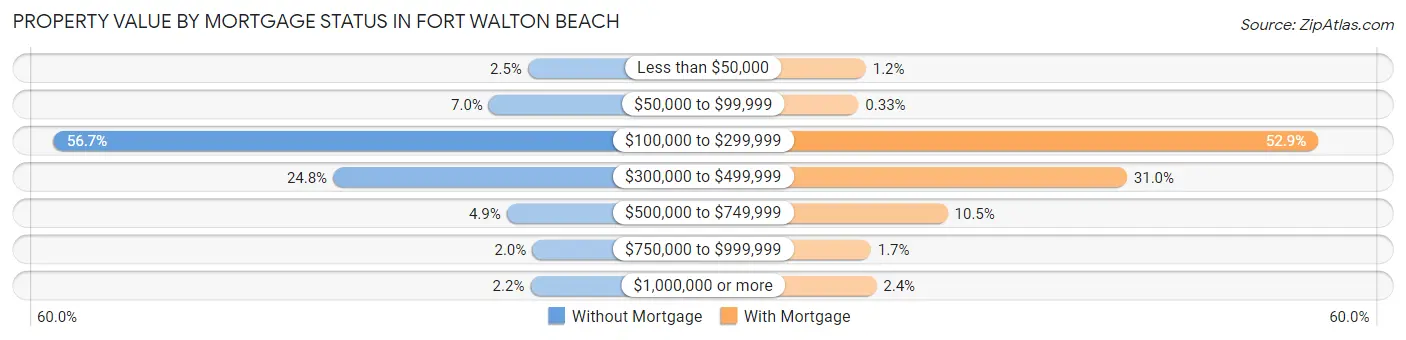
| Property Value | Without Mortgage | With Mortgage |
| Less than $50,000 | 60 (2.5%) | 35 (1.2%) |
| $50,000 to $99,999 | 167 (7.0%) | 10 (0.3%) |
| $100,000 to $299,999 | 1,359 (56.7%) | 1,578 (52.8%) |
| $300,000 to $499,999 | 594 (24.8%) | 926 (31.0%) |
| $500,000 to $749,999 | 118 (4.9%) | 314 (10.5%) |
| $750,000 to $999,999 | 48 (2.0%) | 52 (1.7%) |
| $1,000,000 or more | 53 (2.2%) | 71 (2.4%) |
| Total | 2,399 (100.0%) | 2,986 (100.0%) |
Household Income by Mortgage Status in Fort Walton Beach
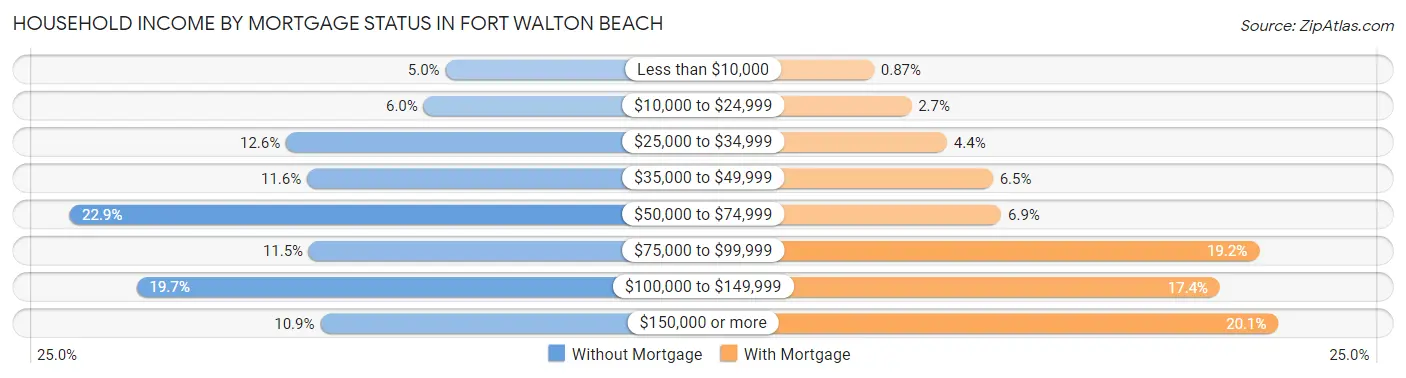
| Household Income | Without Mortgage | With Mortgage |
| Less than $10,000 | 119 (5.0%) | 26 (0.9%) |
| $10,000 to $24,999 | 144 (6.0%) | 79 (2.6%) |
| $25,000 to $34,999 | 301 (12.6%) | 130 (4.3%) |
| $35,000 to $49,999 | 277 (11.6%) | 195 (6.5%) |
| $50,000 to $74,999 | 549 (22.9%) | 207 (6.9%) |
| $75,000 to $99,999 | 275 (11.5%) | 574 (19.2%) |
| $100,000 to $149,999 | 472 (19.7%) | 518 (17.3%) |
| $150,000 or more | 262 (10.9%) | 601 (20.1%) |
| Total | 2,399 (100.0%) | 2,986 (100.0%) |
Property Value to Household Income Ratio in Fort Walton Beach
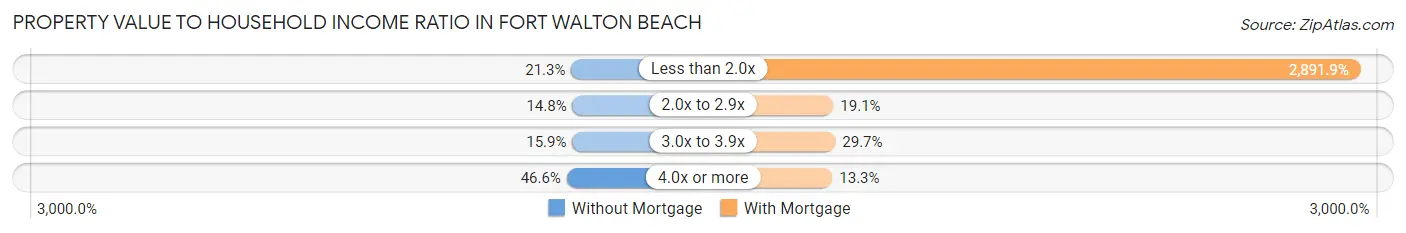
| Value-to-Income Ratio | Without Mortgage | With Mortgage |
| Less than 2.0x | 510 (21.3%) | 86,352 (2,891.9%) |
| 2.0x to 2.9x | 355 (14.8%) | 571 (19.1%) |
| 3.0x to 3.9x | 382 (15.9%) | 888 (29.7%) |
| 4.0x or more | 1,117 (46.6%) | 397 (13.3%) |
| Total | 2,399 (100.0%) | 2,986 (100.0%) |
Real Estate Taxes by Mortgage Status in Fort Walton Beach
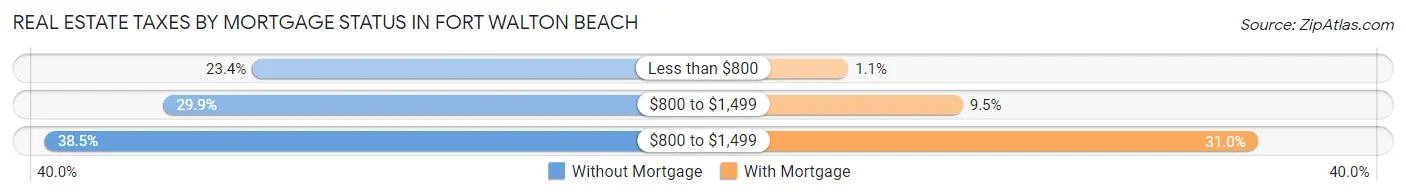
| Property Taxes | Without Mortgage | With Mortgage |
| Less than $800 | 561 (23.4%) | 33 (1.1%) |
| $800 to $1,499 | 716 (29.8%) | 283 (9.5%) |
| $800 to $1,499 | 924 (38.5%) | 926 (31.0%) |
| Total | 2,399 (100.0%) | 2,986 (100.0%) |
Health & Disability in Fort Walton Beach
Health Insurance Coverage by Age in Fort Walton Beach
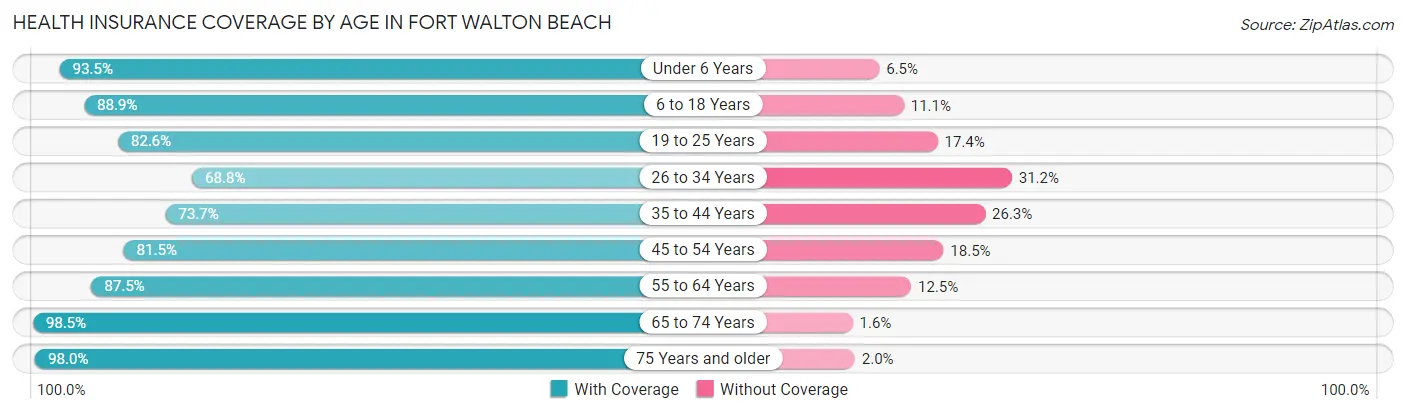
| Age Bracket | With Coverage | Without Coverage |
| Under 6 Years | 1,706 (93.5%) | 119 (6.5%) |
| 6 to 18 Years | 2,739 (88.9%) | 342 (11.1%) |
| 19 to 25 Years | 1,130 (82.6%) | 238 (17.4%) |
| 26 to 34 Years | 1,228 (68.8%) | 558 (31.2%) |
| 35 to 44 Years | 2,176 (73.7%) | 775 (26.3%) |
| 45 to 54 Years | 1,892 (81.5%) | 429 (18.5%) |
| 55 to 64 Years | 2,367 (87.5%) | 337 (12.5%) |
| 65 to 74 Years | 1,973 (98.5%) | 31 (1.5%) |
| 75 Years and older | 1,797 (98.0%) | 36 (2.0%) |
| Total | 17,008 (85.6%) | 2,865 (14.4%) |
Health Insurance Coverage by Citizenship Status in Fort Walton Beach
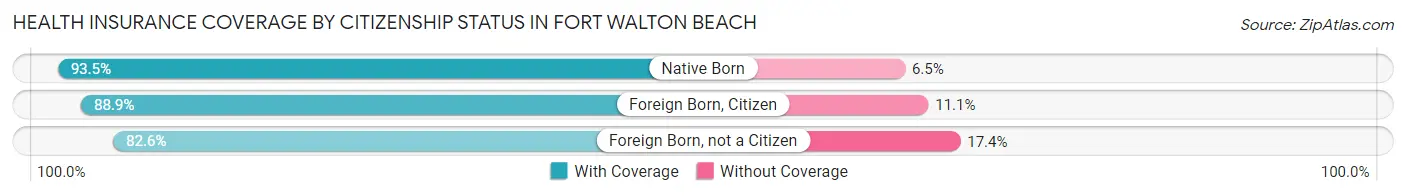
| Citizenship Status | With Coverage | Without Coverage |
| Native Born | 1,706 (93.5%) | 119 (6.5%) |
| Foreign Born, Citizen | 2,739 (88.9%) | 342 (11.1%) |
| Foreign Born, not a Citizen | 1,130 (82.6%) | 238 (17.4%) |
Health Insurance Coverage by Household Income in Fort Walton Beach
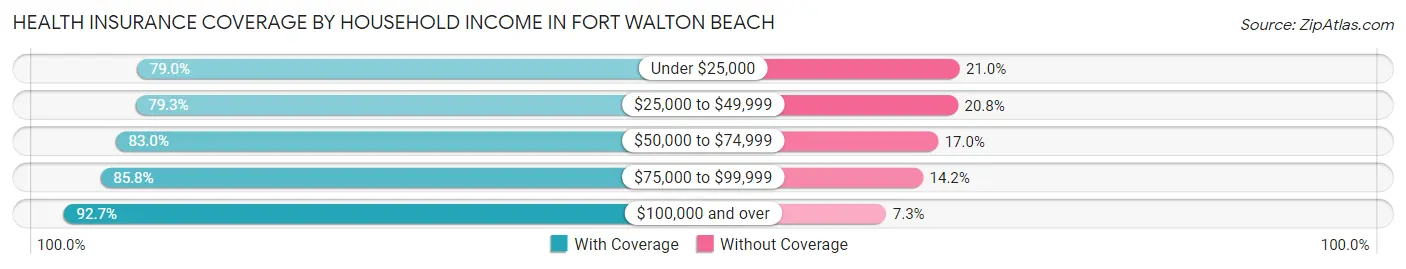
| Household Income | With Coverage | Without Coverage |
| Under $25,000 | 1,457 (79.0%) | 388 (21.0%) |
| $25,000 to $49,999 | 3,406 (79.2%) | 892 (20.7%) |
| $50,000 to $74,999 | 3,339 (83.0%) | 686 (17.0%) |
| $75,000 to $99,999 | 2,386 (85.8%) | 395 (14.2%) |
| $100,000 and over | 6,320 (92.7%) | 499 (7.3%) |
Public vs Private Health Insurance Coverage by Age in Fort Walton Beach
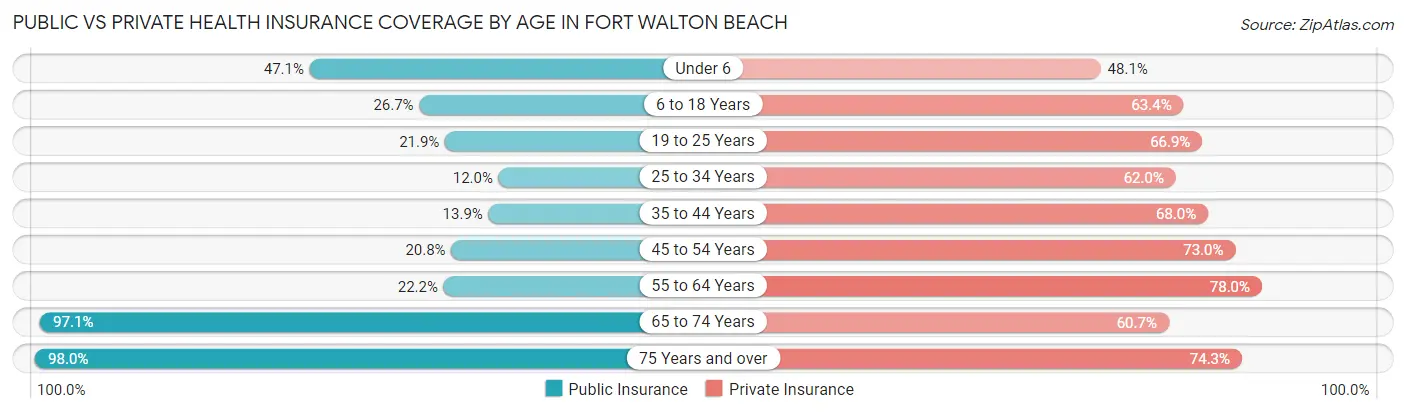
| Age Bracket | Public Insurance | Private Insurance |
| Under 6 | 859 (47.1%) | 877 (48.0%) |
| 6 to 18 Years | 823 (26.7%) | 1,954 (63.4%) |
| 19 to 25 Years | 300 (21.9%) | 915 (66.9%) |
| 25 to 34 Years | 214 (12.0%) | 1,107 (62.0%) |
| 35 to 44 Years | 409 (13.9%) | 2,006 (68.0%) |
| 45 to 54 Years | 482 (20.8%) | 1,695 (73.0%) |
| 55 to 64 Years | 600 (22.2%) | 2,108 (78.0%) |
| 65 to 74 Years | 1,946 (97.1%) | 1,216 (60.7%) |
| 75 Years and over | 1,797 (98.0%) | 1,361 (74.3%) |
| Total | 7,430 (37.4%) | 13,239 (66.6%) |
Disability Status by Sex by Age in Fort Walton Beach
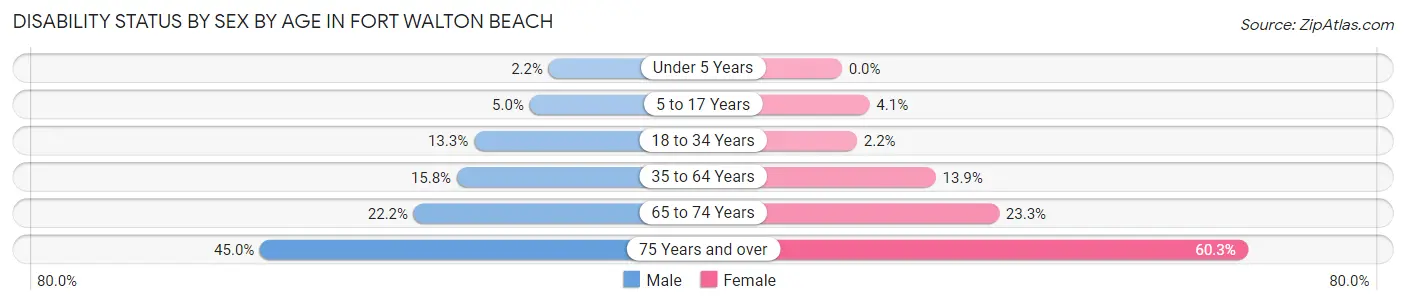
| Age Bracket | Male | Female |
| Under 5 Years | 12 (2.2%) | 0 (0.0%) |
| 5 to 17 Years | 104 (5.0%) | 61 (4.1%) |
| 18 to 34 Years | 209 (13.3%) | 39 (2.2%) |
| 35 to 64 Years | 640 (15.8%) | 547 (13.9%) |
| 65 to 74 Years | 226 (22.2%) | 230 (23.3%) |
| 75 Years and over | 285 (45.0%) | 723 (60.3%) |
Disability Class by Sex by Age in Fort Walton Beach
Disability Class: Hearing Difficulty
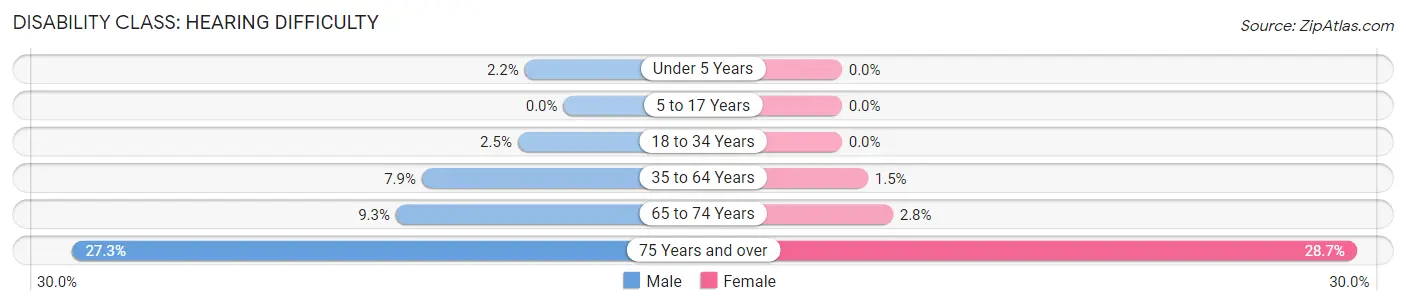
| Age Bracket | Male | Female |
| Under 5 Years | 12 (2.2%) | 0 (0.0%) |
| 5 to 17 Years | 0 (0.0%) | 0 (0.0%) |
| 18 to 34 Years | 40 (2.5%) | 0 (0.0%) |
| 35 to 64 Years | 319 (7.9%) | 57 (1.5%) |
| 65 to 74 Years | 95 (9.3%) | 28 (2.8%) |
| 75 Years and over | 173 (27.3%) | 344 (28.7%) |
Disability Class: Vision Difficulty
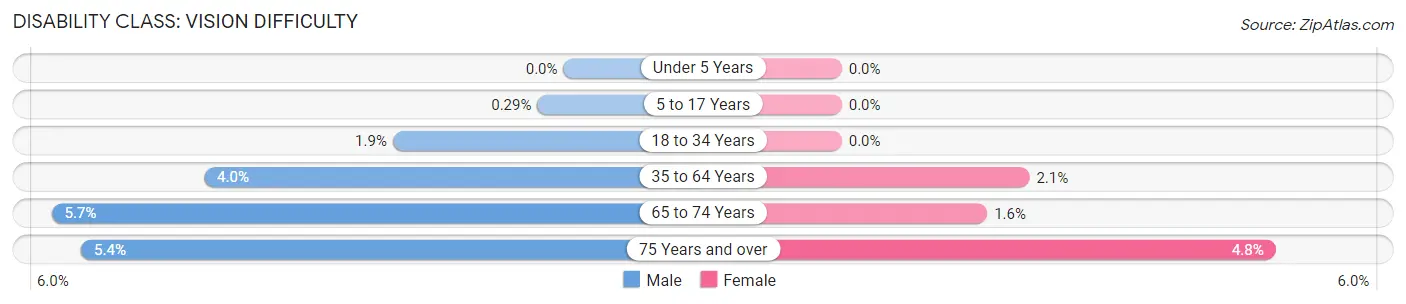
| Age Bracket | Male | Female |
| Under 5 Years | 0 (0.0%) | 0 (0.0%) |
| 5 to 17 Years | 6 (0.3%) | 0 (0.0%) |
| 18 to 34 Years | 30 (1.9%) | 0 (0.0%) |
| 35 to 64 Years | 162 (4.0%) | 82 (2.1%) |
| 65 to 74 Years | 58 (5.7%) | 16 (1.6%) |
| 75 Years and over | 34 (5.4%) | 58 (4.8%) |
Disability Class: Cognitive Difficulty
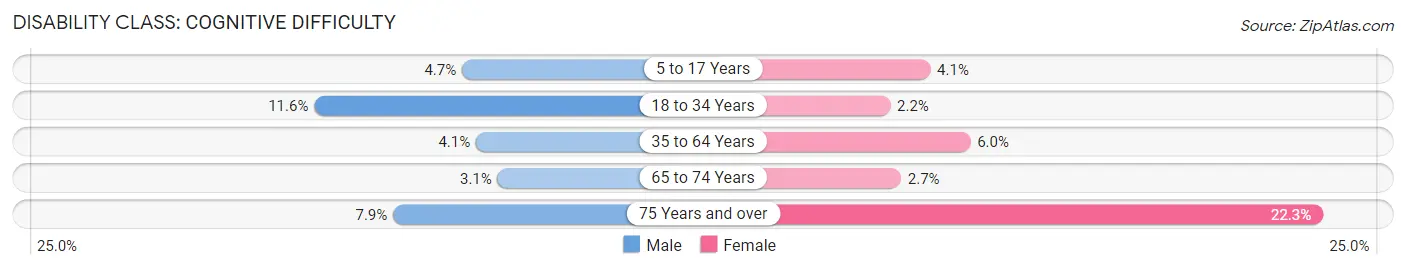
| Age Bracket | Male | Female |
| 5 to 17 Years | 98 (4.7%) | 61 (4.1%) |
| 18 to 34 Years | 182 (11.6%) | 39 (2.2%) |
| 35 to 64 Years | 164 (4.1%) | 234 (6.0%) |
| 65 to 74 Years | 31 (3.0%) | 27 (2.7%) |
| 75 Years and over | 50 (7.9%) | 268 (22.3%) |
Disability Class: Ambulatory Difficulty
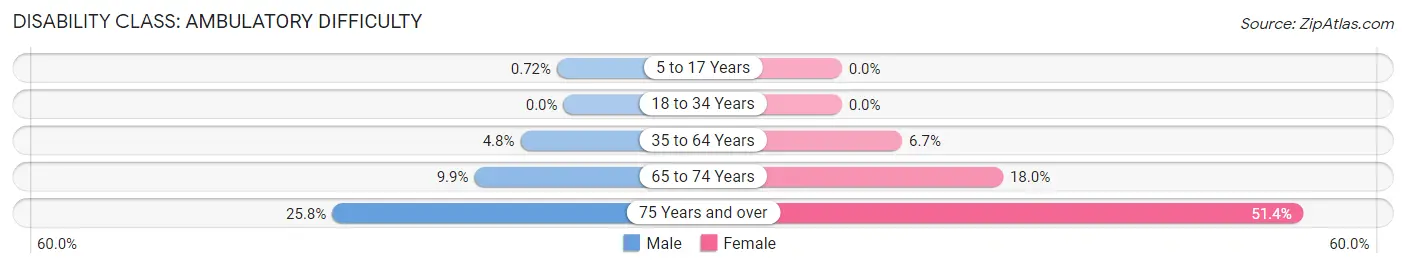
| Age Bracket | Male | Female |
| 5 to 17 Years | 15 (0.7%) | 0 (0.0%) |
| 18 to 34 Years | 0 (0.0%) | 0 (0.0%) |
| 35 to 64 Years | 194 (4.8%) | 264 (6.7%) |
| 65 to 74 Years | 101 (9.9%) | 177 (17.9%) |
| 75 Years and over | 163 (25.8%) | 617 (51.4%) |
Disability Class: Self-Care Difficulty
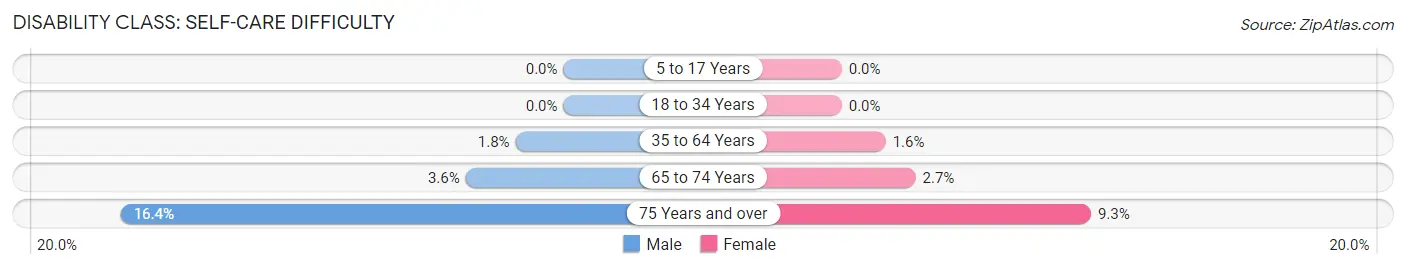
| Age Bracket | Male | Female |
| 5 to 17 Years | 0 (0.0%) | 0 (0.0%) |
| 18 to 34 Years | 0 (0.0%) | 0 (0.0%) |
| 35 to 64 Years | 72 (1.8%) | 64 (1.6%) |
| 65 to 74 Years | 37 (3.6%) | 27 (2.7%) |
| 75 Years and over | 104 (16.4%) | 111 (9.2%) |
Technology Access in Fort Walton Beach
Computing Device Access in Fort Walton Beach
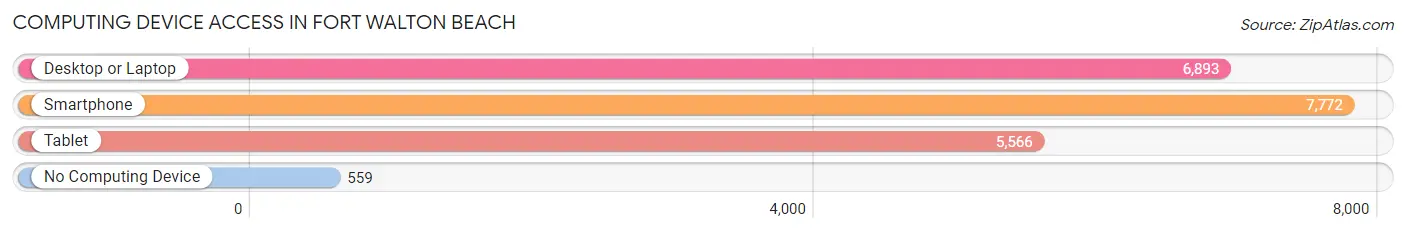
| Device Type | # Households | % Households |
| Desktop or Laptop | 6,893 | 78.0% |
| Smartphone | 7,772 | 87.9% |
| Tablet | 5,566 | 63.0% |
| No Computing Device | 559 | 6.3% |
| Total | 8,840 | 100.0% |
Internet Access in Fort Walton Beach
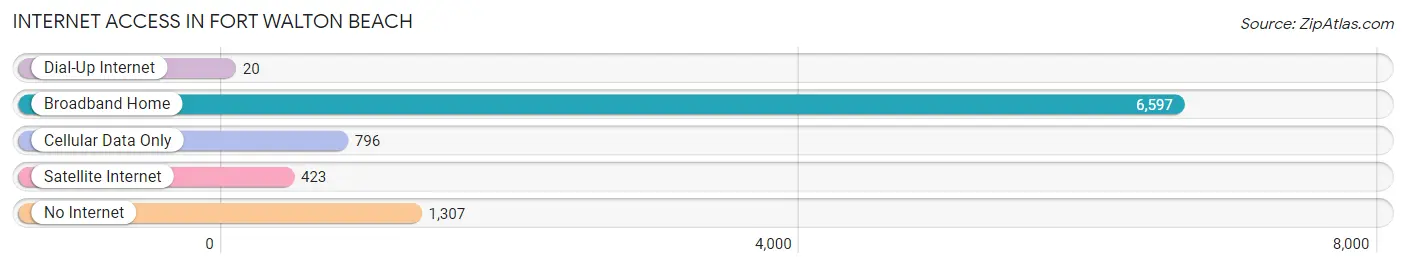
| Internet Type | # Households | % Households |
| Dial-Up Internet | 20 | 0.2% |
| Broadband Home | 6,597 | 74.6% |
| Cellular Data Only | 796 | 9.0% |
| Satellite Internet | 423 | 4.8% |
| No Internet | 1,307 | 14.8% |
| Total | 8,840 | 100.0% |
Fort Walton Beach Summary
Fort Walton Beach is a city located in Okaloosa County, Florida, United States. It is a principal city of the Fort Walton Beach-Crestview-Destin Metropolitan Statistical Area. As of the 2010 census, the population was 19,507. It is the seat of Okaloosa County.
History
The area that is now Fort Walton Beach was originally inhabited by Native Americans of the Muscogee (Creek) Nation. The first Europeans to settle in the area were members of the Spanish expedition of Panfilo de Narvaez in 1528. The area was later settled by the English in the late 1700s.
The city of Fort Walton Beach was established in 1936, when the U.S. Army Corps of Engineers began construction of a military base. The base was named after General Edmund Kirby Smith, who served in the Confederate Army during the Civil War. The base was used as a training facility for the Army Air Corps during World War II.
In the 1950s, the base was converted to a naval air station and was used as a training facility for the Navy and Marine Corps. The base was closed in 1975 and the land was sold to the city of Fort Walton Beach.
Geography
Fort Walton Beach is located in the Florida Panhandle, on the Gulf of Mexico. It is situated on the Santa Rosa Sound, which separates it from Okaloosa Island. The city is bordered by the cities of Destin to the east and Niceville to the west.
The city has a total area of 16.2 square miles, of which 15.7 square miles is land and 0.5 square miles is water.
Economy
The economy of Fort Walton Beach is largely based on tourism and the military. The city is home to Eglin Air Force Base, which is the largest Air Force base in the United States. The base is a major employer in the area and provides a significant economic impact to the city.
The city is also a popular tourist destination, with many visitors coming to enjoy the beaches, fishing, and other outdoor activities. The city is home to several resorts, hotels, and restaurants, which provide additional economic benefits to the city.
Demographics
As of the 2010 census, there were 19,507 people, 8,845 households, and 5,072 families residing in the city. The population density was 1,241.3 people per square mile. The racial makeup of the city was 79.2% White, 11.3% African American, 0.7% Native American, 2.2% Asian, 0.1% Pacific Islander, 4.2% from other races, and 2.3% from two or more races. Hispanic or Latino of any race were 8.7% of the population.
The median income for a household in the city was $41,945, and the median income for a family was $50,945. Males had a median income of $35,945 versus $25,945 for females. The per capita income for the city was $21,945. About 8.7% of families and 11.3% of the population were below the poverty line, including 15.3% of those under age 18 and 8.7% of those age 65 or over.
Common Questions
What is Per Capita Income in Fort Walton Beach?
Per Capita income in Fort Walton Beach is $36,251.
What is the Median Family Income in Fort Walton Beach?
Median Family Income in Fort Walton Beach is $80,000.
What is the Median Household income in Fort Walton Beach?
Median Household Income in Fort Walton Beach is $61,820.
What is Income or Wage Gap in Fort Walton Beach?
Income or Wage Gap in Fort Walton Beach is 33.8%.
Women in Fort Walton Beach earn 66.2 cents for every dollar earned by a man.
What is Family Income Deficit in Fort Walton Beach?
Family Income Deficit in Fort Walton Beach is $6,646.
Families that are below poverty line in Fort Walton Beach earn $6,646 less on average than the poverty threshold level.
What is Inequality or Gini Index in Fort Walton Beach?
Inequality or Gini Index in Fort Walton Beach is 0.45.
What is the Total Population of Fort Walton Beach?
Total Population of Fort Walton Beach is 20,919.
What is the Total Male Population of Fort Walton Beach?
Total Male Population of Fort Walton Beach is 10,704.
What is the Total Female Population of Fort Walton Beach?
Total Female Population of Fort Walton Beach is 10,215.
What is the Ratio of Males per 100 Females in Fort Walton Beach?
There are 104.79 Males per 100 Females in Fort Walton Beach.
What is the Ratio of Females per 100 Males in Fort Walton Beach?
There are 95.43 Females per 100 Males in Fort Walton Beach.
What is the Median Population Age in Fort Walton Beach?
Median Population Age in Fort Walton Beach is 39.7 Years.
What is the Average Family Size in Fort Walton Beach
Average Family Size in Fort Walton Beach is 3.0 People.
What is the Average Household Size in Fort Walton Beach
Average Household Size in Fort Walton Beach is 2.3 People.
How Large is the Labor Force in Fort Walton Beach?
There are 11,043 People in the Labor Forcein in Fort Walton Beach.
What is the Percentage of People in the Labor Force in Fort Walton Beach?
66.4% of People are in the Labor Force in Fort Walton Beach.
What is the Unemployment Rate in Fort Walton Beach?
Unemployment Rate in Fort Walton Beach is 3.9%.