Edgewater, FL Map & Demographics
Edgewater Map
Edgewater Overview
$34,836
PER CAPITA INCOME
$73,214
AVG FAMILY INCOME
$56,886
AVG HOUSEHOLD INCOME
10.6%
WAGE / INCOME GAP [ % ]
89.4¢/ $1
WAGE / INCOME GAP [ $ ]
0.42
INEQUALITY / GINI INDEX
23,138
TOTAL POPULATION
10,965
MALE POPULATION
12,173
FEMALE POPULATION
90.08
MALES / 100 FEMALES
111.02
FEMALES / 100 MALES
54.7
MEDIAN AGE
2.8
AVG FAMILY SIZE
2.2
AVG HOUSEHOLD SIZE
10,560
LABOR FORCE [ PEOPLE ]
52.2%
PERCENT IN LABOR FORCE
2.6%
UNEMPLOYMENT RATE
Edgewater Area Codes
Income in Edgewater
Income Overview in Edgewater
Per Capita Income in Edgewater is $34,836, while median incomes of families and households are $73,214 and $56,886 respectively.
| Characteristic | Number | Measure |
| Per Capita Income | 23,138 | $34,836 |
| Median Family Income | 6,094 | $73,214 |
| Mean Family Income | 6,094 | $84,844 |
| Median Household Income | 10,620 | $56,886 |
| Mean Household Income | 10,620 | $73,502 |
| Income Deficit | 6,094 | $0 |
| Wage / Income Gap (%) | 23,138 | 10.64% |
| Wage / Income Gap ($) | 23,138 | 89.36¢ per $1 |
| Gini / Inequality Index | 23,138 | 0.42 |
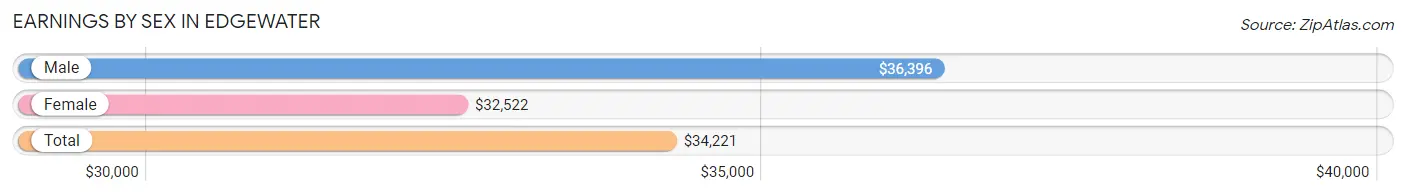
Earnings by Sex in Edgewater
Average Earnings in Edgewater are $34,221, $36,396 for men and $32,522 for women, a difference of 10.6%.
| Sex | Number | Average Earnings |
| Male | 5,784 (51.8%) | $36,396 |
| Female | 5,376 (48.2%) | $32,522 |
| Total | 11,160 (100.0%) | $34,221 |
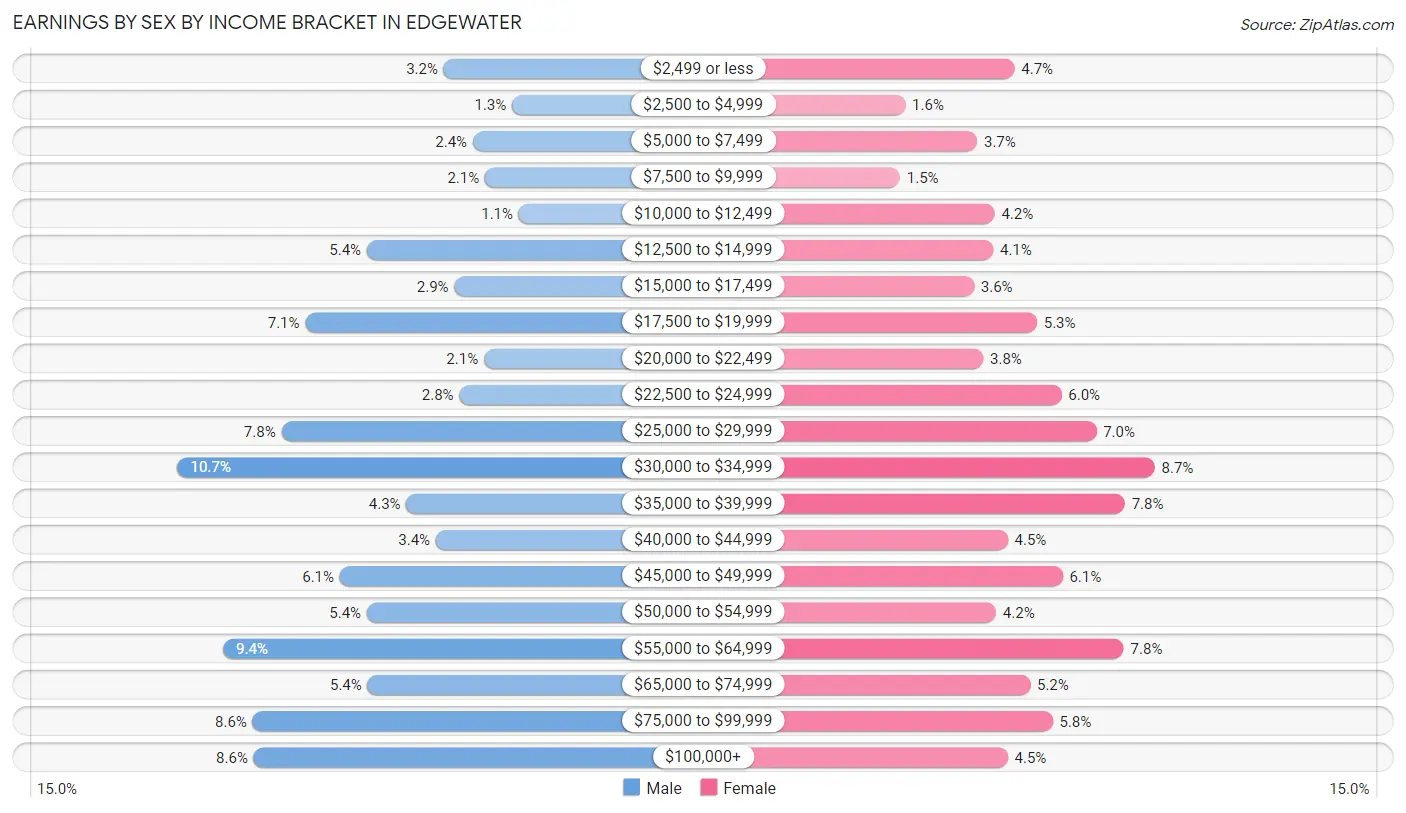
Earnings by Sex by Income Bracket in Edgewater
The most common earnings brackets in Edgewater are $30,000 to $34,999 for men (619 | 10.7%) and $30,000 to $34,999 for women (465 | 8.6%).
| Income | Male | Female |
| $2,499 or less | 186 (3.2%) | 253 (4.7%) |
| $2,500 to $4,999 | 75 (1.3%) | 88 (1.6%) |
| $5,000 to $7,499 | 139 (2.4%) | 197 (3.7%) |
| $7,500 to $9,999 | 119 (2.1%) | 80 (1.5%) |
| $10,000 to $12,499 | 64 (1.1%) | 223 (4.2%) |
| $12,500 to $14,999 | 311 (5.4%) | 221 (4.1%) |
| $15,000 to $17,499 | 169 (2.9%) | 192 (3.6%) |
| $17,500 to $19,999 | 411 (7.1%) | 287 (5.3%) |
| $20,000 to $22,499 | 121 (2.1%) | 206 (3.8%) |
| $22,500 to $24,999 | 161 (2.8%) | 324 (6.0%) |
| $25,000 to $29,999 | 450 (7.8%) | 377 (7.0%) |
| $30,000 to $34,999 | 619 (10.7%) | 465 (8.6%) |
| $35,000 to $39,999 | 247 (4.3%) | 420 (7.8%) |
| $40,000 to $44,999 | 199 (3.4%) | 243 (4.5%) |
| $45,000 to $49,999 | 355 (6.1%) | 326 (6.1%) |
| $50,000 to $54,999 | 311 (5.4%) | 225 (4.2%) |
| $55,000 to $64,999 | 545 (9.4%) | 418 (7.8%) |
| $65,000 to $74,999 | 310 (5.4%) | 277 (5.1%) |
| $75,000 to $99,999 | 497 (8.6%) | 311 (5.8%) |
| $100,000+ | 495 (8.6%) | 243 (4.5%) |
| Total | 5,784 (100.0%) | 5,376 (100.0%) |
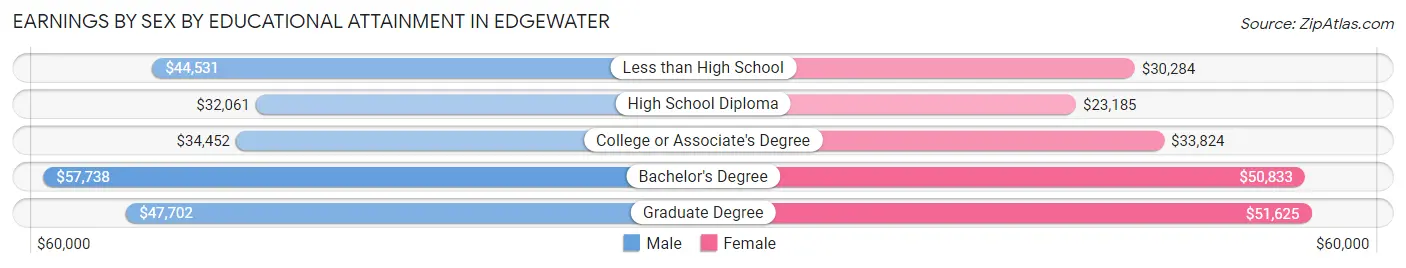
Earnings by Sex by Educational Attainment in Edgewater
Average earnings in Edgewater are $39,255 for men and $35,686 for women, a difference of 9.1%. Men with an educational attainment of bachelor's degree enjoy the highest average annual earnings of $57,738, while those with high school diploma education earn the least with $32,061. Women with an educational attainment of graduate degree earn the most with the average annual earnings of $51,625, while those with high school diploma education have the smallest earnings of $23,185.
| Educational Attainment | Male Income | Female Income |
| Less than High School | $44,531 | $30,284 |
| High School Diploma | $32,061 | $23,185 |
| College or Associate's Degree | $34,452 | $33,824 |
| Bachelor's Degree | $57,738 | $50,833 |
| Graduate Degree | $47,702 | $51,625 |
| Total | $39,255 | $35,686 |
Family Income in Edgewater
Family Income Brackets in Edgewater
According to the Edgewater family income data, there are 1,353 families falling into the $50,000 to $74,999 income range, which is the most common income bracket and makes up 22.2% of all families. Conversely, the less than $10,000 income bracket is the least frequent group with only 98 families (1.6%) belonging to this category.
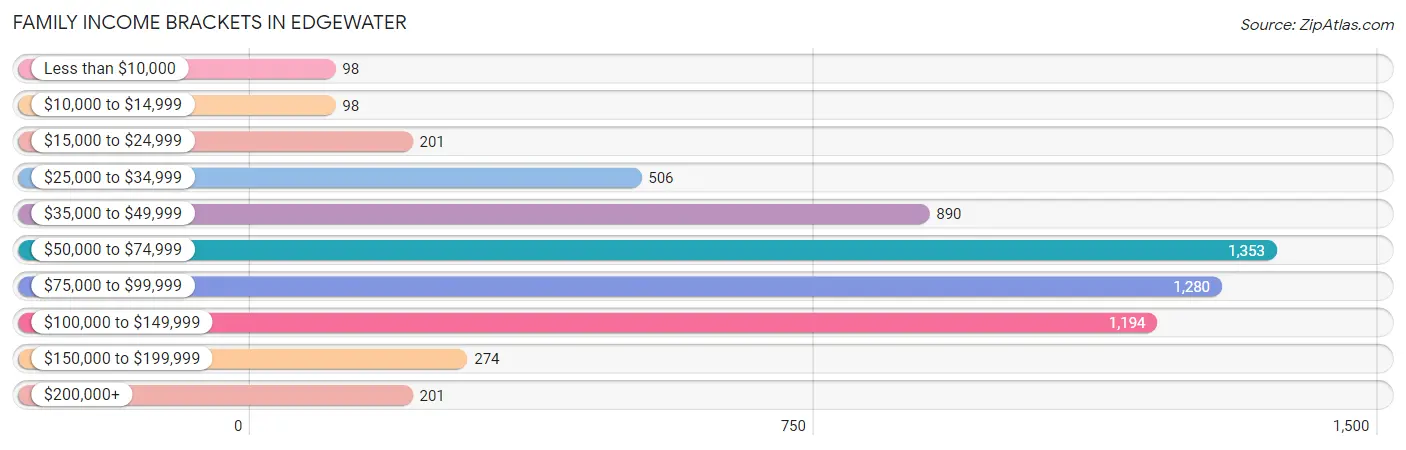
| Income Bracket | # Families | % Families |
| Less than $10,000 | 98 | 1.6% |
| $10,000 to $14,999 | 98 | 1.6% |
| $15,000 to $24,999 | 201 | 3.3% |
| $25,000 to $34,999 | 506 | 8.3% |
| $35,000 to $49,999 | 890 | 14.6% |
| $50,000 to $74,999 | 1,353 | 22.2% |
| $75,000 to $99,999 | 1,280 | 21.0% |
| $100,000 to $149,999 | 1,194 | 19.6% |
| $150,000 to $199,999 | 274 | 4.5% |
| $200,000+ | 201 | 3.3% |
Family Income by Famaliy Size in Edgewater
6-person families (160 | 2.6%) account for the highest median family income in Edgewater with $130,179 per family, while 2-person families (4,024 | 66.0%) have the highest median income of $34,527 per family member.
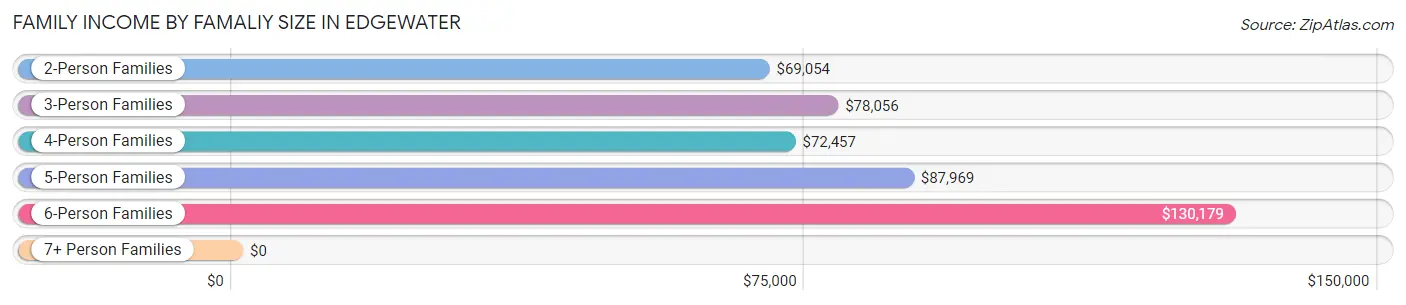
| Income Bracket | # Families | Median Income |
| 2-Person Families | 4,024 (66.0%) | $69,054 |
| 3-Person Families | 1,038 (17.0%) | $78,056 |
| 4-Person Families | 616 (10.1%) | $72,457 |
| 5-Person Families | 242 (4.0%) | $87,969 |
| 6-Person Families | 160 (2.6%) | $130,179 |
| 7+ Person Families | 14 (0.2%) | $0 |
| Total | 6,094 (100.0%) | $73,214 |
Family Income by Number of Earners in Edgewater
The median family income in Edgewater is $73,214, with families comprising 3+ earners (412) having the highest median family income of $130,694, while families with no earners (1,767) have the lowest median family income of $60,566, accounting for 6.8% and 29.0% of families, respectively.
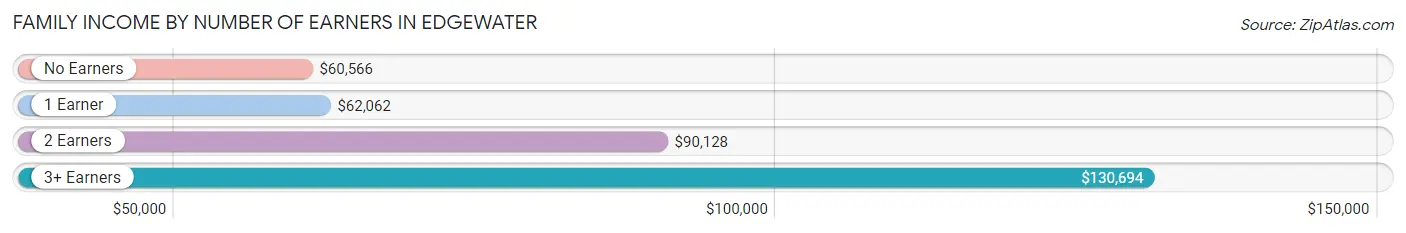
| Number of Earners | # Families | Median Income |
| No Earners | 1,767 (29.0%) | $60,566 |
| 1 Earner | 1,785 (29.3%) | $62,062 |
| 2 Earners | 2,130 (34.9%) | $90,128 |
| 3+ Earners | 412 (6.8%) | $130,694 |
| Total | 6,094 (100.0%) | $73,214 |
Household Income in Edgewater
Household Income Brackets in Edgewater
With 2,050 households falling in the category, the $50,000 to $74,999 income range is the most frequent in Edgewater, accounting for 19.3% of all households. In contrast, only 308 households (2.9%) fall into the less than $10,000 income bracket, making it the least populous group.
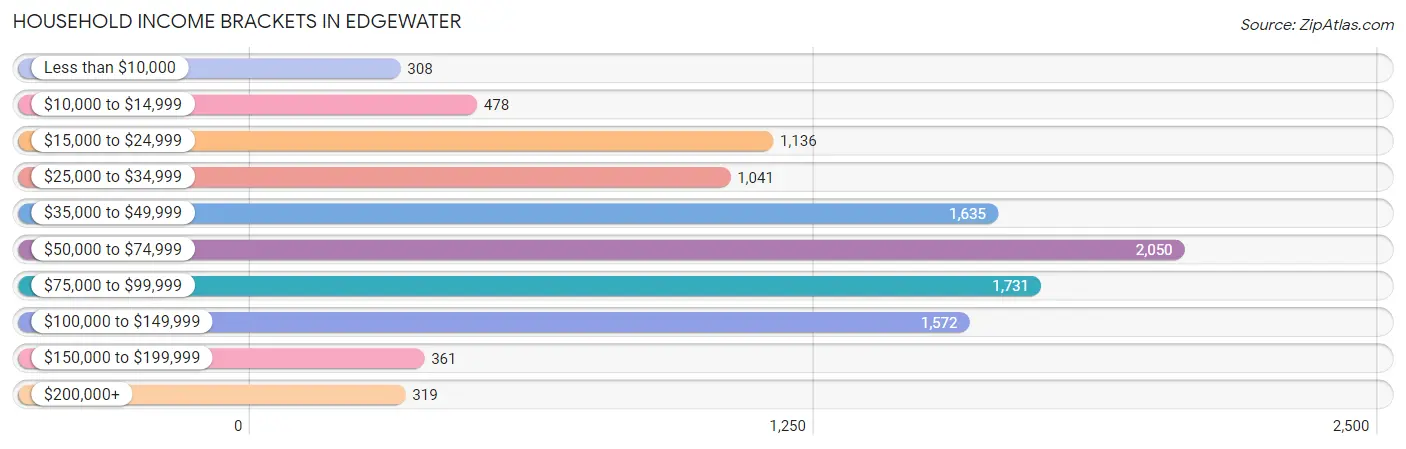
| Income Bracket | # Households | % Households |
| Less than $10,000 | 308 | 2.9% |
| $10,000 to $14,999 | 478 | 4.5% |
| $15,000 to $24,999 | 1,136 | 10.7% |
| $25,000 to $34,999 | 1,041 | 9.8% |
| $35,000 to $49,999 | 1,635 | 15.4% |
| $50,000 to $74,999 | 2,050 | 19.3% |
| $75,000 to $99,999 | 1,731 | 16.3% |
| $100,000 to $149,999 | 1,572 | 14.8% |
| $150,000 to $199,999 | 361 | 3.4% |
| $200,000+ | 319 | 3.0% |
Household Income by Householder Age in Edgewater
The median household income in Edgewater is $56,886, with the highest median household income of $80,521 found in the 25 to 44 years age bracket for the primary householder. A total of 1,784 households (16.8%) fall into this category. Meanwhile, the 65+ years age bracket for the primary householder has the lowest median household income of $45,381, with 5,030 households (47.4%) in this group.
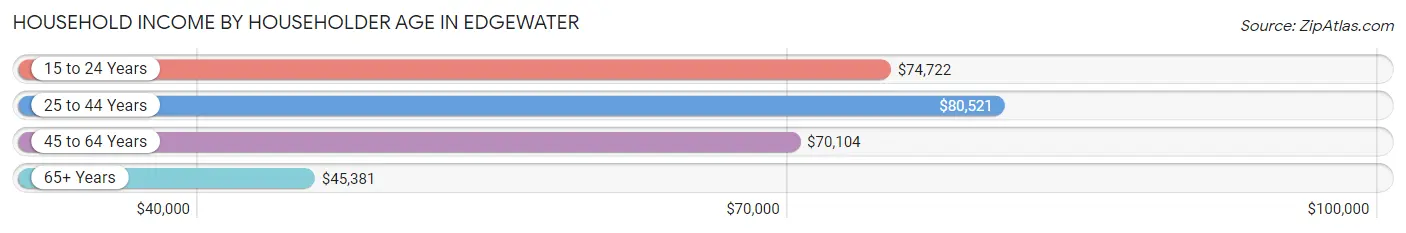
| Income Bracket | # Households | Median Income |
| 15 to 24 Years | 58 (0.5%) | $74,722 |
| 25 to 44 Years | 1,784 (16.8%) | $80,521 |
| 45 to 64 Years | 3,748 (35.3%) | $70,104 |
| 65+ Years | 5,030 (47.4%) | $45,381 |
| Total | 10,620 (100.0%) | $56,886 |
Poverty in Edgewater
Income Below Poverty by Sex and Age in Edgewater
With 10.9% poverty level for males and 9.8% for females among the residents of Edgewater, under 5 year old males and 5 year old females are the most vulnerable to poverty, with 216 males (40.5%) and 9 females (33.3%) in their respective age groups living below the poverty level.
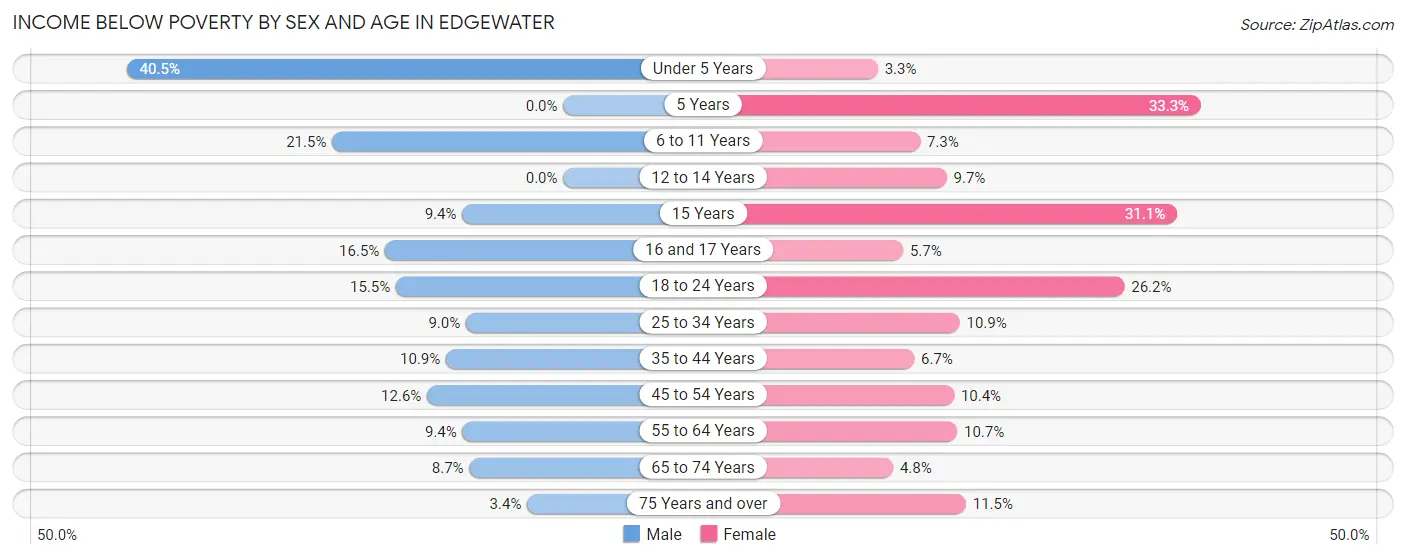
| Age Bracket | Male | Female |
| Under 5 Years | 216 (40.5%) | 11 (3.3%) |
| 5 Years | 0 (0.0%) | 9 (33.3%) |
| 6 to 11 Years | 59 (21.4%) | 45 (7.3%) |
| 12 to 14 Years | 0 (0.0%) | 39 (9.7%) |
| 15 Years | 6 (9.4%) | 14 (31.1%) |
| 16 and 17 Years | 22 (16.5%) | 15 (5.7%) |
| 18 to 24 Years | 88 (15.5%) | 178 (26.2%) |
| 25 to 34 Years | 125 (9.0%) | 130 (10.9%) |
| 35 to 44 Years | 125 (10.9%) | 59 (6.7%) |
| 45 to 54 Years | 157 (12.6%) | 131 (10.4%) |
| 55 to 64 Years | 183 (9.3%) | 218 (10.7%) |
| 65 to 74 Years | 161 (8.7%) | 113 (4.8%) |
| 75 Years and over | 44 (3.4%) | 223 (11.5%) |
| Total | 1,186 (10.9%) | 1,185 (9.8%) |
Income Above Poverty by Sex and Age in Edgewater
According to the poverty statistics in Edgewater, males aged 5 years and females aged under 5 years are the age groups that are most secure financially, with 100.0% of males and 96.7% of females in these age groups living above the poverty line.
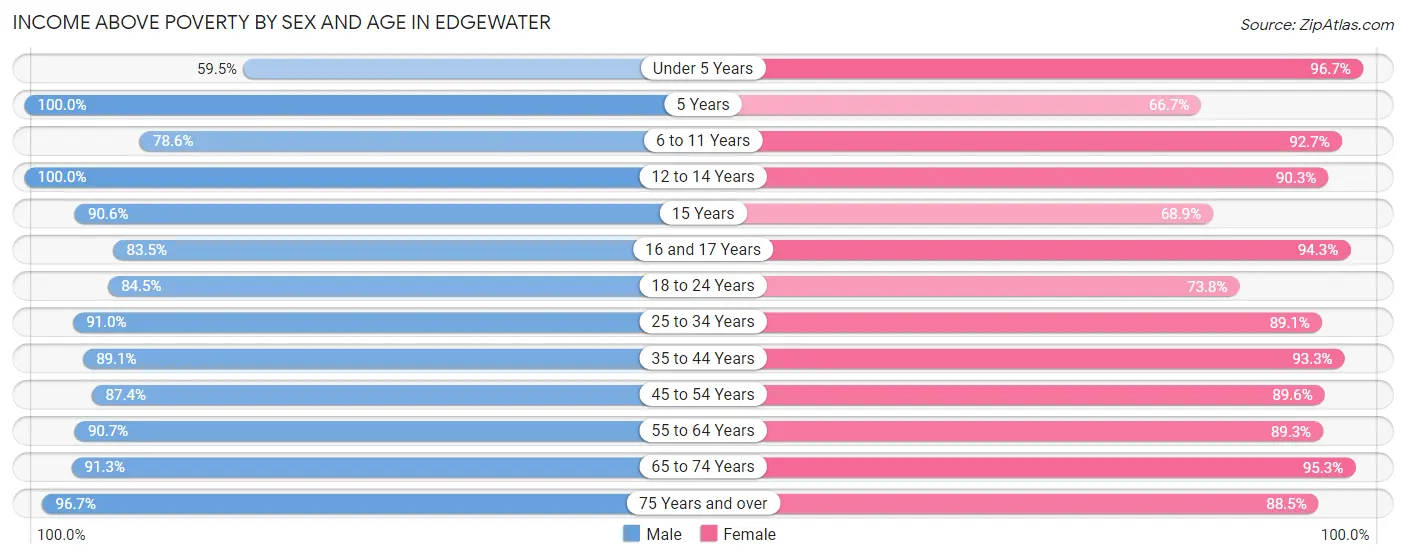
| Age Bracket | Male | Female |
| Under 5 Years | 317 (59.5%) | 319 (96.7%) |
| 5 Years | 92 (100.0%) | 18 (66.7%) |
| 6 to 11 Years | 216 (78.5%) | 575 (92.7%) |
| 12 to 14 Years | 280 (100.0%) | 362 (90.3%) |
| 15 Years | 58 (90.6%) | 31 (68.9%) |
| 16 and 17 Years | 111 (83.5%) | 249 (94.3%) |
| 18 to 24 Years | 479 (84.5%) | 501 (73.8%) |
| 25 to 34 Years | 1,259 (91.0%) | 1,059 (89.1%) |
| 35 to 44 Years | 1,024 (89.1%) | 820 (93.3%) |
| 45 to 54 Years | 1,085 (87.4%) | 1,127 (89.6%) |
| 55 to 64 Years | 1,775 (90.6%) | 1,819 (89.3%) |
| 65 to 74 Years | 1,686 (91.3%) | 2,266 (95.3%) |
| 75 Years and over | 1,271 (96.7%) | 1,715 (88.5%) |
| Total | 9,653 (89.1%) | 10,861 (90.2%) |
Income Below Poverty Among Married-Couple Families in Edgewater
The poverty statistics for married-couple families in Edgewater show that 3.3% or 144 of the total 4,414 families live below the poverty line. Families with 1 or 2 children have the highest poverty rate of 9.5%, comprising of 79 families. On the other hand, families with 3 or 4 children have the lowest poverty rate of 0.0%, which includes 0 families.
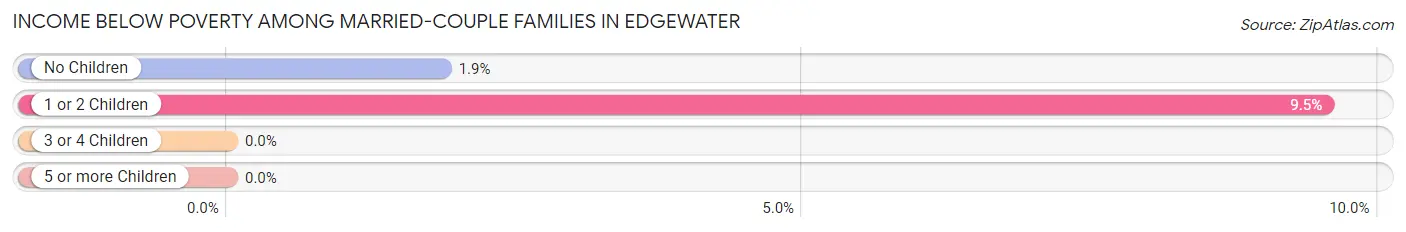
| Children | Above Poverty | Below Poverty |
| No Children | 3,435 (98.1%) | 65 (1.9%) |
| 1 or 2 Children | 749 (90.5%) | 79 (9.5%) |
| 3 or 4 Children | 86 (100.0%) | 0 (0.0%) |
| 5 or more Children | 0 (0.0%) | 0 (0.0%) |
| Total | 4,270 (96.7%) | 144 (3.3%) |
Income Below Poverty Among Single-Parent Households in Edgewater
According to the poverty data in Edgewater, 9.8% or 35 single-father households and 14.1% or 186 single-mother households are living below the poverty line. Among single-father households, those with 1 or 2 children have the highest poverty rate, with 18 households (13.4%) experiencing poverty. Likewise, among single-mother households, those with 1 or 2 children have the highest poverty rate, with 124 households (20.2%) falling below the poverty line.
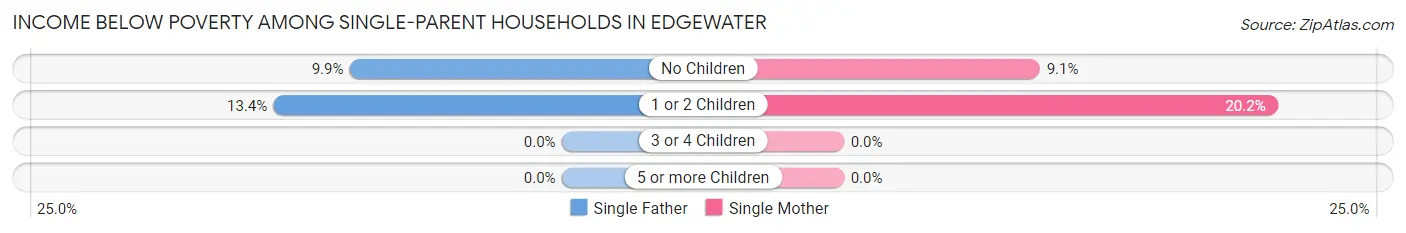
| Children | Single Father | Single Mother |
| No Children | 17 (9.9%) | 62 (9.1%) |
| 1 or 2 Children | 18 (13.4%) | 124 (20.2%) |
| 3 or 4 Children | 0 (0.0%) | 0 (0.0%) |
| 5 or more Children | 0 (0.0%) | 0 (0.0%) |
| Total | 35 (9.8%) | 186 (14.1%) |
Income Below Poverty Among Married-Couple vs Single-Parent Households in Edgewater
The poverty data for Edgewater shows that 144 of the married-couple family households (3.3%) and 221 of the single-parent households (13.2%) are living below the poverty level. Within the married-couple family households, those with 1 or 2 children have the highest poverty rate, with 79 households (9.5%) falling below the poverty line. Among the single-parent households, those with 1 or 2 children have the highest poverty rate, with 142 household (19.0%) living below poverty.
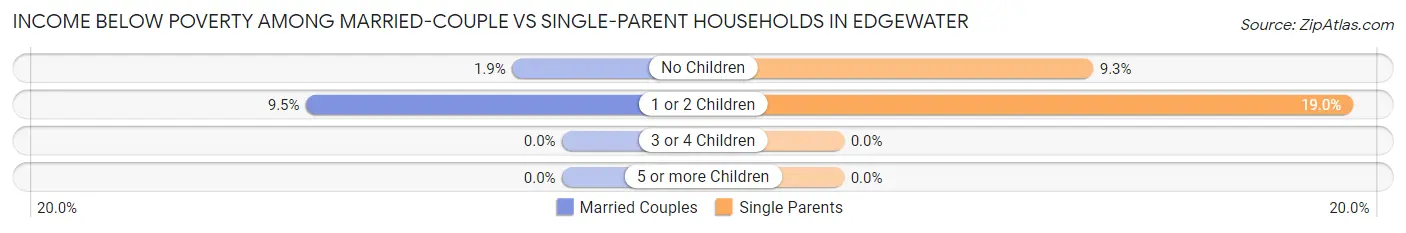
| Children | Married-Couple Families | Single-Parent Households |
| No Children | 65 (1.9%) | 79 (9.3%) |
| 1 or 2 Children | 79 (9.5%) | 142 (19.0%) |
| 3 or 4 Children | 0 (0.0%) | 0 (0.0%) |
| 5 or more Children | 0 (0.0%) | 0 (0.0%) |
| Total | 144 (3.3%) | 221 (13.2%) |
Race in Edgewater
The most populous races in Edgewater are White / Caucasian (21,060 | 91.0%), Hispanic or Latino (1,493 | 6.5%), and Two or more Races (853 | 3.7%).
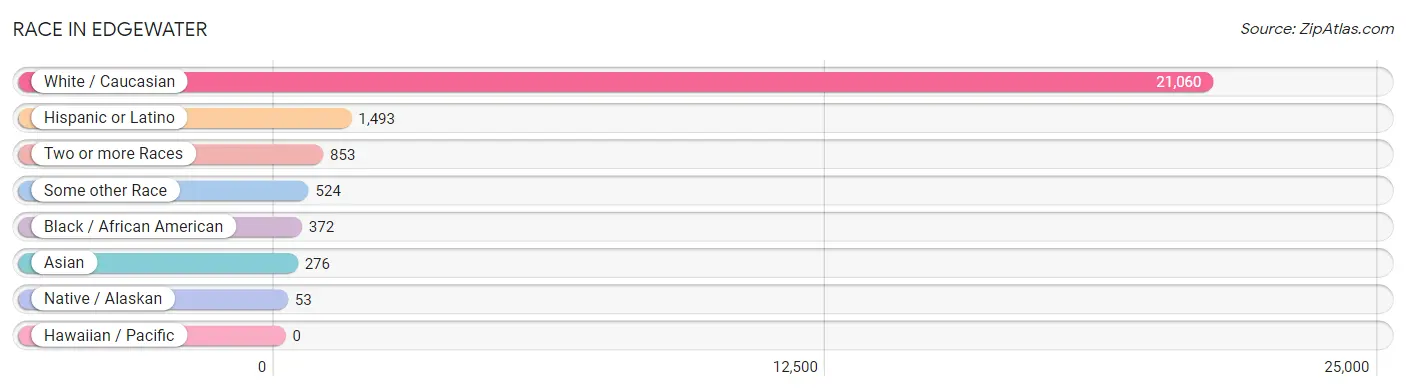
| Race | # Population | % Population |
| Asian | 276 | 1.2% |
| Black / African American | 372 | 1.6% |
| Hawaiian / Pacific | 0 | 0.0% |
| Hispanic or Latino | 1,493 | 6.5% |
| Native / Alaskan | 53 | 0.2% |
| White / Caucasian | 21,060 | 91.0% |
| Two or more Races | 853 | 3.7% |
| Some other Race | 524 | 2.3% |
| Total | 23,138 | 100.0% |
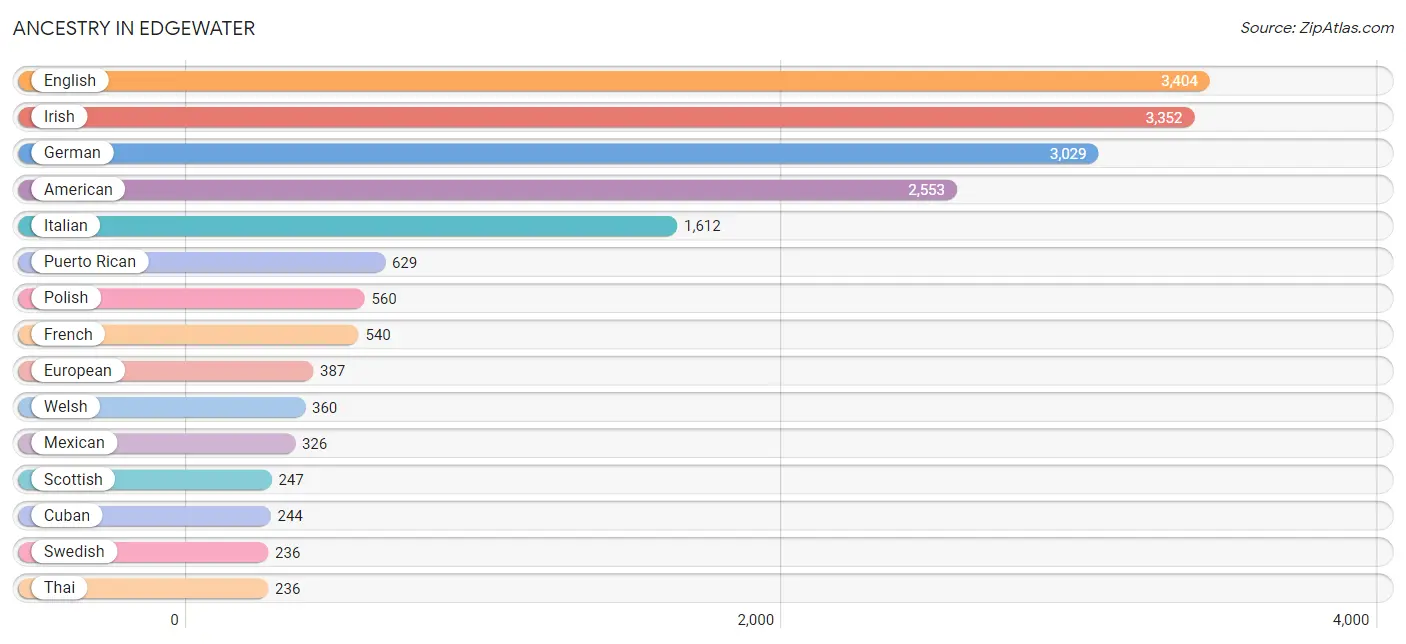
Ancestry in Edgewater
The most populous ancestries reported in Edgewater are English (3,404 | 14.7%), Irish (3,352 | 14.5%), German (3,029 | 13.1%), American (2,553 | 11.0%), and Italian (1,612 | 7.0%), together accounting for 60.3% of all Edgewater residents.
| Ancestry | # Population | % Population |
| African | 14 | 0.1% |
| Albanian | 16 | 0.1% |
| American | 2,553 | 11.0% |
| Arab | 155 | 0.7% |
| Armenian | 13 | 0.1% |
| Belgian | 26 | 0.1% |
| Brazilian | 153 | 0.7% |
| British | 189 | 0.8% |
| Burmese | 14 | 0.1% |
| Canadian | 13 | 0.1% |
| Cherokee | 71 | 0.3% |
| Colombian | 24 | 0.1% |
| Croatian | 21 | 0.1% |
| Cuban | 244 | 1.1% |
| Czech | 98 | 0.4% |
| Dominican | 21 | 0.1% |
| Dutch | 226 | 1.0% |
| Eastern European | 70 | 0.3% |
| Ecuadorian | 12 | 0.1% |
| English | 3,404 | 14.7% |
| European | 387 | 1.7% |
| Finnish | 20 | 0.1% |
| French | 540 | 2.3% |
| French Canadian | 216 | 0.9% |
| German | 3,029 | 13.1% |
| Greek | 85 | 0.4% |
| Hungarian | 55 | 0.2% |
| Irish | 3,352 | 14.5% |
| Italian | 1,612 | 7.0% |
| Jamaican | 35 | 0.2% |
| Korean | 73 | 0.3% |
| Latvian | 18 | 0.1% |
| Lebanese | 99 | 0.4% |
| Lithuanian | 129 | 0.6% |
| Luxembourger | 15 | 0.1% |
| Macedonian | 20 | 0.1% |
| Mexican | 326 | 1.4% |
| Native Hawaiian | 5 | 0.0% |
| New Zealander | 47 | 0.2% |
| Norwegian | 187 | 0.8% |
| Paraguayan | 20 | 0.1% |
| Peruvian | 38 | 0.2% |
| Polish | 560 | 2.4% |
| Portuguese | 11 | 0.1% |
| Puerto Rican | 629 | 2.7% |
| Russian | 55 | 0.2% |
| Scandinavian | 83 | 0.4% |
| Scotch-Irish | 154 | 0.7% |
| Scottish | 247 | 1.1% |
| Serbian | 21 | 0.1% |
| Slavic | 10 | 0.0% |
| Slovak | 42 | 0.2% |
| South American | 109 | 0.5% |
| Spaniard | 36 | 0.2% |
| Spanish | 33 | 0.1% |
| Sri Lankan | 70 | 0.3% |
| Subsaharan African | 32 | 0.1% |
| Swedish | 236 | 1.0% |
| Swiss | 77 | 0.3% |
| Syrian | 56 | 0.2% |
| Thai | 236 | 1.0% |
| Trinidadian and Tobagonian | 22 | 0.1% |
| Ukrainian | 30 | 0.1% |
| Venezuelan | 15 | 0.1% |
| Welsh | 360 | 1.6% |
| Yugoslavian | 9 | 0.0% | View All 66 Rows |
Immigrants in Edgewater
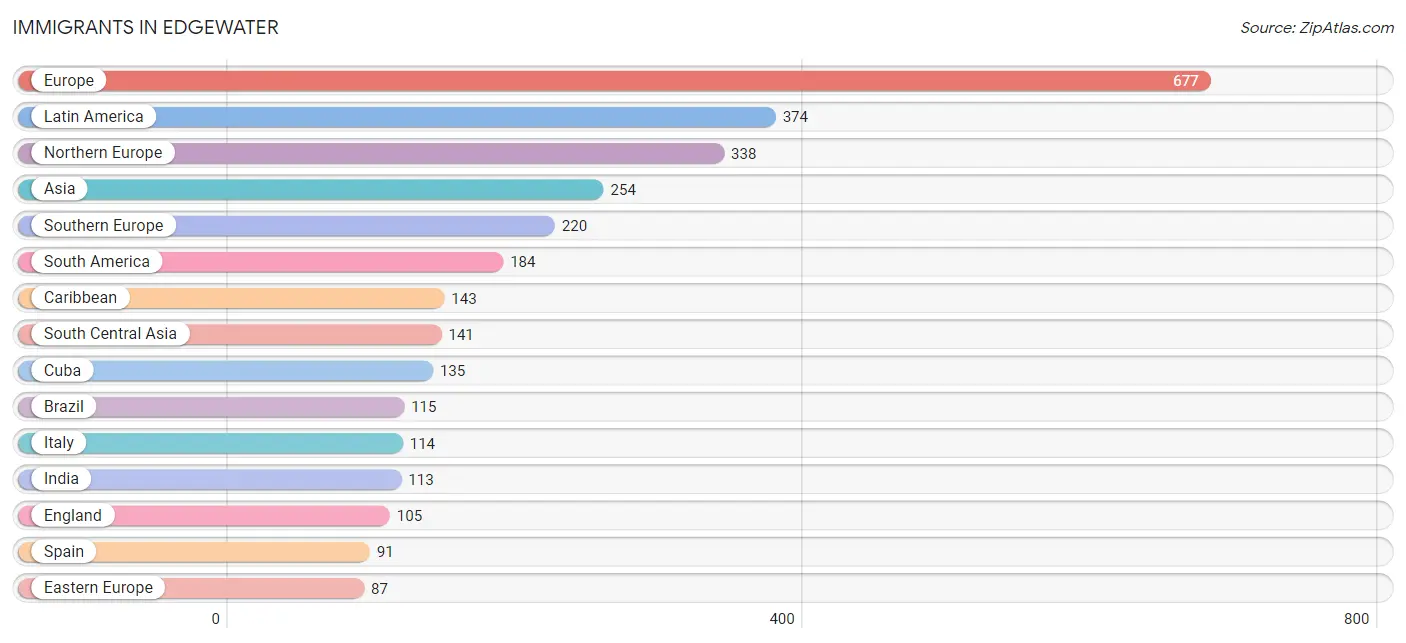
The most numerous immigrant groups reported in Edgewater came from Europe (677 | 2.9%), Latin America (374 | 1.6%), Northern Europe (338 | 1.5%), Asia (254 | 1.1%), and Southern Europe (220 | 0.9%), together accounting for 8.1% of all Edgewater residents.
| Immigration Origin | # Population | % Population |
| Africa | 28 | 0.1% |
| Asia | 254 | 1.1% |
| Brazil | 115 | 0.5% |
| Canada | 50 | 0.2% |
| Caribbean | 143 | 0.6% |
| Central America | 47 | 0.2% |
| Colombia | 24 | 0.1% |
| Cuba | 135 | 0.6% |
| Eastern Africa | 28 | 0.1% |
| Eastern Asia | 14 | 0.1% |
| Eastern Europe | 87 | 0.4% |
| England | 105 | 0.4% |
| Europe | 677 | 2.9% |
| France | 8 | 0.0% |
| Germany | 24 | 0.1% |
| Greece | 15 | 0.1% |
| India | 113 | 0.5% |
| Italy | 114 | 0.5% |
| Jamaica | 8 | 0.0% |
| Kenya | 28 | 0.1% |
| Korea | 14 | 0.1% |
| Latin America | 374 | 1.6% |
| Mexico | 2 | 0.0% |
| Nicaragua | 45 | 0.2% |
| Northern Europe | 338 | 1.5% |
| Pakistan | 28 | 0.1% |
| Peru | 10 | 0.0% |
| Philippines | 53 | 0.2% |
| Poland | 10 | 0.0% |
| Scotland | 8 | 0.0% |
| Serbia | 69 | 0.3% |
| South America | 184 | 0.8% |
| South Central Asia | 141 | 0.6% |
| South Eastern Asia | 58 | 0.3% |
| Southern Europe | 220 | 0.9% |
| Spain | 91 | 0.4% |
| Ukraine | 8 | 0.0% |
| Venezuela | 15 | 0.1% |
| Vietnam | 5 | 0.0% |
| Western Europe | 32 | 0.1% | View All 40 Rows |
Sex and Age in Edgewater
Sex and Age in Edgewater
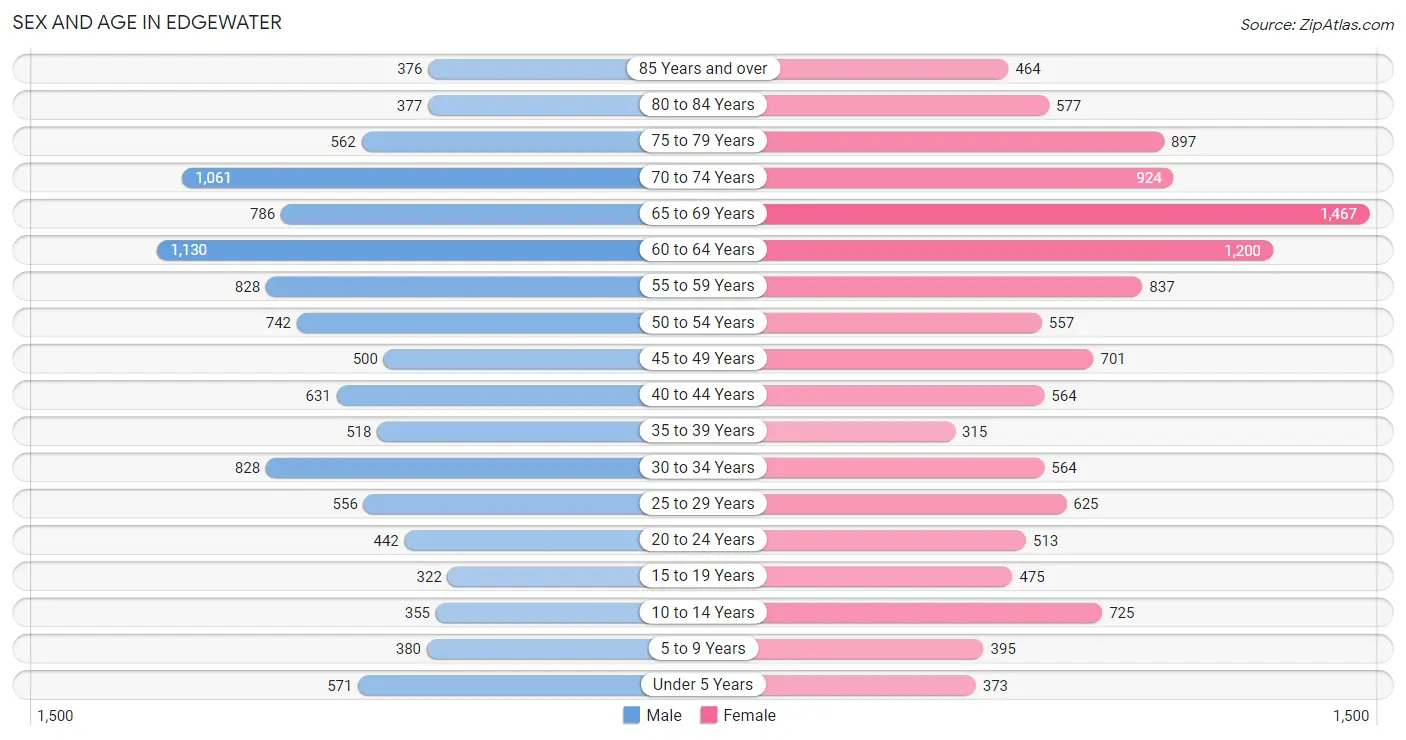
The most populous age groups in Edgewater are 60 to 64 Years (1,130 | 10.3%) for men and 65 to 69 Years (1,467 | 12.0%) for women.
| Age Bracket | Male | Female |
| Under 5 Years | 571 (5.2%) | 373 (3.1%) |
| 5 to 9 Years | 380 (3.5%) | 395 (3.2%) |
| 10 to 14 Years | 355 (3.2%) | 725 (6.0%) |
| 15 to 19 Years | 322 (2.9%) | 475 (3.9%) |
| 20 to 24 Years | 442 (4.0%) | 513 (4.2%) |
| 25 to 29 Years | 556 (5.1%) | 625 (5.1%) |
| 30 to 34 Years | 828 (7.5%) | 564 (4.6%) |
| 35 to 39 Years | 518 (4.7%) | 315 (2.6%) |
| 40 to 44 Years | 631 (5.8%) | 564 (4.6%) |
| 45 to 49 Years | 500 (4.6%) | 701 (5.8%) |
| 50 to 54 Years | 742 (6.8%) | 557 (4.6%) |
| 55 to 59 Years | 828 (7.5%) | 837 (6.9%) |
| 60 to 64 Years | 1,130 (10.3%) | 1,200 (9.9%) |
| 65 to 69 Years | 786 (7.2%) | 1,467 (12.0%) |
| 70 to 74 Years | 1,061 (9.7%) | 924 (7.6%) |
| 75 to 79 Years | 562 (5.1%) | 897 (7.4%) |
| 80 to 84 Years | 377 (3.4%) | 577 (4.7%) |
| 85 Years and over | 376 (3.4%) | 464 (3.8%) |
| Total | 10,965 (100.0%) | 12,173 (100.0%) |
Families and Households in Edgewater
Median Family Size in Edgewater
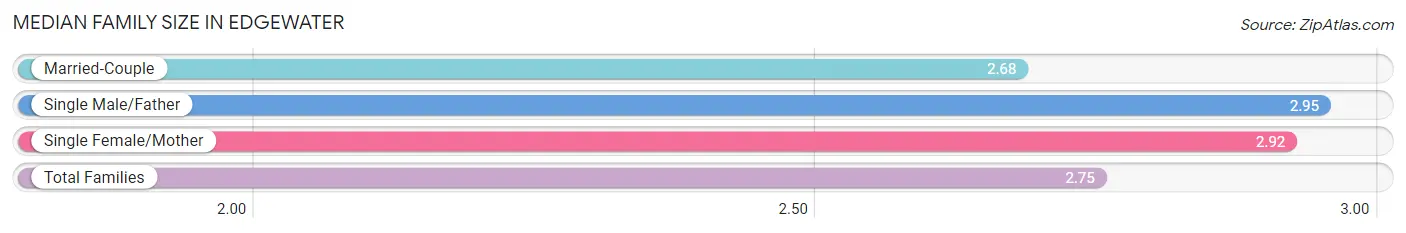
The median family size in Edgewater is 2.75 persons per family, with single male/father families (359 | 5.9%) accounting for the largest median family size of 2.95 persons per family. On the other hand, married-couple families (4,414 | 72.4%) represent the smallest median family size with 2.68 persons per family.
| Family Type | # Families | Family Size |
| Married-Couple | 4,414 (72.4%) | 2.68 |
| Single Male/Father | 359 (5.9%) | 2.95 |
| Single Female/Mother | 1,321 (21.7%) | 2.92 |
| Total Families | 6,094 (100.0%) | 2.75 |
Median Household Size in Edgewater
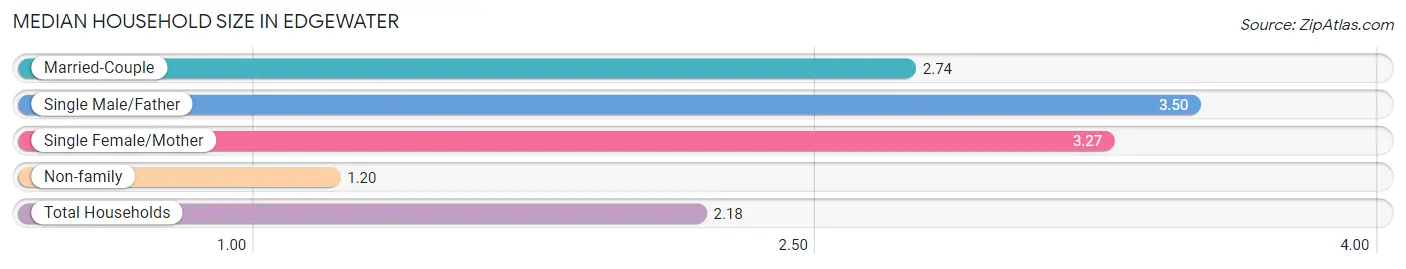
The median household size in Edgewater is 2.18 persons per household, with single male/father households (359 | 3.4%) accounting for the largest median household size of 3.5 persons per household. non-family households (4,526 | 42.6%) represent the smallest median household size with 1.20 persons per household.
| Household Type | # Households | Household Size |
| Married-Couple | 4,414 (41.6%) | 2.74 |
| Single Male/Father | 359 (3.4%) | 3.50 |
| Single Female/Mother | 1,321 (12.4%) | 3.27 |
| Non-family | 4,526 (42.6%) | 1.20 |
| Total Households | 10,620 (100.0%) | 2.18 |
Household Size by Marriage Status in Edgewater
Out of a total of 10,620 households in Edgewater, 6,094 (57.4%) are family households, while 4,526 (42.6%) are nonfamily households. The most numerous type of family households are 2-person households, comprising 3,815, and the most common type of nonfamily households are 1-person households, comprising 3,738.
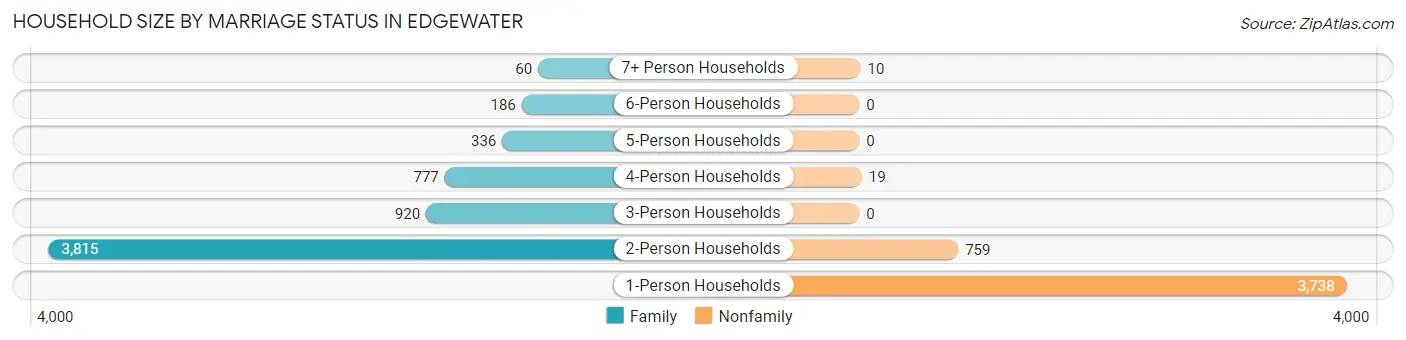
| Household Size | Family Households | Nonfamily Households |
| 1-Person Households | - | 3,738 (35.2%) |
| 2-Person Households | 3,815 (35.9%) | 759 (7.1%) |
| 3-Person Households | 920 (8.7%) | 0 (0.0%) |
| 4-Person Households | 777 (7.3%) | 19 (0.2%) |
| 5-Person Households | 336 (3.2%) | 0 (0.0%) |
| 6-Person Households | 186 (1.8%) | 0 (0.0%) |
| 7+ Person Households | 60 (0.6%) | 10 (0.1%) |
| Total | 6,094 (57.4%) | 4,526 (42.6%) |
Female Fertility in Edgewater
Fertility by Age in Edgewater
Average fertility rate in Edgewater is 49.0 births per 1,000 women. Women in the age bracket of 15 to 19 years have the highest fertility rate with 91.0 births per 1,000 women. Women in the age bracket of 20 to 34 years acount for 65.5% of all women with births.
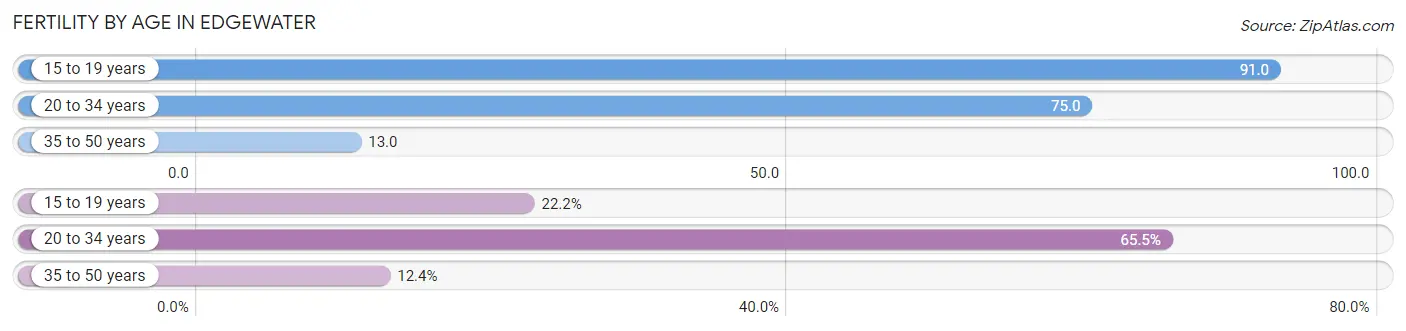
| Age Bracket | Women with Births | Births / 1,000 Women |
| 15 to 19 years | 43 (22.2%) | 91.0 |
| 20 to 34 years | 127 (65.5%) | 75.0 |
| 35 to 50 years | 24 (12.4%) | 13.0 |
| Total | 194 (100.0%) | 49.0 |
Fertility by Age by Marriage Status in Edgewater
32.0% of women with births (194) in Edgewater are married. The highest percentage of unmarried women with births falls into 15 to 19 years age bracket with 100.0% of them unmarried at the time of birth, while the lowest percentage of unmarried women with births belong to 35 to 50 years age bracket with 0.0% of them unmarried.
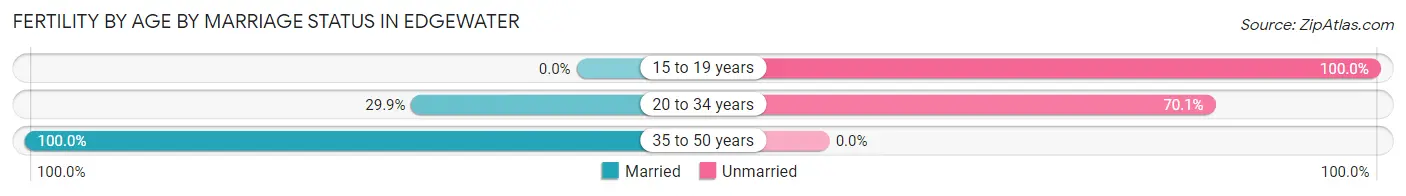
| Age Bracket | Married | Unmarried |
| 15 to 19 years | 0 (0.0%) | 43 (100.0%) |
| 20 to 34 years | 38 (29.9%) | 89 (70.1%) |
| 35 to 50 years | 24 (100.0%) | 0 (0.0%) |
| Total | 62 (32.0%) | 132 (68.0%) |
Fertility by Education in Edgewater
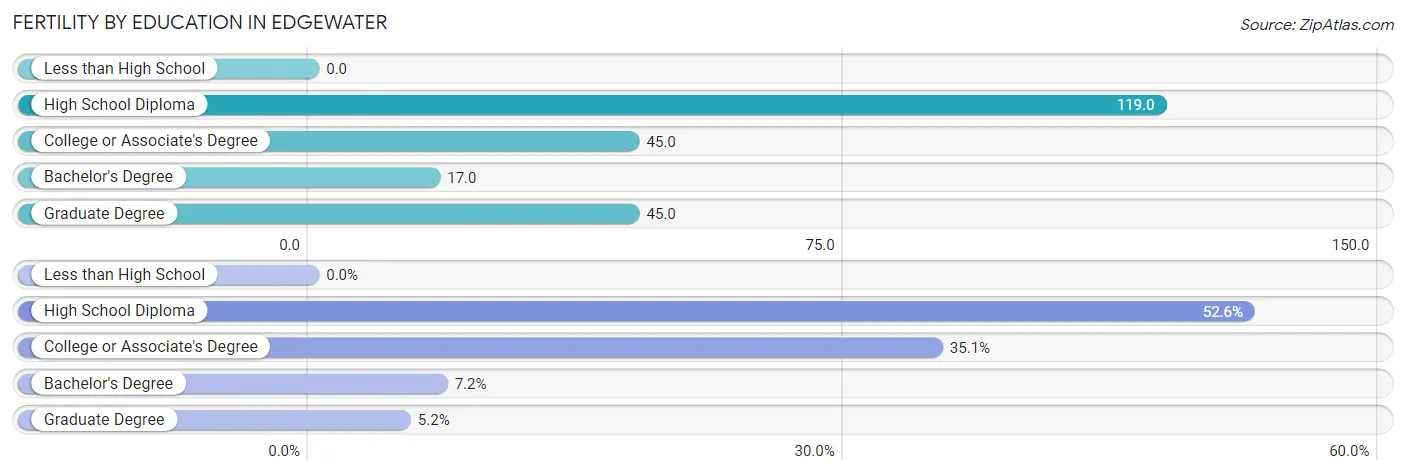
| Educational Attainment | Women with Births | Births / 1,000 Women |
| Less than High School | 0 (0.0%) | 0.0 |
| High School Diploma | 102 (52.6%) | 119.0 |
| College or Associate's Degree | 68 (35.0%) | 45.0 |
| Bachelor's Degree | 14 (7.2%) | 17.0 |
| Graduate Degree | 10 (5.1%) | 45.0 |
| Total | 194 (100.0%) | 49.0 |
Fertility by Education by Marriage Status in Edgewater
68.0% of women with births in Edgewater are unmarried. Women with the educational attainment of bachelor's degree are most likely to be married with 100.0% of them married at childbirth, while women with the educational attainment of high school diploma are least likely to be married with 87.3% of them unmarried at childbirth.
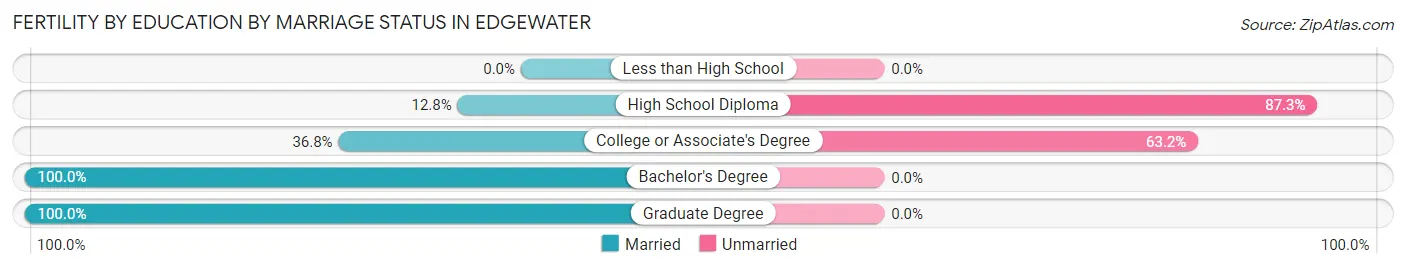
| Educational Attainment | Married | Unmarried |
| Less than High School | 0 (0.0%) | 0 (0.0%) |
| High School Diploma | 13 (12.8%) | 89 (87.3%) |
| College or Associate's Degree | 25 (36.8%) | 43 (63.2%) |
| Bachelor's Degree | 14 (100.0%) | 0 (0.0%) |
| Graduate Degree | 10 (100.0%) | 0 (0.0%) |
| Total | 62 (32.0%) | 132 (68.0%) |
Employment Characteristics in Edgewater
Employment by Class of Employer in Edgewater
Among the 9,814 employed individuals in Edgewater, private company employees (6,413 | 65.3%), self-employed (not incorporated) (1,100 | 11.2%), and self-employed (incorporated) (763 | 7.8%) make up the most common classes of employment.
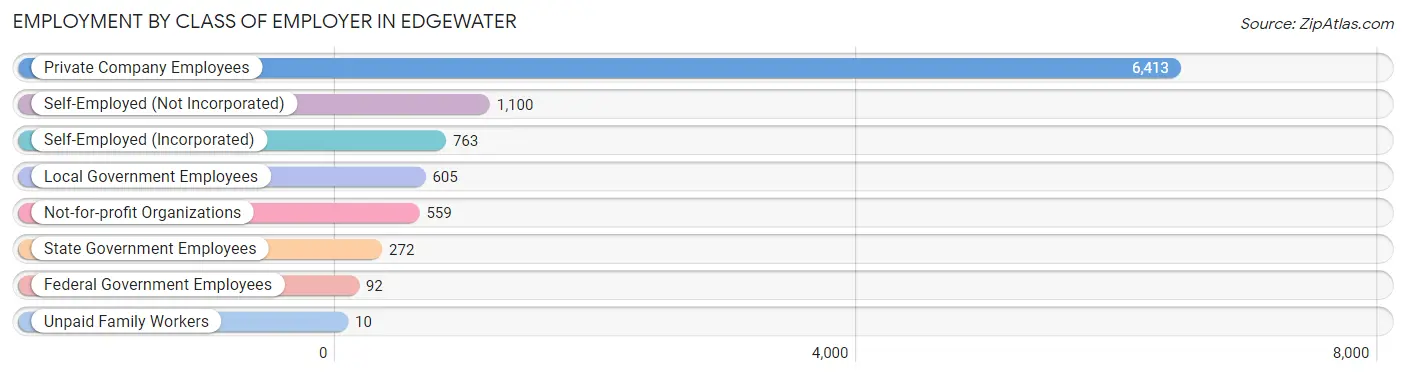
| Employer Class | # Employees | % Employees |
| Private Company Employees | 6,413 | 65.3% |
| Self-Employed (Incorporated) | 763 | 7.8% |
| Self-Employed (Not Incorporated) | 1,100 | 11.2% |
| Not-for-profit Organizations | 559 | 5.7% |
| Local Government Employees | 605 | 6.2% |
| State Government Employees | 272 | 2.8% |
| Federal Government Employees | 92 | 0.9% |
| Unpaid Family Workers | 10 | 0.1% |
| Total | 9,814 | 100.0% |
Employment Status by Age in Edgewater
According to the labor force statistics for Edgewater, out of the total population over 16 years of age (20,230), 52.2% or 10,560 individuals are in the labor force, with 2.6% or 275 of them unemployed. The age group with the highest labor force participation rate is 25 to 29 years, with 89.9% or 1,062 individuals in the labor force. Within the labor force, the 20 to 24 years age range has the highest percentage of unemployed individuals, with 7.5% or 56 of them being unemployed.
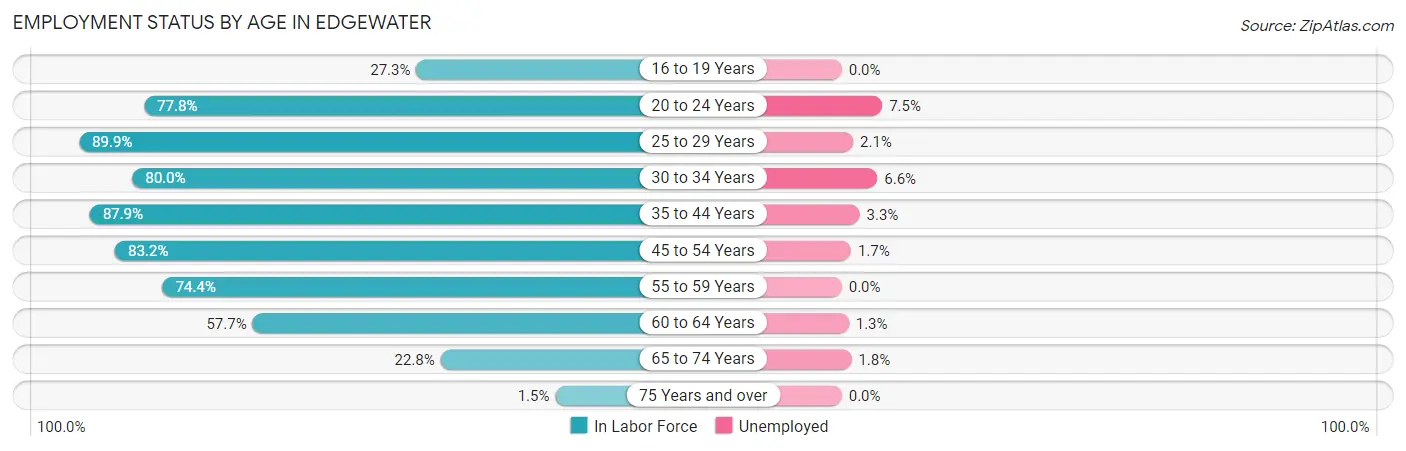
| Age Bracket | In Labor Force | Unemployed |
| 16 to 19 Years | 188 (27.3%) | 0 (0.0%) |
| 20 to 24 Years | 743 (77.8%) | 56 (7.5%) |
| 25 to 29 Years | 1,062 (89.9%) | 22 (2.1%) |
| 30 to 34 Years | 1,114 (80.0%) | 74 (6.6%) |
| 35 to 44 Years | 1,783 (87.9%) | 59 (3.3%) |
| 45 to 54 Years | 2,080 (83.2%) | 35 (1.7%) |
| 55 to 59 Years | 1,239 (74.4%) | 0 (0.0%) |
| 60 to 64 Years | 1,344 (57.7%) | 17 (1.3%) |
| 65 to 74 Years | 966 (22.8%) | 17 (1.8%) |
| 75 Years and over | 49 (1.5%) | 0 (0.0%) |
| Total | 10,560 (52.2%) | 275 (2.6%) |
Employment Status by Educational Attainment in Edgewater
According to labor force statistics for Edgewater, 77.7% of individuals (8,622) out of the total population between 25 and 64 years of age (11,096) are in the labor force, with 2.4% or 207 of them being unemployed. The group with the highest labor force participation rate are those with the educational attainment of bachelor's degree or higher, with 84.9% or 2,063 individuals in the labor force. Within the labor force, individuals with high school diploma education have the highest percentage of unemployment, with 3.0% or 81 of them being unemployed.
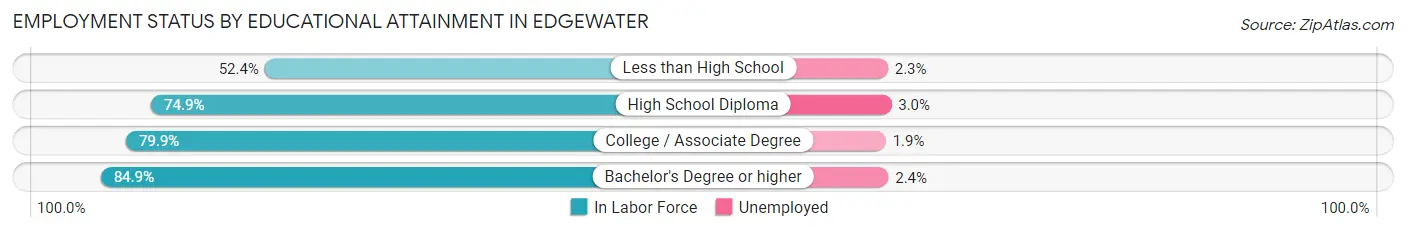
| Educational Attainment | In Labor Force | Unemployed |
| Less than High School | 352 (52.4%) | 15 (2.3%) |
| High School Diploma | 2,693 (74.9%) | 108 (3.0%) |
| College / Associate Degree | 3,515 (79.9%) | 84 (1.9%) |
| Bachelor's Degree or higher | 2,063 (84.9%) | 58 (2.4%) |
| Total | 8,622 (77.7%) | 266 (2.4%) |
Employment Occupations by Sex in Edgewater
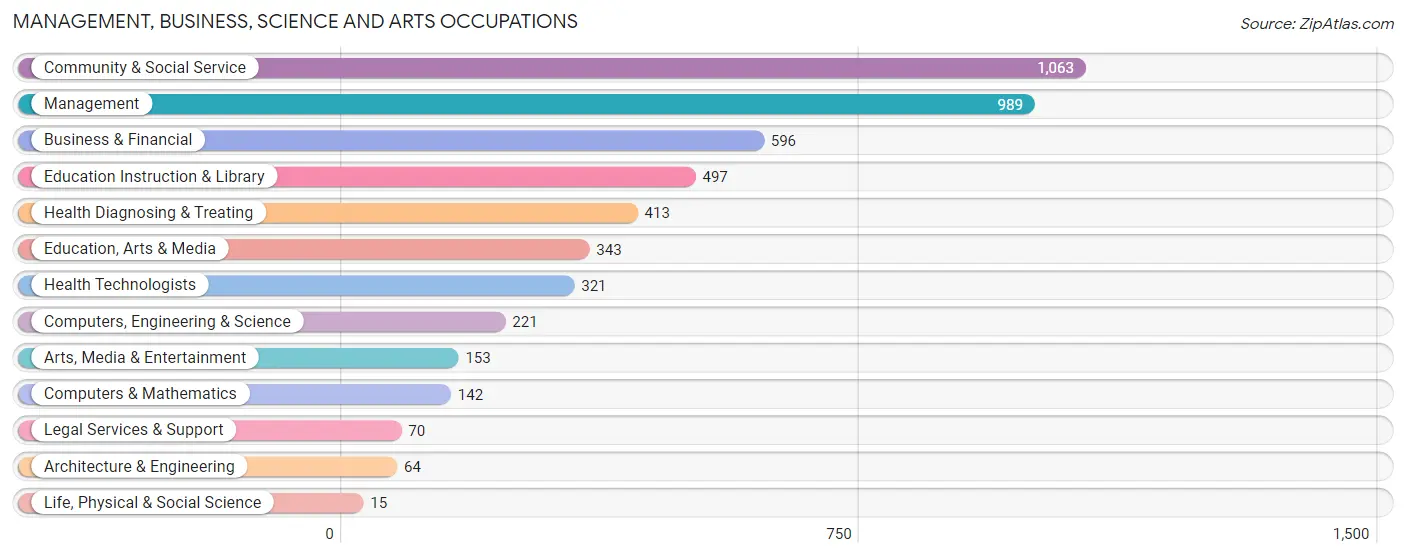
Management, Business, Science and Arts Occupations
The most common Management, Business, Science and Arts occupations in Edgewater are Community & Social Service (1,063 | 10.3%), Management (989 | 9.6%), Business & Financial (596 | 5.8%), Education Instruction & Library (497 | 4.8%), and Health Diagnosing & Treating (413 | 4.0%).
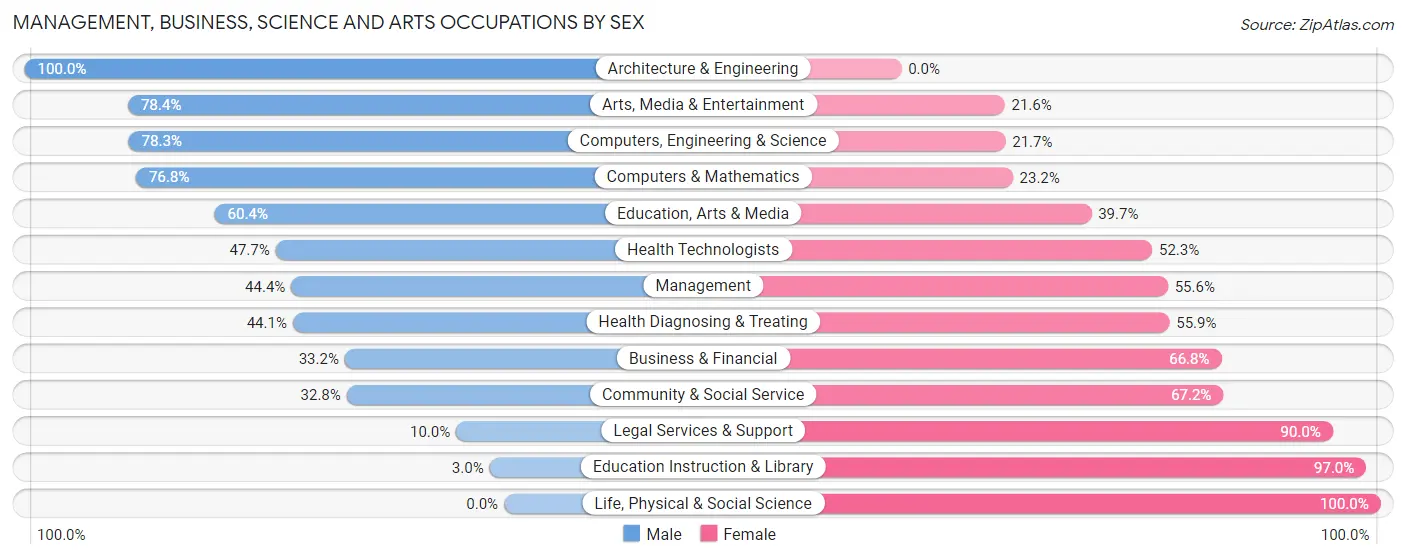
Management, Business, Science and Arts Occupations by Sex
Within the Management, Business, Science and Arts occupations in Edgewater, the most male-oriented occupations are Architecture & Engineering (100.0%), Arts, Media & Entertainment (78.4%), and Computers, Engineering & Science (78.3%), while the most female-oriented occupations are Life, Physical & Social Science (100.0%), Education Instruction & Library (97.0%), and Legal Services & Support (90.0%).
| Occupation | Male | Female |
| Management | 439 (44.4%) | 550 (55.6%) |
| Business & Financial | 198 (33.2%) | 398 (66.8%) |
| Computers, Engineering & Science | 173 (78.3%) | 48 (21.7%) |
| Computers & Mathematics | 109 (76.8%) | 33 (23.2%) |
| Architecture & Engineering | 64 (100.0%) | 0 (0.0%) |
| Life, Physical & Social Science | 0 (0.0%) | 15 (100.0%) |
| Community & Social Service | 349 (32.8%) | 714 (67.2%) |
| Education, Arts & Media | 207 (60.4%) | 136 (39.7%) |
| Legal Services & Support | 7 (10.0%) | 63 (90.0%) |
| Education Instruction & Library | 15 (3.0%) | 482 (97.0%) |
| Arts, Media & Entertainment | 120 (78.4%) | 33 (21.6%) |
| Health Diagnosing & Treating | 182 (44.1%) | 231 (55.9%) |
| Health Technologists | 153 (47.7%) | 168 (52.3%) |
| Total (Category) | 1,341 (40.9%) | 1,941 (59.1%) |
| Total (Overall) | 5,422 (52.7%) | 4,865 (47.3%) |
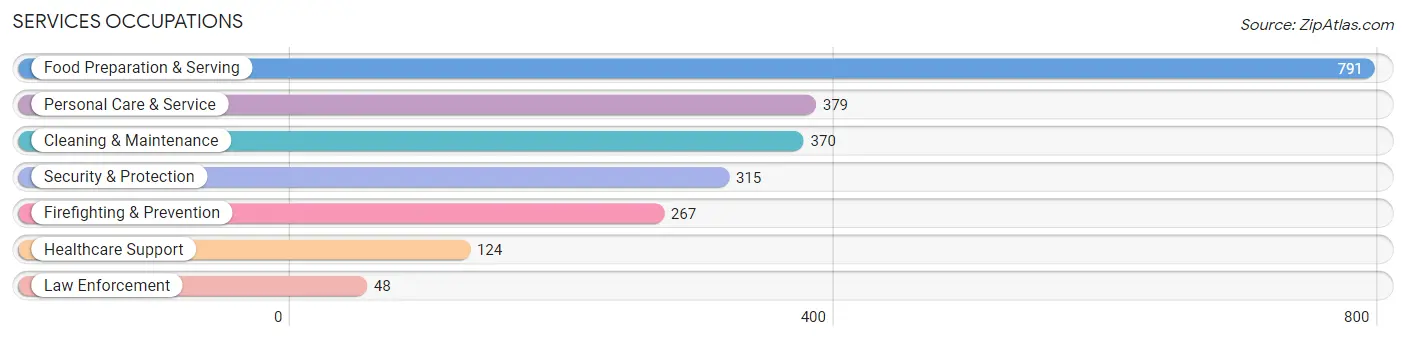
Services Occupations
The most common Services occupations in Edgewater are Food Preparation & Serving (791 | 7.7%), Personal Care & Service (379 | 3.7%), Cleaning & Maintenance (370 | 3.6%), Security & Protection (315 | 3.1%), and Firefighting & Prevention (267 | 2.6%).
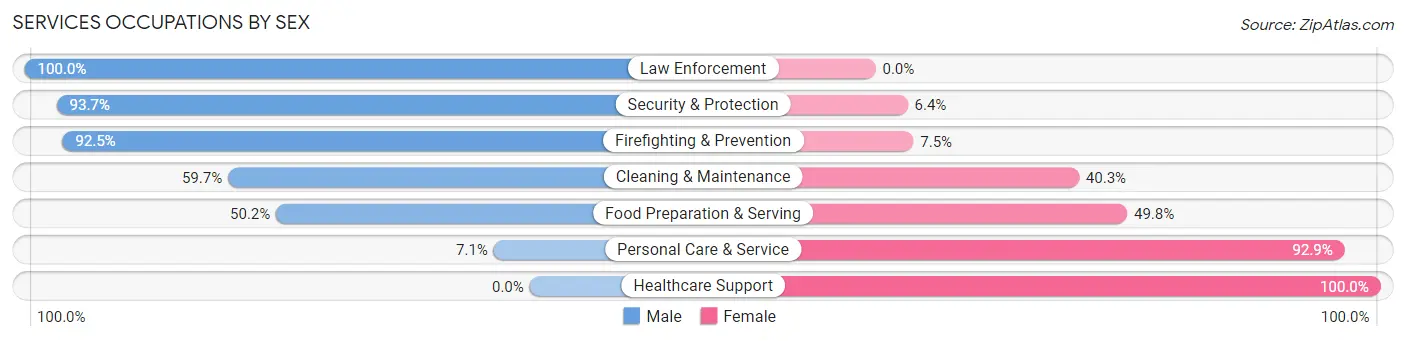
Services Occupations by Sex
Within the Services occupations in Edgewater, the most male-oriented occupations are Law Enforcement (100.0%), Security & Protection (93.6%), and Firefighting & Prevention (92.5%), while the most female-oriented occupations are Healthcare Support (100.0%), Personal Care & Service (92.9%), and Food Preparation & Serving (49.8%).
| Occupation | Male | Female |
| Healthcare Support | 0 (0.0%) | 124 (100.0%) |
| Security & Protection | 295 (93.6%) | 20 (6.4%) |
| Firefighting & Prevention | 247 (92.5%) | 20 (7.5%) |
| Law Enforcement | 48 (100.0%) | 0 (0.0%) |
| Food Preparation & Serving | 397 (50.2%) | 394 (49.8%) |
| Cleaning & Maintenance | 221 (59.7%) | 149 (40.3%) |
| Personal Care & Service | 27 (7.1%) | 352 (92.9%) |
| Total (Category) | 940 (47.5%) | 1,039 (52.5%) |
| Total (Overall) | 5,422 (52.7%) | 4,865 (47.3%) |
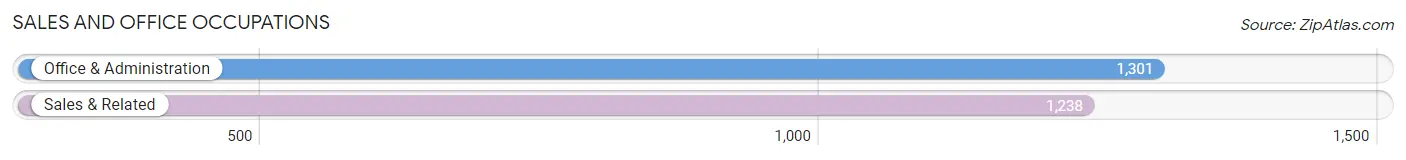
Sales and Office Occupations
The most common Sales and Office occupations in Edgewater are Office & Administration (1,301 | 12.7%), and Sales & Related (1,238 | 12.0%).
Sales and Office Occupations by Sex
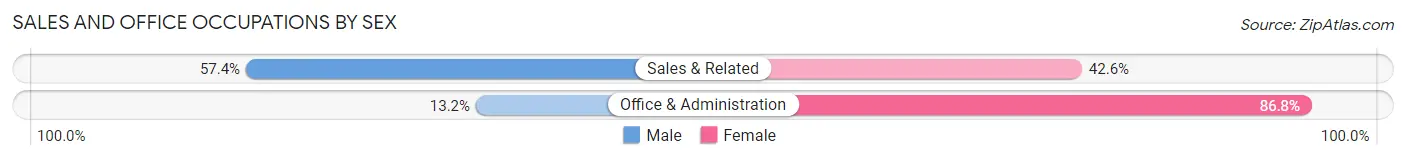
| Occupation | Male | Female |
| Sales & Related | 711 (57.4%) | 527 (42.6%) |
| Office & Administration | 172 (13.2%) | 1,129 (86.8%) |
| Total (Category) | 883 (34.8%) | 1,656 (65.2%) |
| Total (Overall) | 5,422 (52.7%) | 4,865 (47.3%) |
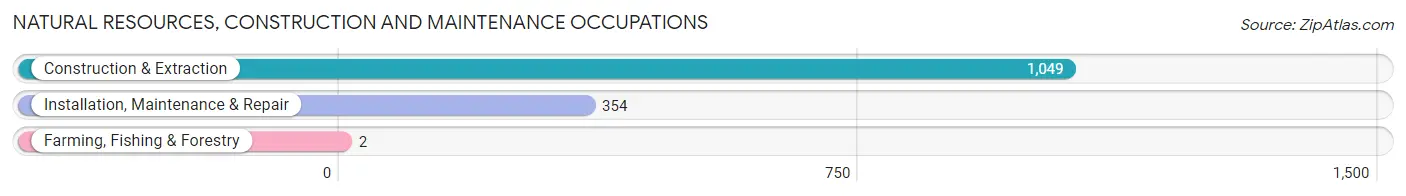
Natural Resources, Construction and Maintenance Occupations
The most common Natural Resources, Construction and Maintenance occupations in Edgewater are Construction & Extraction (1,049 | 10.2%), Installation, Maintenance & Repair (354 | 3.4%), and Farming, Fishing & Forestry (2 | 0.0%).
Natural Resources, Construction and Maintenance Occupations by Sex
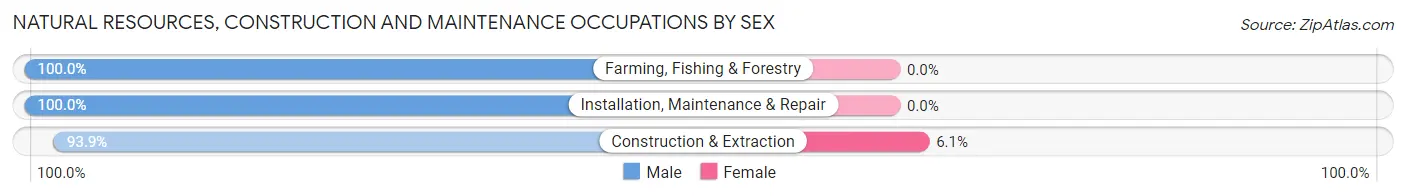
| Occupation | Male | Female |
| Farming, Fishing & Forestry | 2 (100.0%) | 0 (0.0%) |
| Construction & Extraction | 985 (93.9%) | 64 (6.1%) |
| Installation, Maintenance & Repair | 354 (100.0%) | 0 (0.0%) |
| Total (Category) | 1,341 (95.4%) | 64 (4.6%) |
| Total (Overall) | 5,422 (52.7%) | 4,865 (47.3%) |
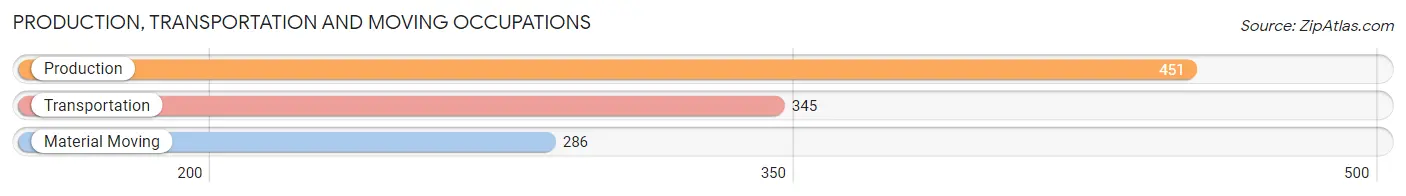
Production, Transportation and Moving Occupations
The most common Production, Transportation and Moving occupations in Edgewater are Production (451 | 4.4%), Transportation (345 | 3.4%), and Material Moving (286 | 2.8%).
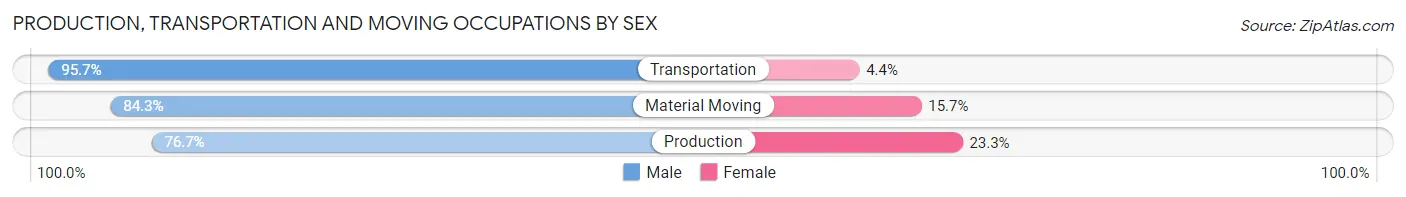
Production, Transportation and Moving Occupations by Sex
| Occupation | Male | Female |
| Production | 346 (76.7%) | 105 (23.3%) |
| Transportation | 330 (95.7%) | 15 (4.3%) |
| Material Moving | 241 (84.3%) | 45 (15.7%) |
| Total (Category) | 917 (84.8%) | 165 (15.2%) |
| Total (Overall) | 5,422 (52.7%) | 4,865 (47.3%) |
Employment Industries by Sex in Edgewater
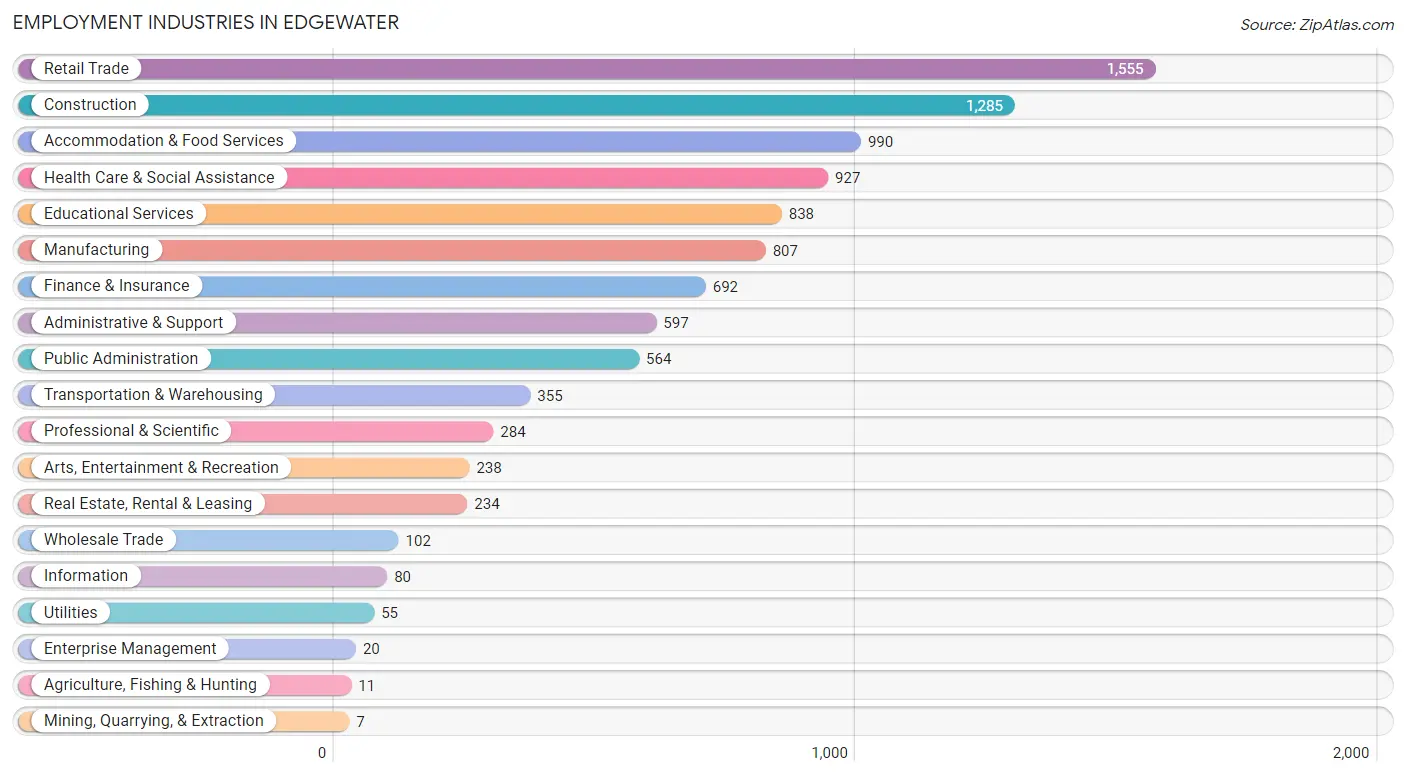
Employment Industries in Edgewater
The major employment industries in Edgewater include Retail Trade (1,555 | 15.1%), Construction (1,285 | 12.5%), Accommodation & Food Services (990 | 9.6%), Health Care & Social Assistance (927 | 9.0%), and Educational Services (838 | 8.2%).
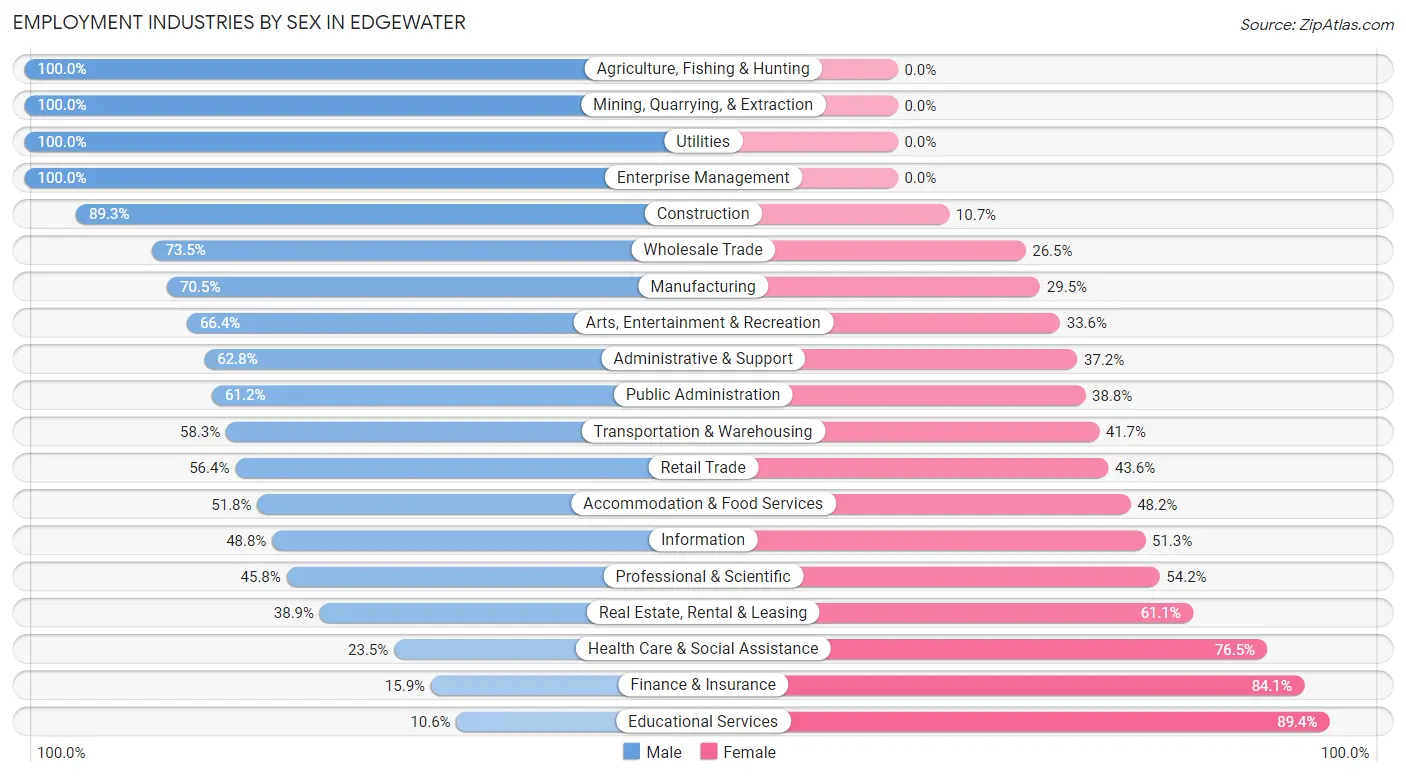
Employment Industries by Sex in Edgewater
The Edgewater industries that see more men than women are Agriculture, Fishing & Hunting (100.0%), Mining, Quarrying, & Extraction (100.0%), and Utilities (100.0%), whereas the industries that tend to have a higher number of women are Educational Services (89.4%), Finance & Insurance (84.1%), and Health Care & Social Assistance (76.5%).
| Industry | Male | Female |
| Agriculture, Fishing & Hunting | 11 (100.0%) | 0 (0.0%) |
| Mining, Quarrying, & Extraction | 7 (100.0%) | 0 (0.0%) |
| Construction | 1,148 (89.3%) | 137 (10.7%) |
| Manufacturing | 569 (70.5%) | 238 (29.5%) |
| Wholesale Trade | 75 (73.5%) | 27 (26.5%) |
| Retail Trade | 877 (56.4%) | 678 (43.6%) |
| Transportation & Warehousing | 207 (58.3%) | 148 (41.7%) |
| Utilities | 55 (100.0%) | 0 (0.0%) |
| Information | 39 (48.7%) | 41 (51.2%) |
| Finance & Insurance | 110 (15.9%) | 582 (84.1%) |
| Real Estate, Rental & Leasing | 91 (38.9%) | 143 (61.1%) |
| Professional & Scientific | 130 (45.8%) | 154 (54.2%) |
| Enterprise Management | 20 (100.0%) | 0 (0.0%) |
| Administrative & Support | 375 (62.8%) | 222 (37.2%) |
| Educational Services | 89 (10.6%) | 749 (89.4%) |
| Health Care & Social Assistance | 218 (23.5%) | 709 (76.5%) |
| Arts, Entertainment & Recreation | 158 (66.4%) | 80 (33.6%) |
| Accommodation & Food Services | 513 (51.8%) | 477 (48.2%) |
| Public Administration | 345 (61.2%) | 219 (38.8%) |
| Total | 5,422 (52.7%) | 4,865 (47.3%) |
Education in Edgewater
School Enrollment in Edgewater
The most common levels of schooling among the 3,362 students in Edgewater are high school (837 | 24.9%), middle school (799 | 23.8%), and college / undergraduate (620 | 18.4%).
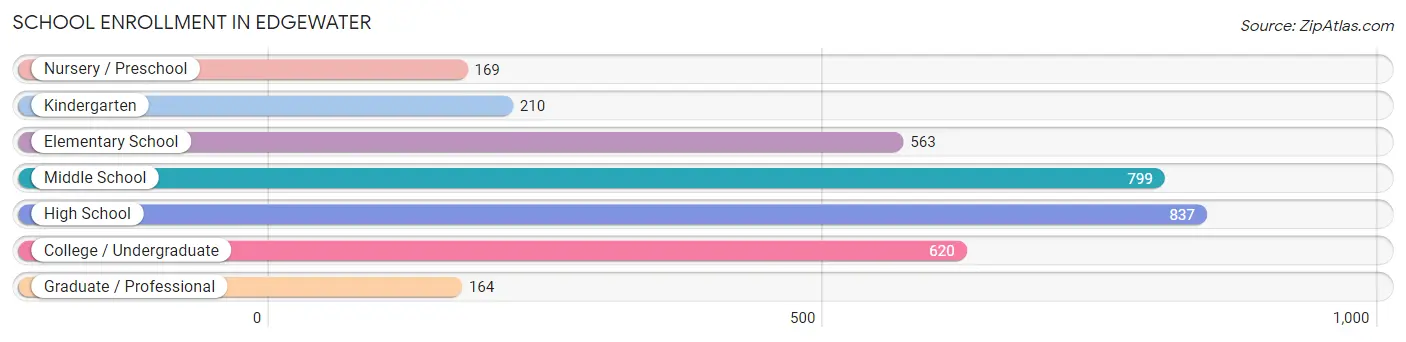
| School Level | # Students | % Students |
| Nursery / Preschool | 169 | 5.0% |
| Kindergarten | 210 | 6.2% |
| Elementary School | 563 | 16.8% |
| Middle School | 799 | 23.8% |
| High School | 837 | 24.9% |
| College / Undergraduate | 620 | 18.4% |
| Graduate / Professional | 164 | 4.9% |
| Total | 3,362 | 100.0% |
School Enrollment by Age by Funding Source in Edgewater
Out of a total of 3,362 students who are enrolled in schools in Edgewater, 501 (14.9%) attend a private institution, while the remaining 2,861 (85.1%) are enrolled in public schools. The age group of 35 years and over has the highest likelihood of being enrolled in private schools, with 156 (54.4% in the age bracket) enrolled. Conversely, the age group of 15 to 17 year olds has the lowest likelihood of being enrolled in a private school, with 506 (100.0% in the age bracket) attending a public institution.
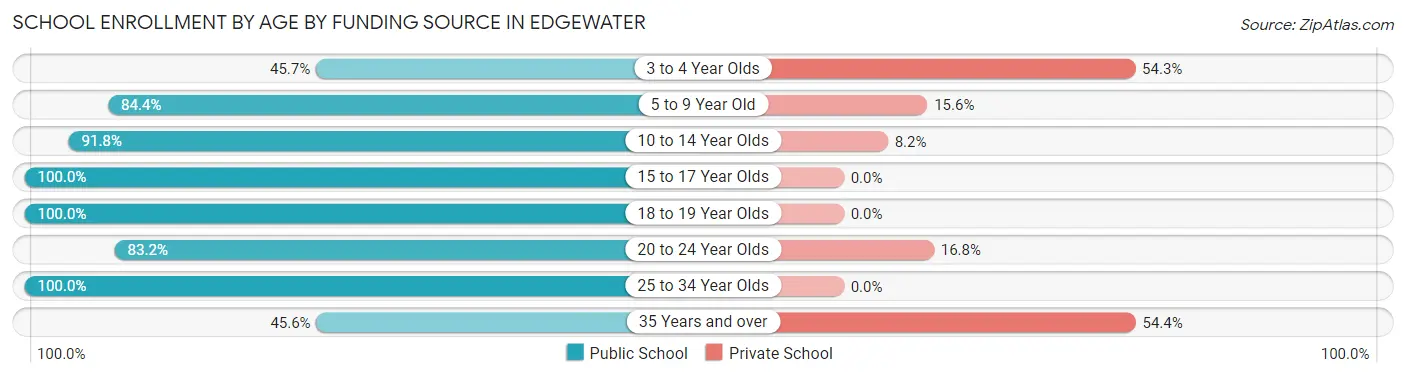
| Age Bracket | Public School | Private School |
| 3 to 4 Year Olds | 64 (45.7%) | 76 (54.3%) |
| 5 to 9 Year Old | 608 (84.4%) | 112 (15.6%) |
| 10 to 14 Year Olds | 907 (91.8%) | 81 (8.2%) |
| 15 to 17 Year Olds | 506 (100.0%) | 0 (0.0%) |
| 18 to 19 Year Olds | 157 (100.0%) | 0 (0.0%) |
| 20 to 24 Year Olds | 382 (83.2%) | 77 (16.8%) |
| 25 to 34 Year Olds | 105 (100.0%) | 0 (0.0%) |
| 35 Years and over | 131 (45.6%) | 156 (54.4%) |
| Total | 2,861 (85.1%) | 501 (14.9%) |
Educational Attainment by Field of Study in Edgewater
Education (1,022 | 24.5%), business (778 | 18.6%), science & technology (348 | 8.3%), social sciences (323 | 7.7%), and arts & humanities (296 | 7.1%) are the most common fields of study among 4,171 individuals in Edgewater who have obtained a bachelor's degree or higher.
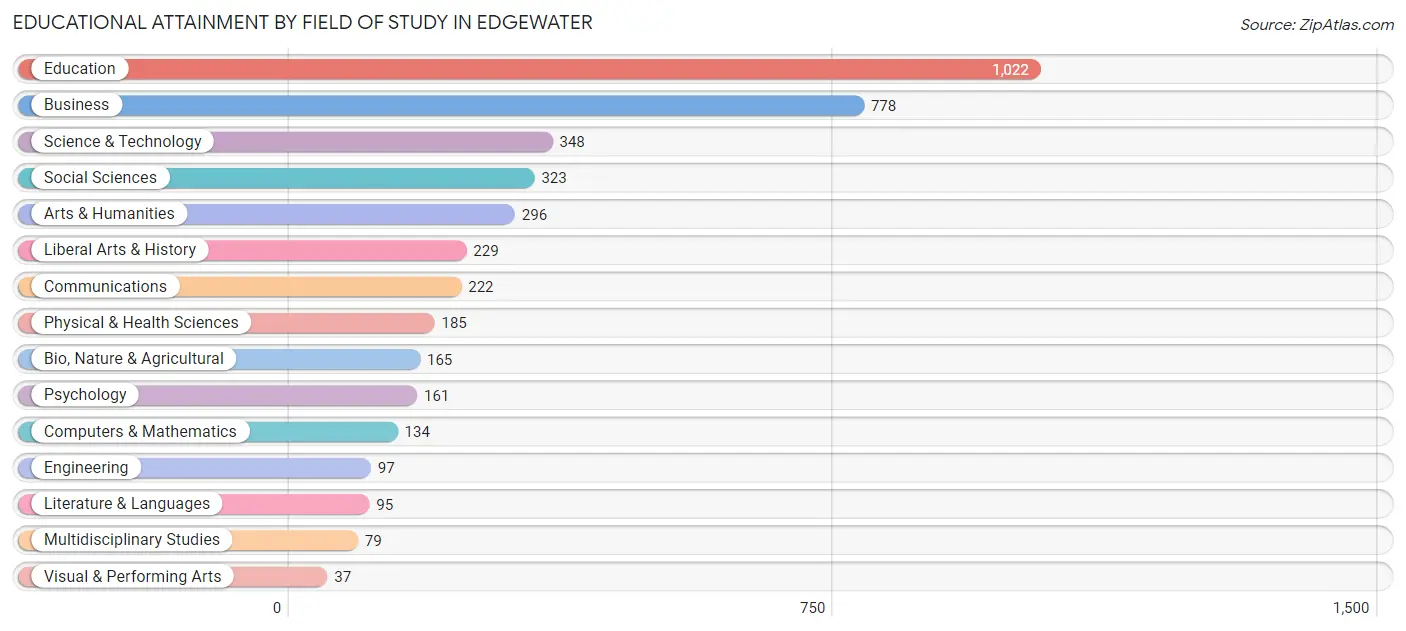
| Field of Study | # Graduates | % Graduates |
| Computers & Mathematics | 134 | 3.2% |
| Bio, Nature & Agricultural | 165 | 4.0% |
| Physical & Health Sciences | 185 | 4.4% |
| Psychology | 161 | 3.9% |
| Social Sciences | 323 | 7.7% |
| Engineering | 97 | 2.3% |
| Multidisciplinary Studies | 79 | 1.9% |
| Science & Technology | 348 | 8.3% |
| Business | 778 | 18.6% |
| Education | 1,022 | 24.5% |
| Literature & Languages | 95 | 2.3% |
| Liberal Arts & History | 229 | 5.5% |
| Visual & Performing Arts | 37 | 0.9% |
| Communications | 222 | 5.3% |
| Arts & Humanities | 296 | 7.1% |
| Total | 4,171 | 100.0% |
Transportation & Commute in Edgewater
Vehicle Availability by Sex in Edgewater
The most prevalent vehicle ownership categories in Edgewater are males with 2 vehicles (2,482, accounting for 48.2%) and females with 2 vehicles (1,978, making up 53.2%).
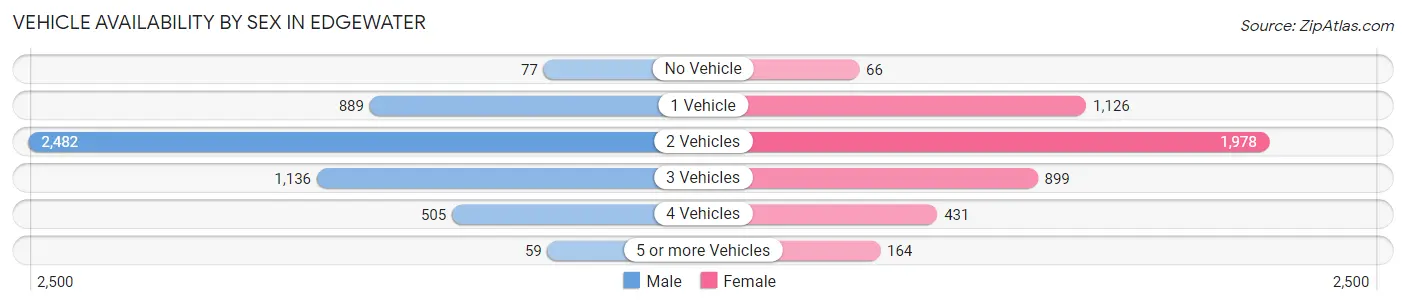
| Vehicles Available | Male | Female |
| No Vehicle | 77 (1.5%) | 66 (1.4%) |
| 1 Vehicle | 889 (17.3%) | 1,126 (24.1%) |
| 2 Vehicles | 2,482 (48.2%) | 1,978 (42.4%) |
| 3 Vehicles | 1,136 (22.1%) | 899 (19.3%) |
| 4 Vehicles | 505 (9.8%) | 431 (9.2%) |
| 5 or more Vehicles | 59 (1.1%) | 164 (3.5%) |
| Total | 5,148 (100.0%) | 4,664 (100.0%) |
Commute Time in Edgewater
The most frequently occuring commute durations in Edgewater are 15 to 19 minutes (1,469 commuters, 16.5%), 30 to 34 minutes (1,464 commuters, 16.5%), and 10 to 14 minutes (1,249 commuters, 14.0%).
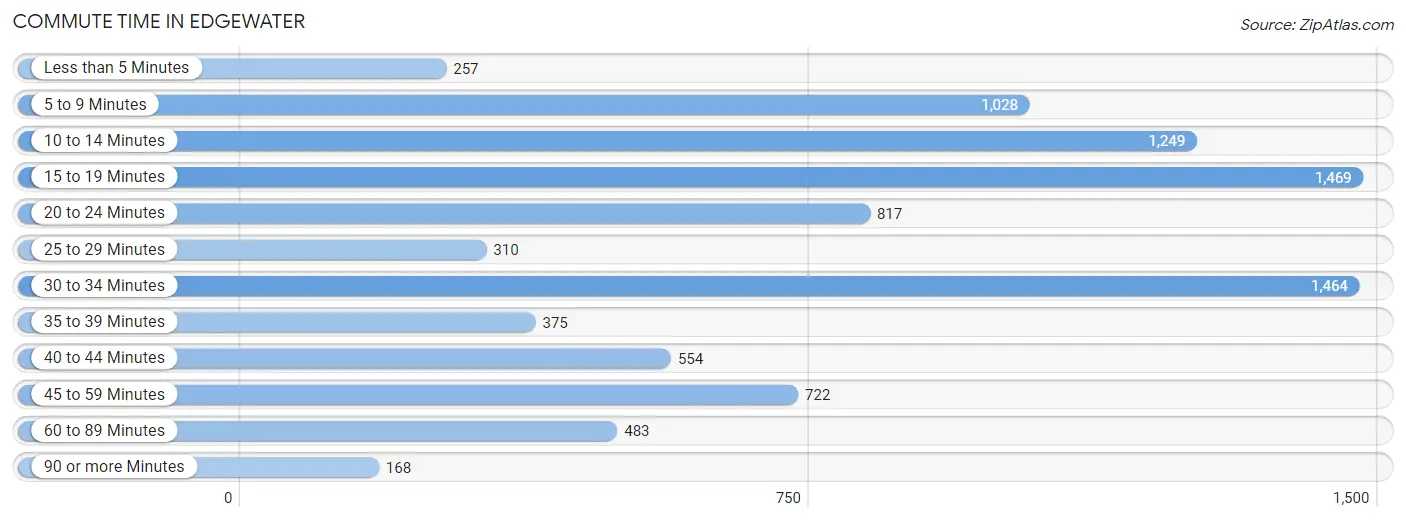
| Commute Time | # Commuters | % Commuters |
| Less than 5 Minutes | 257 | 2.9% |
| 5 to 9 Minutes | 1,028 | 11.6% |
| 10 to 14 Minutes | 1,249 | 14.0% |
| 15 to 19 Minutes | 1,469 | 16.5% |
| 20 to 24 Minutes | 817 | 9.2% |
| 25 to 29 Minutes | 310 | 3.5% |
| 30 to 34 Minutes | 1,464 | 16.5% |
| 35 to 39 Minutes | 375 | 4.2% |
| 40 to 44 Minutes | 554 | 6.2% |
| 45 to 59 Minutes | 722 | 8.1% |
| 60 to 89 Minutes | 483 | 5.4% |
| 90 or more Minutes | 168 | 1.9% |
Commute Time by Sex in Edgewater
The most common commute times in Edgewater are 30 to 34 minutes (894 commuters, 18.6%) for males and 10 to 14 minutes (679 commuters, 16.7%) for females.
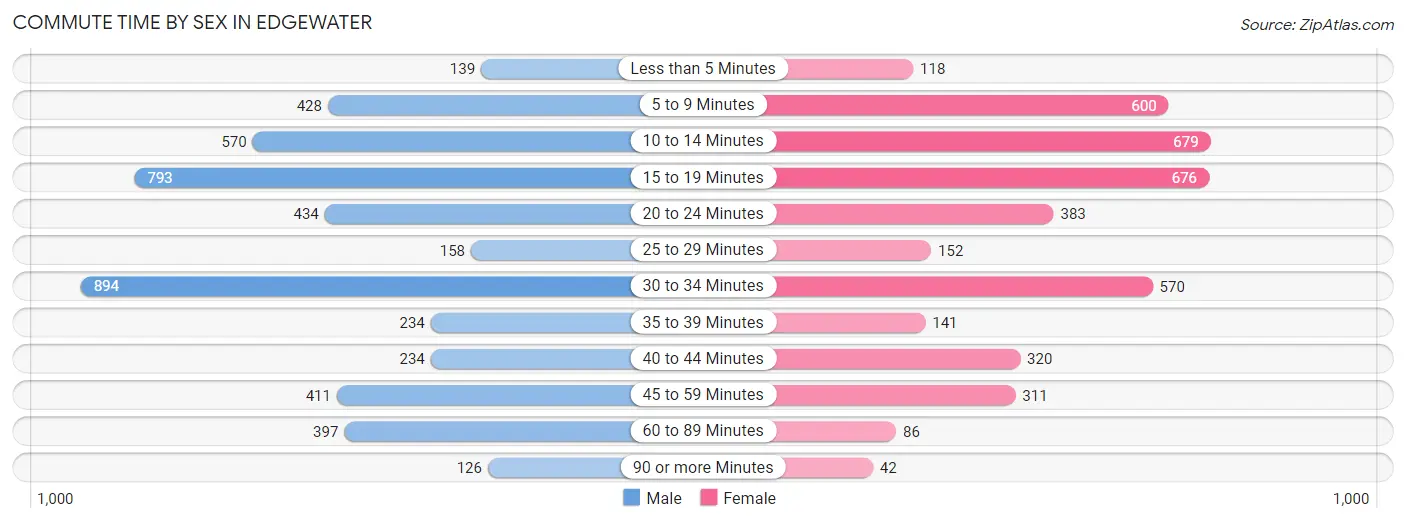
| Commute Time | Male | Female |
| Less than 5 Minutes | 139 (2.9%) | 118 (2.9%) |
| 5 to 9 Minutes | 428 (8.9%) | 600 (14.7%) |
| 10 to 14 Minutes | 570 (11.8%) | 679 (16.7%) |
| 15 to 19 Minutes | 793 (16.5%) | 676 (16.6%) |
| 20 to 24 Minutes | 434 (9.0%) | 383 (9.4%) |
| 25 to 29 Minutes | 158 (3.3%) | 152 (3.7%) |
| 30 to 34 Minutes | 894 (18.6%) | 570 (14.0%) |
| 35 to 39 Minutes | 234 (4.9%) | 141 (3.5%) |
| 40 to 44 Minutes | 234 (4.9%) | 320 (7.9%) |
| 45 to 59 Minutes | 411 (8.5%) | 311 (7.6%) |
| 60 to 89 Minutes | 397 (8.2%) | 86 (2.1%) |
| 90 or more Minutes | 126 (2.6%) | 42 (1.0%) |
Time of Departure to Work by Sex in Edgewater
The most frequent times of departure to work in Edgewater are 9:00 AM to 9:59 AM (612, 12.7%) for males and 7:00 AM to 7:29 AM (859, 21.1%) for females.
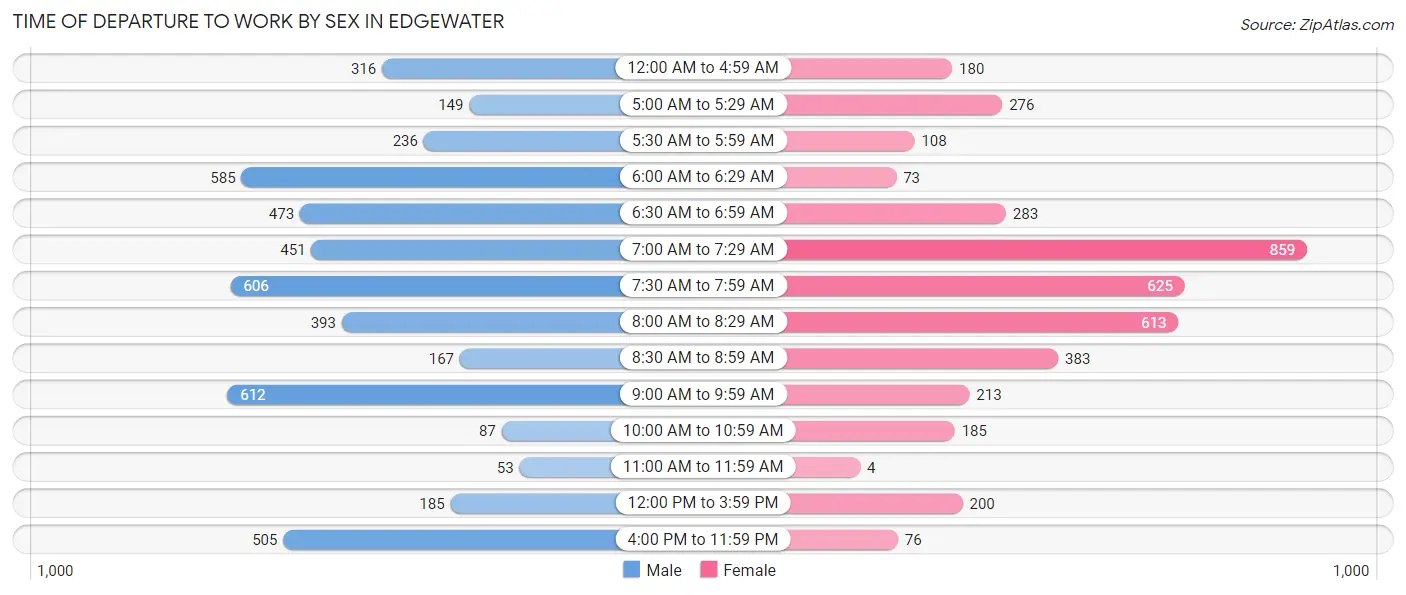
| Time of Departure | Male | Female |
| 12:00 AM to 4:59 AM | 316 (6.6%) | 180 (4.4%) |
| 5:00 AM to 5:29 AM | 149 (3.1%) | 276 (6.8%) |
| 5:30 AM to 5:59 AM | 236 (4.9%) | 108 (2.6%) |
| 6:00 AM to 6:29 AM | 585 (12.1%) | 73 (1.8%) |
| 6:30 AM to 6:59 AM | 473 (9.8%) | 283 (6.9%) |
| 7:00 AM to 7:29 AM | 451 (9.4%) | 859 (21.1%) |
| 7:30 AM to 7:59 AM | 606 (12.6%) | 625 (15.3%) |
| 8:00 AM to 8:29 AM | 393 (8.2%) | 613 (15.0%) |
| 8:30 AM to 8:59 AM | 167 (3.5%) | 383 (9.4%) |
| 9:00 AM to 9:59 AM | 612 (12.7%) | 213 (5.2%) |
| 10:00 AM to 10:59 AM | 87 (1.8%) | 185 (4.5%) |
| 11:00 AM to 11:59 AM | 53 (1.1%) | 4 (0.1%) |
| 12:00 PM to 3:59 PM | 185 (3.8%) | 200 (4.9%) |
| 4:00 PM to 11:59 PM | 505 (10.5%) | 76 (1.9%) |
| Total | 4,818 (100.0%) | 4,078 (100.0%) |
Housing Occupancy in Edgewater
Occupancy by Ownership in Edgewater
Of the total 10,620 dwellings in Edgewater, owner-occupied units account for 9,330 (87.8%), while renter-occupied units make up 1,290 (12.1%).
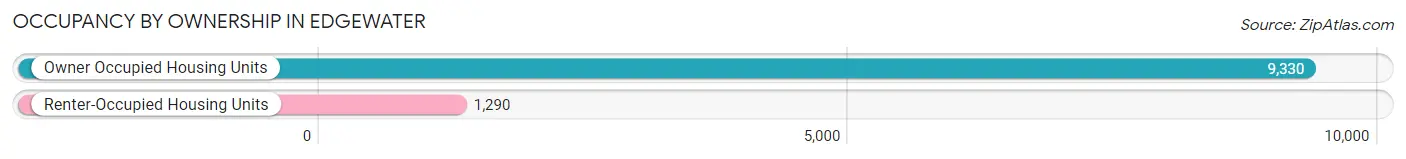
| Occupancy | # Housing Units | % Housing Units |
| Owner Occupied Housing Units | 9,330 | 87.8% |
| Renter-Occupied Housing Units | 1,290 | 12.1% |
| Total Occupied Housing Units | 10,620 | 100.0% |
Occupancy by Household Size in Edgewater
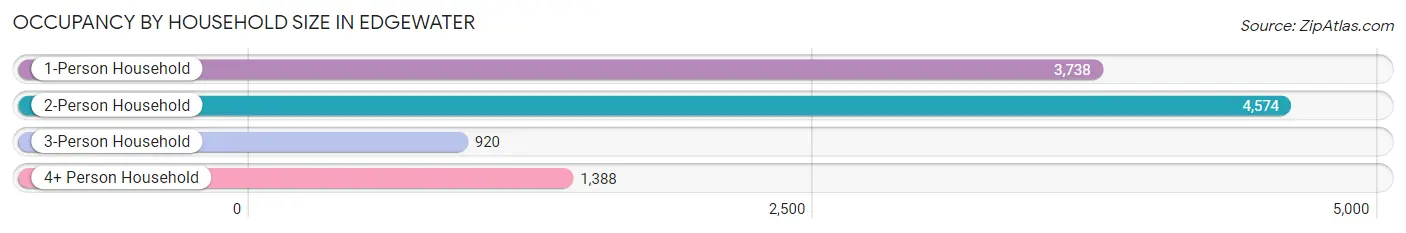
| Household Size | # Housing Units | % Housing Units |
| 1-Person Household | 3,738 | 35.2% |
| 2-Person Household | 4,574 | 43.1% |
| 3-Person Household | 920 | 8.7% |
| 4+ Person Household | 1,388 | 13.1% |
| Total Housing Units | 10,620 | 100.0% |
Occupancy by Ownership by Household Size in Edgewater
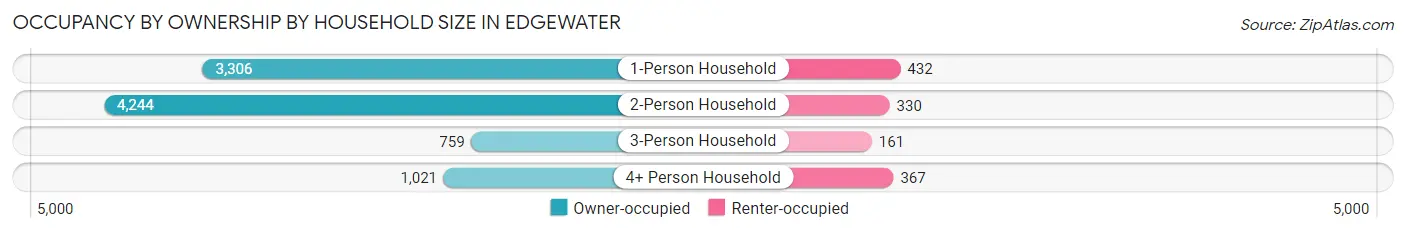
| Household Size | Owner-occupied | Renter-occupied |
| 1-Person Household | 3,306 (88.4%) | 432 (11.6%) |
| 2-Person Household | 4,244 (92.8%) | 330 (7.2%) |
| 3-Person Household | 759 (82.5%) | 161 (17.5%) |
| 4+ Person Household | 1,021 (73.6%) | 367 (26.4%) |
| Total Housing Units | 9,330 (87.8%) | 1,290 (12.1%) |
Occupancy by Educational Attainment in Edgewater
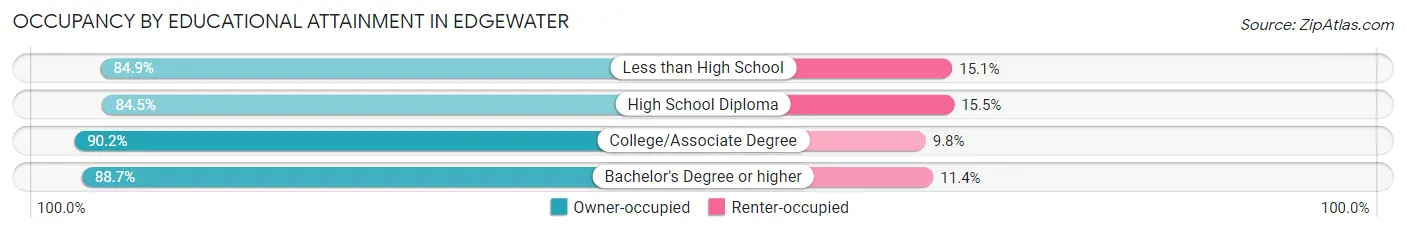
| Household Size | Owner-occupied | Renter-occupied |
| Less than High School | 591 (84.9%) | 105 (15.1%) |
| High School Diploma | 2,524 (84.5%) | 462 (15.5%) |
| College/Associate Degree | 3,848 (90.2%) | 420 (9.8%) |
| Bachelor's Degree or higher | 2,367 (88.6%) | 303 (11.4%) |
Occupancy by Age of Householder in Edgewater
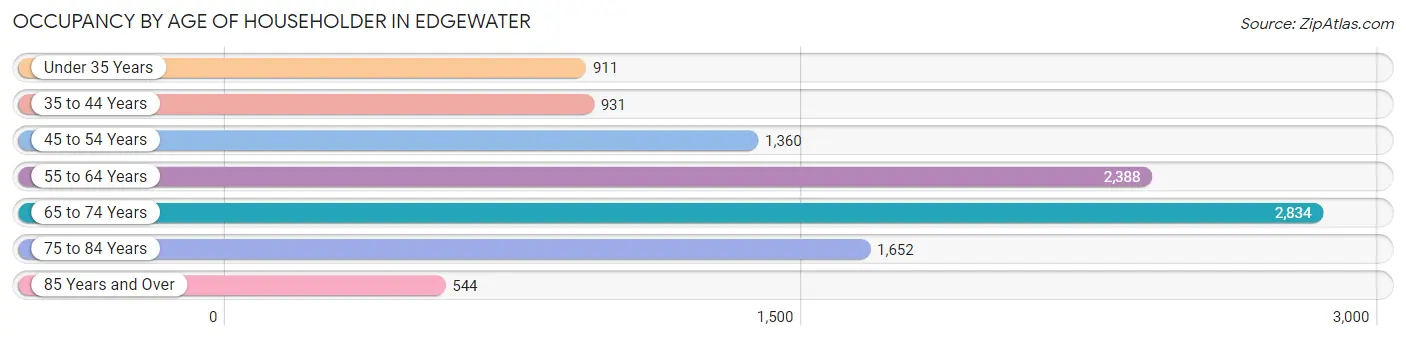
| Age Bracket | # Households | % Households |
| Under 35 Years | 911 | 8.6% |
| 35 to 44 Years | 931 | 8.8% |
| 45 to 54 Years | 1,360 | 12.8% |
| 55 to 64 Years | 2,388 | 22.5% |
| 65 to 74 Years | 2,834 | 26.7% |
| 75 to 84 Years | 1,652 | 15.6% |
| 85 Years and Over | 544 | 5.1% |
| Total | 10,620 | 100.0% |
Housing Finances in Edgewater
Median Income by Occupancy in Edgewater
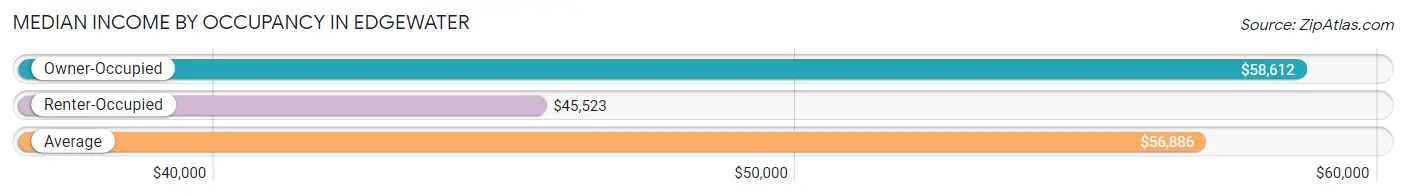
| Occupancy Type | # Households | Median Income |
| Owner-Occupied | 9,330 (87.8%) | $58,612 |
| Renter-Occupied | 1,290 (12.1%) | $45,523 |
| Average | 10,620 (100.0%) | $56,886 |
Occupancy by Householder Income Bracket in Edgewater
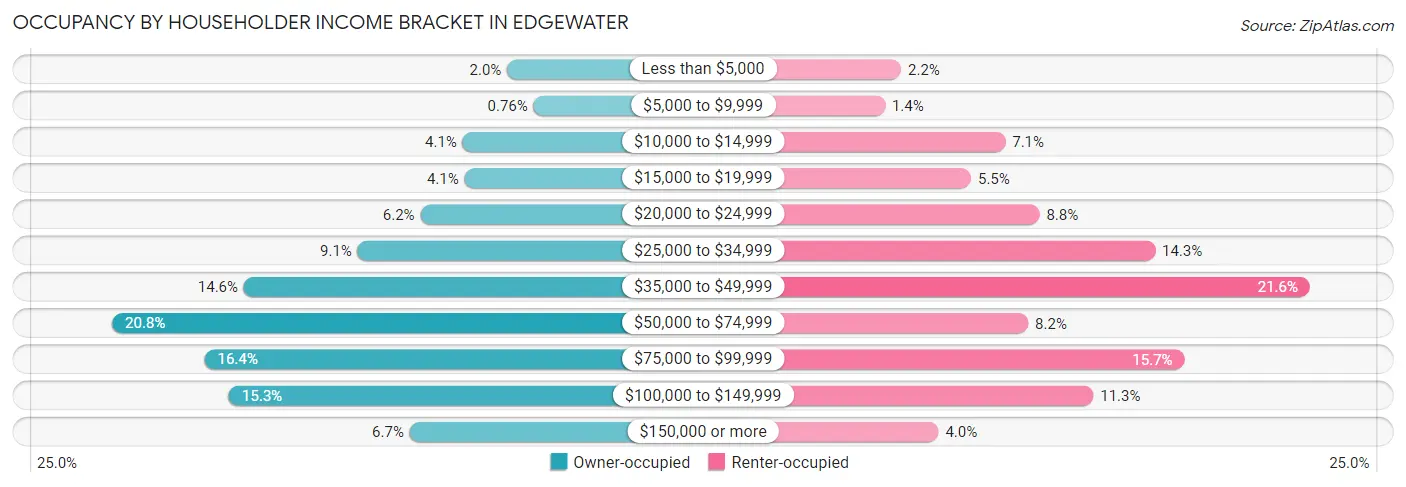
| Income Bracket | Owner-occupied | Renter-occupied |
| Less than $5,000 | 188 (2.0%) | 28 (2.2%) |
| $5,000 to $9,999 | 71 (0.8%) | 18 (1.4%) |
| $10,000 to $14,999 | 386 (4.1%) | 92 (7.1%) |
| $15,000 to $19,999 | 378 (4.1%) | 71 (5.5%) |
| $20,000 to $24,999 | 574 (6.1%) | 113 (8.8%) |
| $25,000 to $34,999 | 853 (9.1%) | 184 (14.3%) |
| $35,000 to $49,999 | 1,358 (14.6%) | 279 (21.6%) |
| $50,000 to $74,999 | 1,943 (20.8%) | 106 (8.2%) |
| $75,000 to $99,999 | 1,533 (16.4%) | 202 (15.7%) |
| $100,000 to $149,999 | 1,425 (15.3%) | 146 (11.3%) |
| $150,000 or more | 621 (6.7%) | 51 (4.0%) |
| Total | 9,330 (100.0%) | 1,290 (100.0%) |
Monthly Housing Cost Tiers in Edgewater
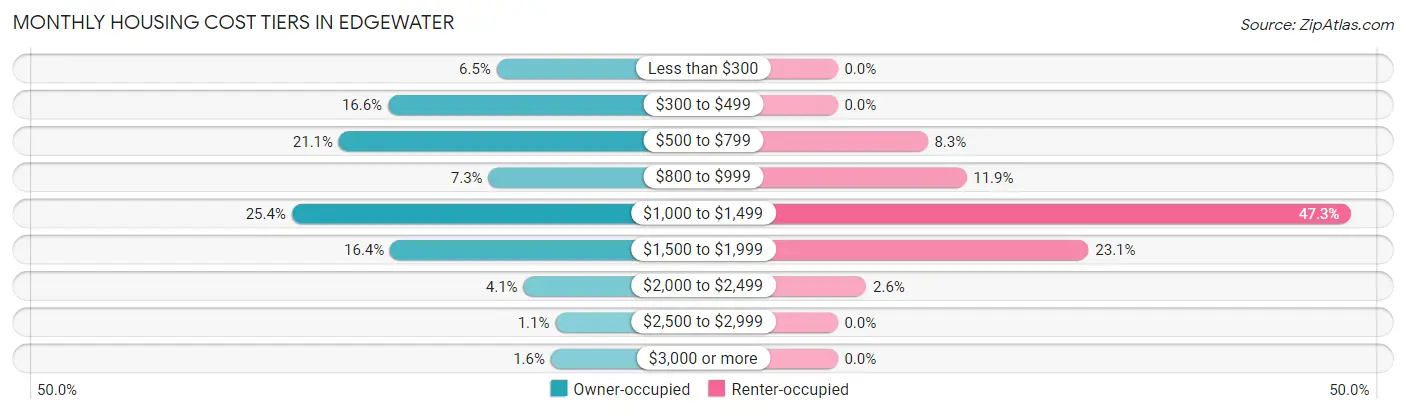
| Monthly Cost | Owner-occupied | Renter-occupied |
| Less than $300 | 610 (6.5%) | 0 (0.0%) |
| $300 to $499 | 1,544 (16.6%) | 0 (0.0%) |
| $500 to $799 | 1,966 (21.1%) | 107 (8.3%) |
| $800 to $999 | 681 (7.3%) | 153 (11.9%) |
| $1,000 to $1,499 | 2,371 (25.4%) | 610 (47.3%) |
| $1,500 to $1,999 | 1,525 (16.4%) | 298 (23.1%) |
| $2,000 to $2,499 | 381 (4.1%) | 34 (2.6%) |
| $2,500 to $2,999 | 106 (1.1%) | 0 (0.0%) |
| $3,000 or more | 146 (1.6%) | 0 (0.0%) |
| Total | 9,330 (100.0%) | 1,290 (100.0%) |
Physical Housing Characteristics in Edgewater
Housing Structures in Edgewater
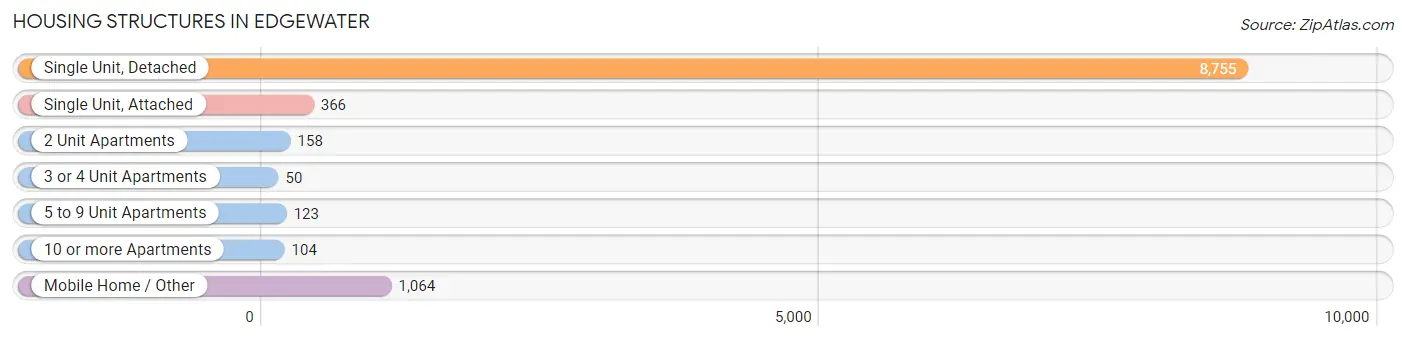
| Structure Type | # Housing Units | % Housing Units |
| Single Unit, Detached | 8,755 | 82.4% |
| Single Unit, Attached | 366 | 3.5% |
| 2 Unit Apartments | 158 | 1.5% |
| 3 or 4 Unit Apartments | 50 | 0.5% |
| 5 to 9 Unit Apartments | 123 | 1.2% |
| 10 or more Apartments | 104 | 1.0% |
| Mobile Home / Other | 1,064 | 10.0% |
| Total | 10,620 | 100.0% |
Housing Structures by Occupancy in Edgewater
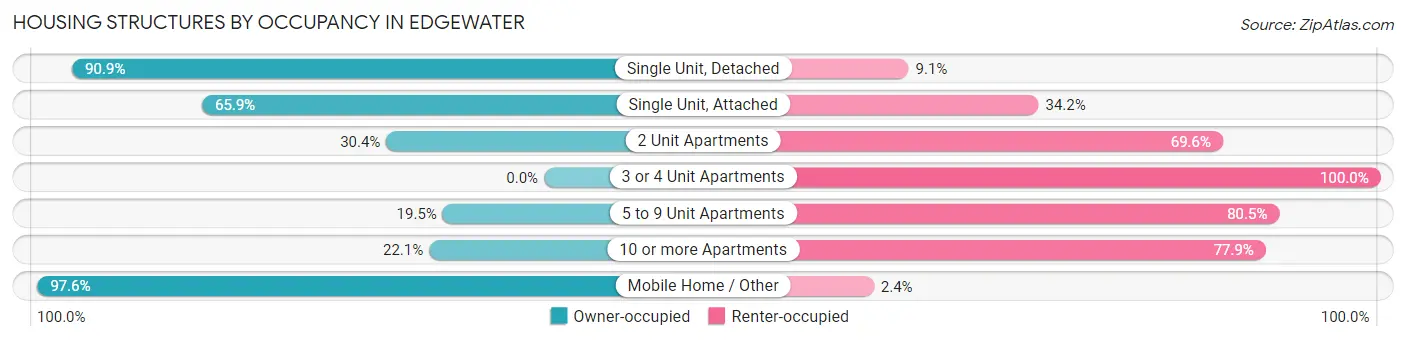
| Structure Type | Owner-occupied | Renter-occupied |
| Single Unit, Detached | 7,956 (90.9%) | 799 (9.1%) |
| Single Unit, Attached | 241 (65.8%) | 125 (34.2%) |
| 2 Unit Apartments | 48 (30.4%) | 110 (69.6%) |
| 3 or 4 Unit Apartments | 0 (0.0%) | 50 (100.0%) |
| 5 to 9 Unit Apartments | 24 (19.5%) | 99 (80.5%) |
| 10 or more Apartments | 23 (22.1%) | 81 (77.9%) |
| Mobile Home / Other | 1,038 (97.6%) | 26 (2.4%) |
| Total | 9,330 (87.8%) | 1,290 (12.1%) |
Housing Structures by Number of Rooms in Edgewater
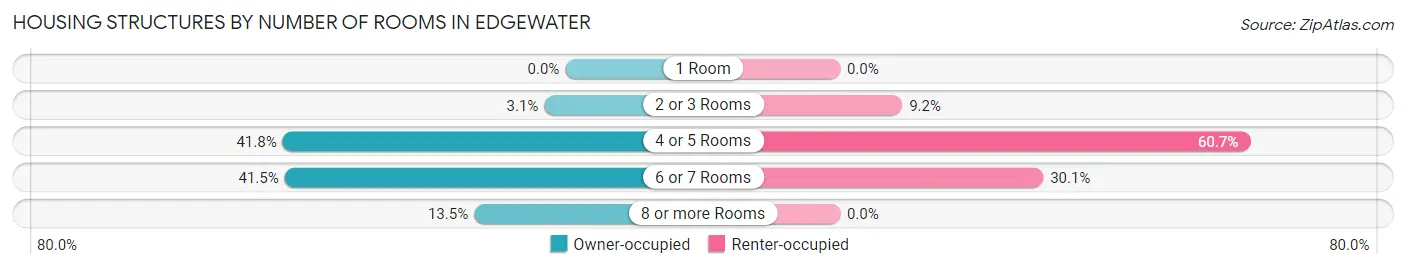
| Number of Rooms | Owner-occupied | Renter-occupied |
| 1 Room | 0 (0.0%) | 0 (0.0%) |
| 2 or 3 Rooms | 290 (3.1%) | 119 (9.2%) |
| 4 or 5 Rooms | 3,904 (41.8%) | 783 (60.7%) |
| 6 or 7 Rooms | 3,876 (41.5%) | 388 (30.1%) |
| 8 or more Rooms | 1,260 (13.5%) | 0 (0.0%) |
| Total | 9,330 (100.0%) | 1,290 (100.0%) |
Housing Structure by Heating Type in Edgewater
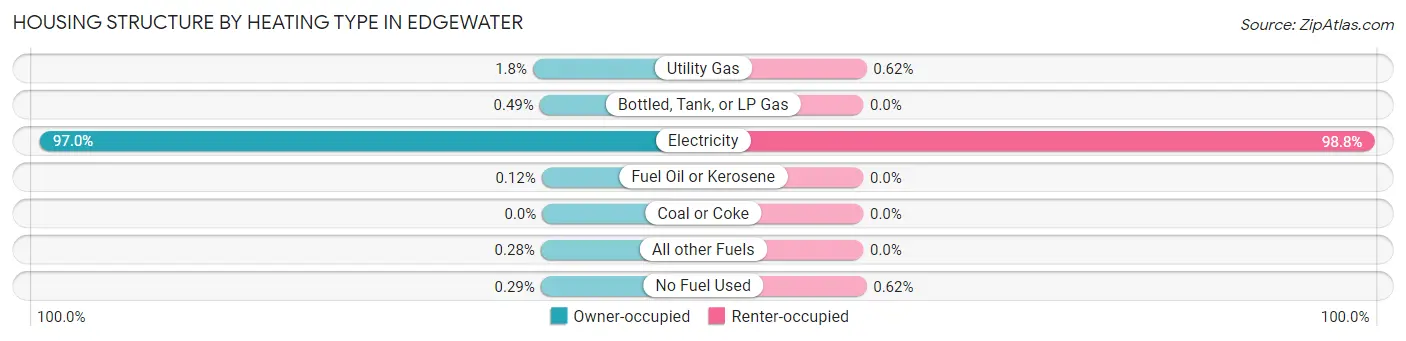
| Heating Type | Owner-occupied | Renter-occupied |
| Utility Gas | 167 (1.8%) | 8 (0.6%) |
| Bottled, Tank, or LP Gas | 46 (0.5%) | 0 (0.0%) |
| Electricity | 9,053 (97.0%) | 1,274 (98.8%) |
| Fuel Oil or Kerosene | 11 (0.1%) | 0 (0.0%) |
| Coal or Coke | 0 (0.0%) | 0 (0.0%) |
| All other Fuels | 26 (0.3%) | 0 (0.0%) |
| No Fuel Used | 27 (0.3%) | 8 (0.6%) |
| Total | 9,330 (100.0%) | 1,290 (100.0%) |
Household Vehicle Usage in Edgewater
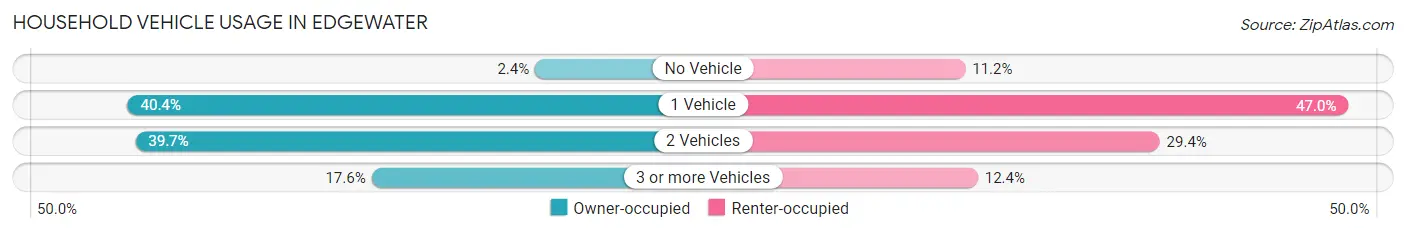
| Vehicles per Household | Owner-occupied | Renter-occupied |
| No Vehicle | 219 (2.4%) | 145 (11.2%) |
| 1 Vehicle | 3,767 (40.4%) | 606 (47.0%) |
| 2 Vehicles | 3,700 (39.7%) | 379 (29.4%) |
| 3 or more Vehicles | 1,644 (17.6%) | 160 (12.4%) |
| Total | 9,330 (100.0%) | 1,290 (100.0%) |
Real Estate & Mortgages in Edgewater
Real Estate and Mortgage Overview in Edgewater
| Characteristic | Without Mortgage | With Mortgage |
| Housing Units | 4,329 | 5,001 |
| Median Property Value | $207,500 | $225,600 |
| Median Household Income | $43,853 | $411 |
| Monthly Housing Costs | $510 | $137 |
| Real Estate Taxes | $1,074 | $105 |
Property Value by Mortgage Status in Edgewater
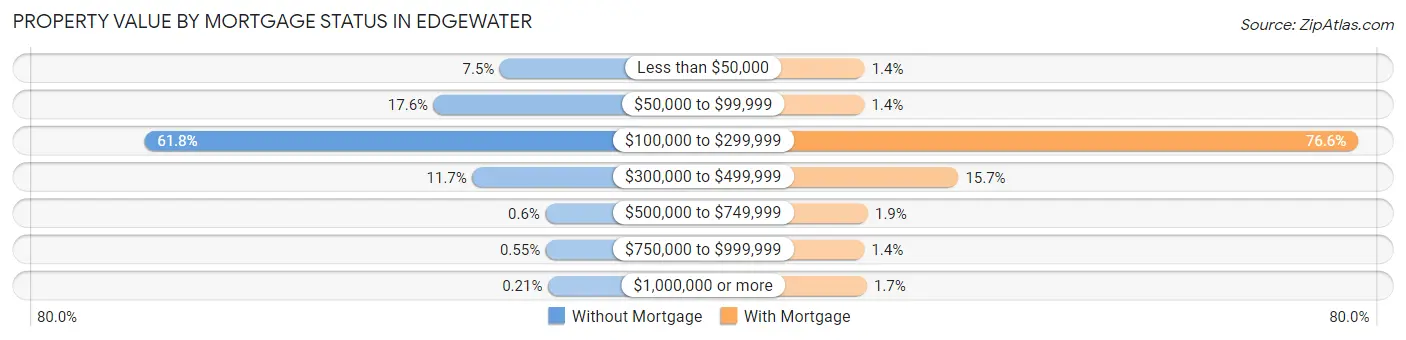
| Property Value | Without Mortgage | With Mortgage |
| Less than $50,000 | 326 (7.5%) | 70 (1.4%) |
| $50,000 to $99,999 | 763 (17.6%) | 68 (1.4%) |
| $100,000 to $299,999 | 2,673 (61.8%) | 3,829 (76.6%) |
| $300,000 to $499,999 | 508 (11.7%) | 784 (15.7%) |
| $500,000 to $749,999 | 26 (0.6%) | 95 (1.9%) |
| $750,000 to $999,999 | 24 (0.5%) | 68 (1.4%) |
| $1,000,000 or more | 9 (0.2%) | 87 (1.7%) |
| Total | 4,329 (100.0%) | 5,001 (100.0%) |
Household Income by Mortgage Status in Edgewater
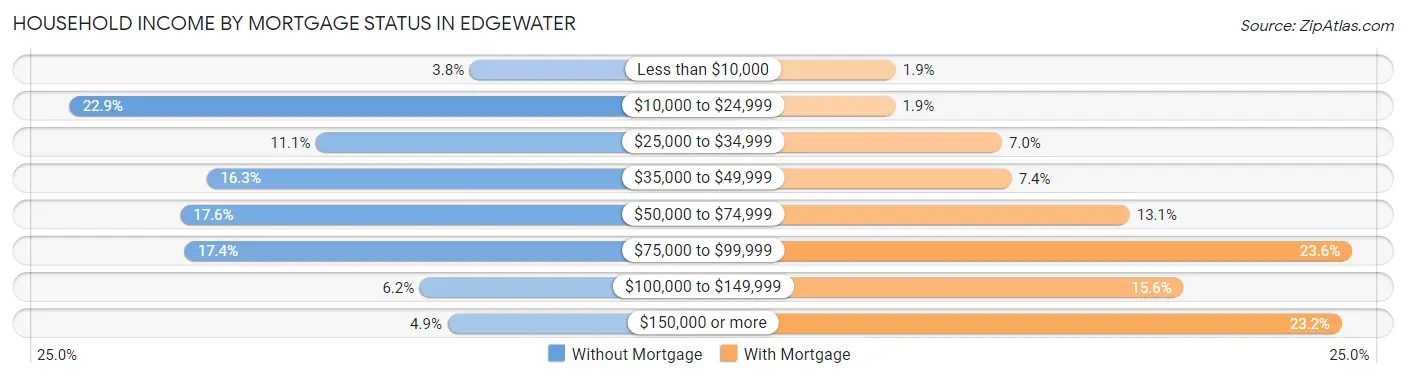
| Household Income | Without Mortgage | With Mortgage |
| Less than $10,000 | 164 (3.8%) | 96 (1.9%) |
| $10,000 to $24,999 | 989 (22.9%) | 95 (1.9%) |
| $25,000 to $34,999 | 481 (11.1%) | 349 (7.0%) |
| $35,000 to $49,999 | 705 (16.3%) | 372 (7.4%) |
| $50,000 to $74,999 | 761 (17.6%) | 653 (13.1%) |
| $75,000 to $99,999 | 752 (17.4%) | 1,182 (23.6%) |
| $100,000 to $149,999 | 267 (6.2%) | 781 (15.6%) |
| $150,000 or more | 210 (4.9%) | 1,158 (23.2%) |
| Total | 4,329 (100.0%) | 5,001 (100.0%) |
Property Value to Household Income Ratio in Edgewater
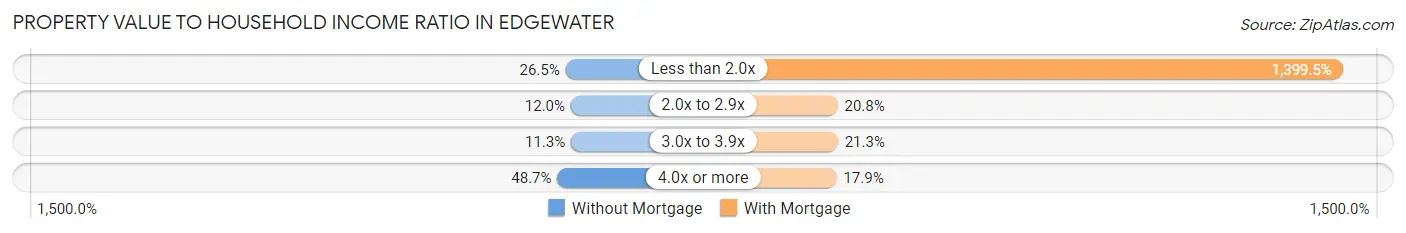
| Value-to-Income Ratio | Without Mortgage | With Mortgage |
| Less than 2.0x | 1,145 (26.5%) | 69,990 (1,399.5%) |
| 2.0x to 2.9x | 518 (12.0%) | 1,042 (20.8%) |
| 3.0x to 3.9x | 490 (11.3%) | 1,063 (21.3%) |
| 4.0x or more | 2,106 (48.6%) | 893 (17.9%) |
| Total | 4,329 (100.0%) | 5,001 (100.0%) |
Real Estate Taxes by Mortgage Status in Edgewater
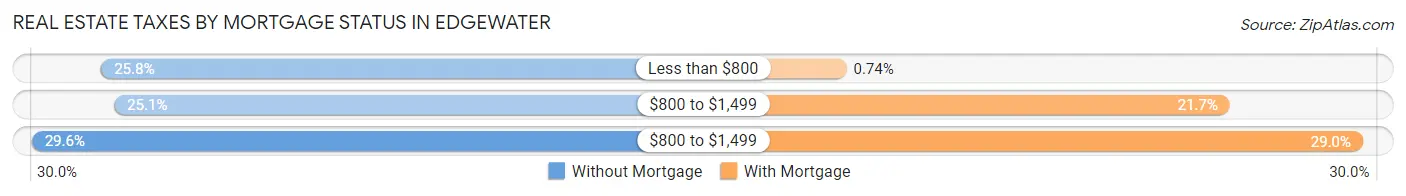
| Property Taxes | Without Mortgage | With Mortgage |
| Less than $800 | 1,117 (25.8%) | 37 (0.7%) |
| $800 to $1,499 | 1,086 (25.1%) | 1,087 (21.7%) |
| $800 to $1,499 | 1,282 (29.6%) | 1,452 (29.0%) |
| Total | 4,329 (100.0%) | 5,001 (100.0%) |
Health & Disability in Edgewater
Health Insurance Coverage by Age in Edgewater
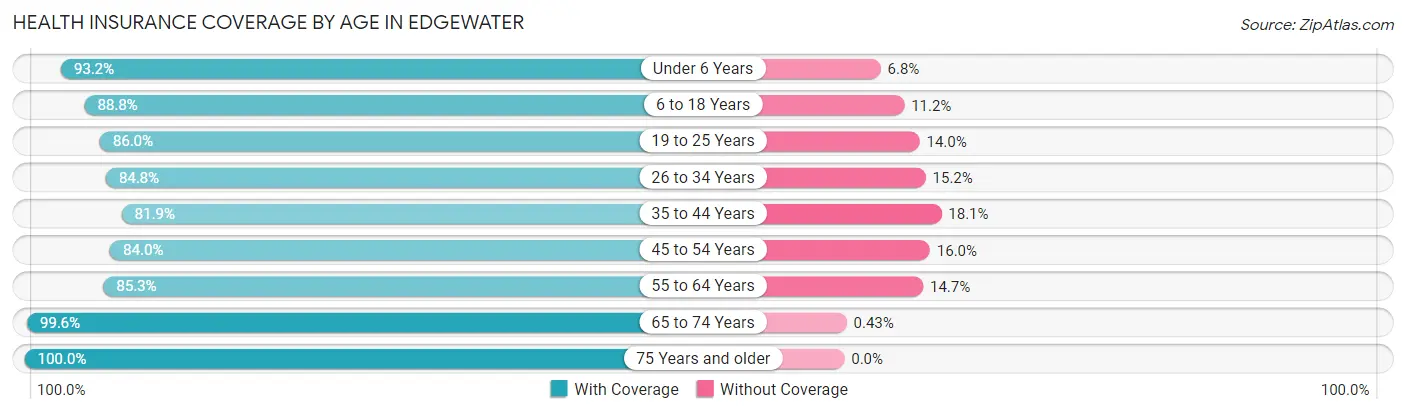
| Age Bracket | With Coverage | Without Coverage |
| Under 6 Years | 1,061 (93.2%) | 77 (6.8%) |
| 6 to 18 Years | 2,091 (88.8%) | 263 (11.2%) |
| 19 to 25 Years | 1,120 (86.0%) | 183 (14.0%) |
| 26 to 34 Years | 1,976 (84.8%) | 353 (15.2%) |
| 35 to 44 Years | 1,661 (81.9%) | 367 (18.1%) |
| 45 to 54 Years | 2,101 (84.0%) | 399 (16.0%) |
| 55 to 64 Years | 3,408 (85.3%) | 587 (14.7%) |
| 65 to 74 Years | 4,208 (99.6%) | 18 (0.4%) |
| 75 Years and older | 3,253 (100.0%) | 0 (0.0%) |
| Total | 20,879 (90.3%) | 2,247 (9.7%) |
Health Insurance Coverage by Citizenship Status in Edgewater
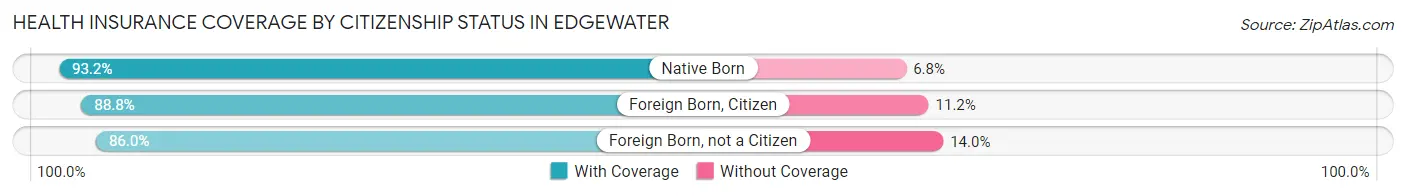
| Citizenship Status | With Coverage | Without Coverage |
| Native Born | 1,061 (93.2%) | 77 (6.8%) |
| Foreign Born, Citizen | 2,091 (88.8%) | 263 (11.2%) |
| Foreign Born, not a Citizen | 1,120 (86.0%) | 183 (14.0%) |
Health Insurance Coverage by Household Income in Edgewater
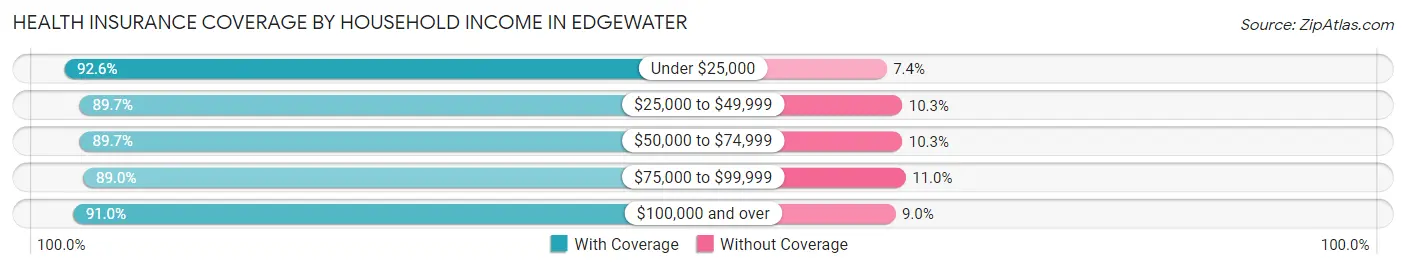
| Household Income | With Coverage | Without Coverage |
| Under $25,000 | 2,342 (92.6%) | 187 (7.4%) |
| $25,000 to $49,999 | 4,433 (89.7%) | 509 (10.3%) |
| $50,000 to $74,999 | 4,263 (89.7%) | 490 (10.3%) |
| $75,000 to $99,999 | 3,454 (89.0%) | 425 (11.0%) |
| $100,000 and over | 6,380 (91.0%) | 633 (9.0%) |
Public vs Private Health Insurance Coverage by Age in Edgewater
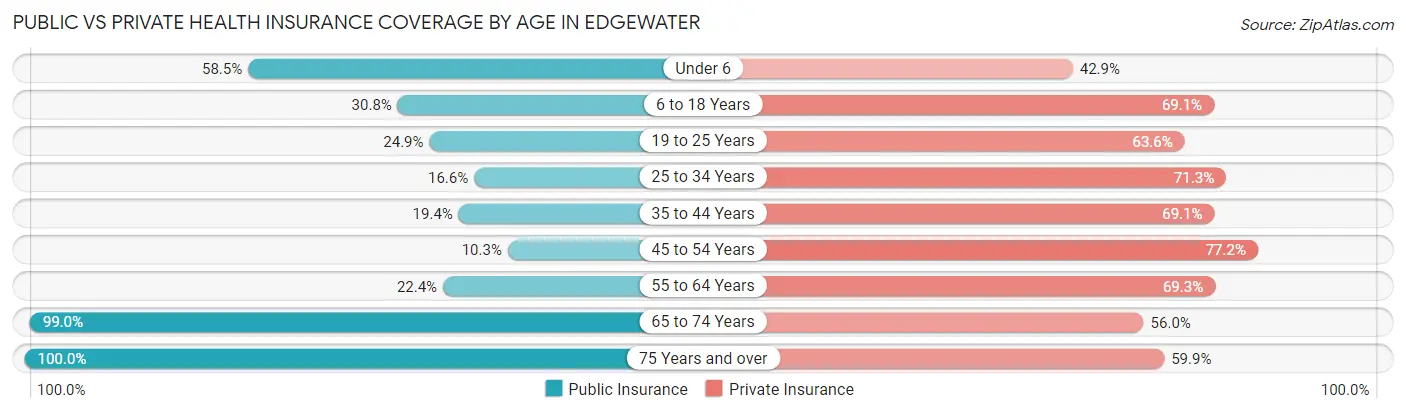
| Age Bracket | Public Insurance | Private Insurance |
| Under 6 | 666 (58.5%) | 488 (42.9%) |
| 6 to 18 Years | 724 (30.8%) | 1,626 (69.1%) |
| 19 to 25 Years | 324 (24.9%) | 829 (63.6%) |
| 25 to 34 Years | 386 (16.6%) | 1,661 (71.3%) |
| 35 to 44 Years | 394 (19.4%) | 1,402 (69.1%) |
| 45 to 54 Years | 258 (10.3%) | 1,930 (77.2%) |
| 55 to 64 Years | 893 (22.4%) | 2,767 (69.3%) |
| 65 to 74 Years | 4,185 (99.0%) | 2,368 (56.0%) |
| 75 Years and over | 3,253 (100.0%) | 1,947 (59.9%) |
| Total | 11,083 (47.9%) | 15,018 (64.9%) |
Disability Status by Sex by Age in Edgewater
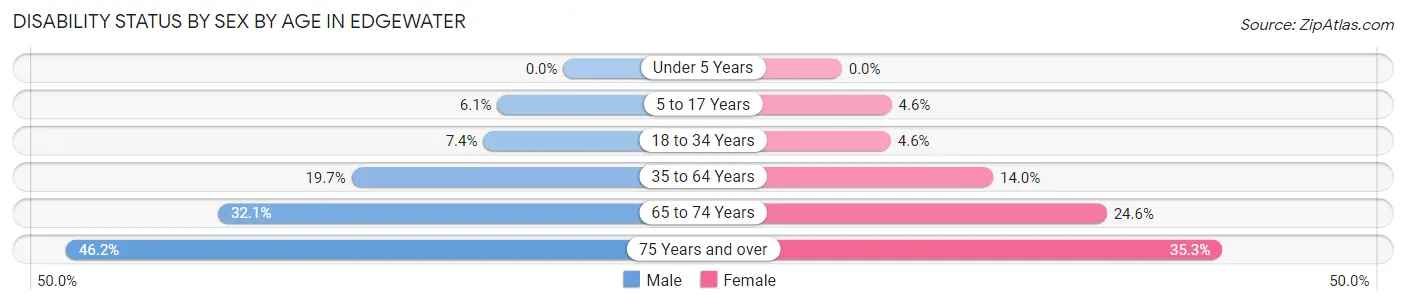
| Age Bracket | Male | Female |
| Under 5 Years | 0 (0.0%) | 0 (0.0%) |
| 5 to 17 Years | 57 (6.1%) | 66 (4.6%) |
| 18 to 34 Years | 145 (7.4%) | 85 (4.5%) |
| 35 to 64 Years | 855 (19.7%) | 586 (14.0%) |
| 65 to 74 Years | 592 (32.1%) | 585 (24.6%) |
| 75 Years and over | 607 (46.2%) | 684 (35.3%) |
Disability Class by Sex by Age in Edgewater
Disability Class: Hearing Difficulty
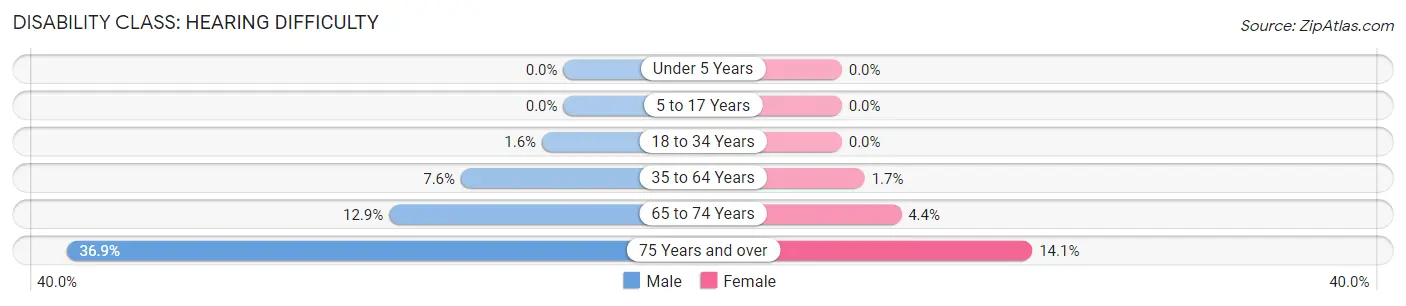
| Age Bracket | Male | Female |
| Under 5 Years | 0 (0.0%) | 0 (0.0%) |
| 5 to 17 Years | 0 (0.0%) | 0 (0.0%) |
| 18 to 34 Years | 31 (1.6%) | 0 (0.0%) |
| 35 to 64 Years | 331 (7.6%) | 71 (1.7%) |
| 65 to 74 Years | 239 (12.9%) | 105 (4.4%) |
| 75 Years and over | 485 (36.9%) | 274 (14.1%) |
Disability Class: Vision Difficulty
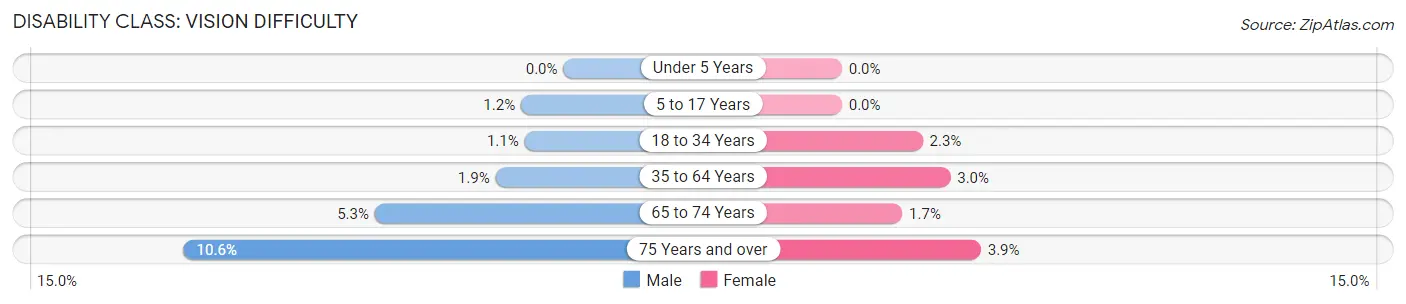
| Age Bracket | Male | Female |
| Under 5 Years | 0 (0.0%) | 0 (0.0%) |
| 5 to 17 Years | 11 (1.2%) | 0 (0.0%) |
| 18 to 34 Years | 21 (1.1%) | 42 (2.2%) |
| 35 to 64 Years | 82 (1.9%) | 126 (3.0%) |
| 65 to 74 Years | 97 (5.2%) | 40 (1.7%) |
| 75 Years and over | 139 (10.6%) | 75 (3.9%) |
Disability Class: Cognitive Difficulty
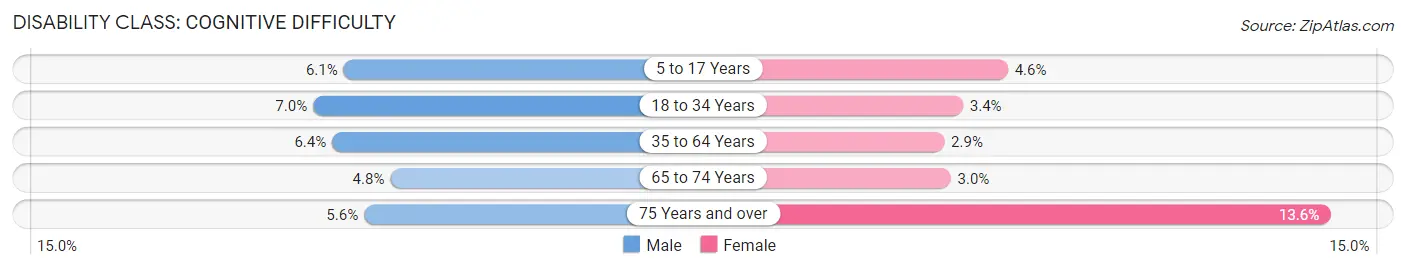
| Age Bracket | Male | Female |
| 5 to 17 Years | 57 (6.1%) | 66 (4.6%) |
| 18 to 34 Years | 136 (7.0%) | 63 (3.4%) |
| 35 to 64 Years | 280 (6.4%) | 119 (2.9%) |
| 65 to 74 Years | 89 (4.8%) | 72 (3.0%) |
| 75 Years and over | 73 (5.6%) | 264 (13.6%) |
Disability Class: Ambulatory Difficulty
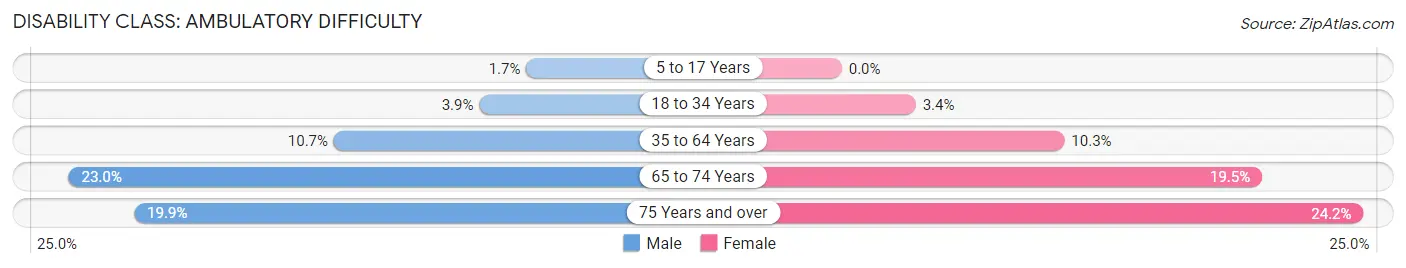
| Age Bracket | Male | Female |
| 5 to 17 Years | 16 (1.7%) | 0 (0.0%) |
| 18 to 34 Years | 76 (3.9%) | 64 (3.4%) |
| 35 to 64 Years | 463 (10.6%) | 431 (10.3%) |
| 65 to 74 Years | 424 (23.0%) | 464 (19.5%) |
| 75 Years and over | 262 (19.9%) | 469 (24.2%) |
Disability Class: Self-Care Difficulty
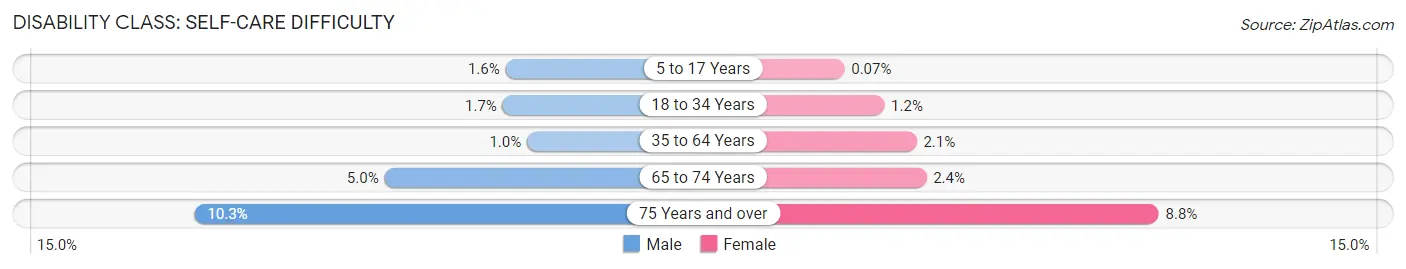
| Age Bracket | Male | Female |
| 5 to 17 Years | 15 (1.6%) | 1 (0.1%) |
| 18 to 34 Years | 33 (1.7%) | 22 (1.2%) |
| 35 to 64 Years | 44 (1.0%) | 87 (2.1%) |
| 65 to 74 Years | 92 (5.0%) | 56 (2.4%) |
| 75 Years and over | 135 (10.3%) | 171 (8.8%) |
Technology Access in Edgewater
Computing Device Access in Edgewater
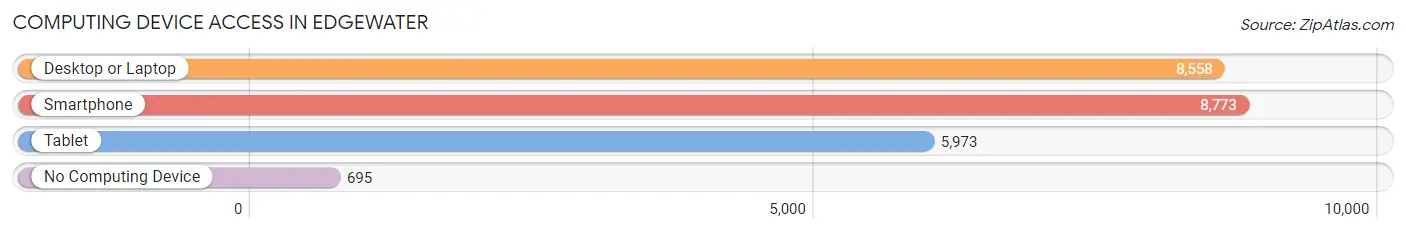
| Device Type | # Households | % Households |
| Desktop or Laptop | 8,558 | 80.6% |
| Smartphone | 8,773 | 82.6% |
| Tablet | 5,973 | 56.2% |
| No Computing Device | 695 | 6.5% |
| Total | 10,620 | 100.0% |
Internet Access in Edgewater
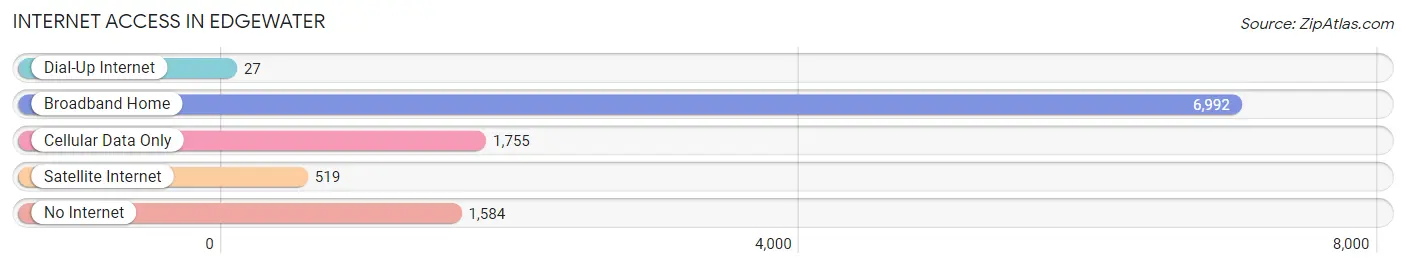
| Internet Type | # Households | % Households |
| Dial-Up Internet | 27 | 0.3% |
| Broadband Home | 6,992 | 65.8% |
| Cellular Data Only | 1,755 | 16.5% |
| Satellite Internet | 519 | 4.9% |
| No Internet | 1,584 | 14.9% |
| Total | 10,620 | 100.0% |
Edgewater Summary
Edgewater is a city located in Volusia County, Florida, United States. It is situated along the Indian River, just south of Daytona Beach and north of New Smyrna Beach. The population was 20,750 at the 2010 census.
History
The area that is now Edgewater was originally inhabited by the Timucuan Indians. The first European settlers arrived in the area in the late 1700s. The area was known as Indian River City until the late 1800s when it was renamed Edgewater. The name was chosen because of the city’s location on the banks of the Indian River.
In the early 1900s, Edgewater was a small fishing village. The city was incorporated in 1925 and began to grow rapidly. The city was home to a number of businesses, including a cannery, a fish house, and a boat building business.
In the 1950s, Edgewater began to experience a population boom. The city was home to a number of new businesses, including a shopping center, a movie theater, and a bowling alley. The city also began to attract tourists, who came to enjoy the city’s beaches and fishing.
In the late 1970s, Edgewater experienced a decline in population. The city’s economy was hurt by the closure of the cannery and the fish house. The city also experienced a decrease in tourism due to the opening of nearby theme parks.
In the 1990s, Edgewater began to experience a resurgence. The city was home to a number of new businesses, including a marina, a golf course, and a number of restaurants. The city also began to attract new residents, who were drawn to the city’s proximity to the beach and its small-town charm.
Geography
Edgewater is located in Volusia County, Florida, along the Indian River. The city is situated between Daytona Beach and New Smyrna Beach. The city covers an area of 8.3 square miles and has a population of 20,750.
The city is located in a humid subtropical climate zone. The average temperature in the summer is around 90 degrees Fahrenheit, while the average temperature in the winter is around 60 degrees Fahrenheit. The city receives an average of 50 inches of rain per year.
Economy
Edgewater’s economy is largely based on tourism and service industries. The city is home to a number of hotels, restaurants, and retail stores. The city is also home to a number of marinas, which attract tourists and locals alike.
The city is also home to a number of manufacturing and industrial businesses. The city is home to a number of aerospace and defense companies, as well as a number of boat and marine-related businesses.
Demographics
As of the 2010 census, the population of Edgewater was 20,750. The population is made up of a diverse mix of people, including African Americans, Hispanics, and Caucasians. The median household income in the city is $41,945. The median age in the city is 43.7 years.
Common Questions
What is Per Capita Income in Edgewater?
Per Capita income in Edgewater is $34,836.
What is the Median Family Income in Edgewater?
Median Family Income in Edgewater is $73,214.
What is the Median Household income in Edgewater?
Median Household Income in Edgewater is $56,886.
What is Income or Wage Gap in Edgewater?
Income or Wage Gap in Edgewater is 10.6%.
Women in Edgewater earn 89.4 cents for every dollar earned by a man.
What is Inequality or Gini Index in Edgewater?
Inequality or Gini Index in Edgewater is 0.42.
What is the Total Population of Edgewater?
Total Population of Edgewater is 23,138.
What is the Total Male Population of Edgewater?
Total Male Population of Edgewater is 10,965.
What is the Total Female Population of Edgewater?
Total Female Population of Edgewater is 12,173.
What is the Ratio of Males per 100 Females in Edgewater?
There are 90.08 Males per 100 Females in Edgewater.
What is the Ratio of Females per 100 Males in Edgewater?
There are 111.02 Females per 100 Males in Edgewater.
What is the Median Population Age in Edgewater?
Median Population Age in Edgewater is 54.7 Years.
What is the Average Family Size in Edgewater
Average Family Size in Edgewater is 2.8 People.
What is the Average Household Size in Edgewater
Average Household Size in Edgewater is 2.2 People.
How Large is the Labor Force in Edgewater?
There are 10,560 People in the Labor Forcein in Edgewater.
What is the Percentage of People in the Labor Force in Edgewater?
52.2% of People are in the Labor Force in Edgewater.
What is the Unemployment Rate in Edgewater?
Unemployment Rate in Edgewater is 2.6%.