Davenport, FL Map & Demographics
Davenport Map
Davenport Overview
$25,066
PER CAPITA INCOME
$69,509
AVG FAMILY INCOME
$64,428
AVG HOUSEHOLD INCOME
34.0%
WAGE / INCOME GAP [ % ]
66.0¢/ $1
WAGE / INCOME GAP [ $ ]
0.38
INEQUALITY / GINI INDEX
10,246
TOTAL POPULATION
5,183
MALE POPULATION
5,063
FEMALE POPULATION
102.37
MALES / 100 FEMALES
97.68
FEMALES / 100 MALES
35.2
MEDIAN AGE
3.9
AVG FAMILY SIZE
3.3
AVG HOUSEHOLD SIZE
5,402
LABOR FORCE [ PEOPLE ]
69.2%
PERCENT IN LABOR FORCE
2.6%
UNEMPLOYMENT RATE
Income in Davenport
Income Overview in Davenport
Per Capita Income in Davenport is $25,066, while median incomes of families and households are $69,509 and $64,428 respectively.
| Characteristic | Number | Measure |
| Per Capita Income | 10,246 | $25,066 |
| Median Family Income | 2,317 | $69,509 |
| Mean Family Income | 2,317 | $84,409 |
| Median Household Income | 3,059 | $64,428 |
| Mean Household Income | 3,059 | $77,764 |
| Income Deficit | 2,317 | $0 |
| Wage / Income Gap (%) | 10,246 | 33.97% |
| Wage / Income Gap ($) | 10,246 | 66.03¢ per $1 |
| Gini / Inequality Index | 10,246 | 0.38 |
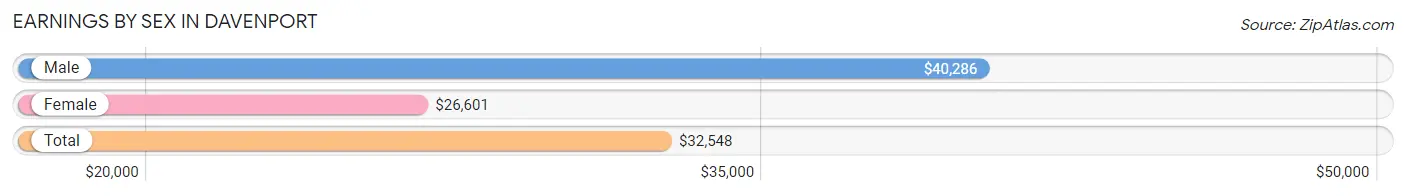
Earnings by Sex in Davenport
Average Earnings in Davenport are $32,548, $40,286 for men and $26,601 for women, a difference of 34.0%.
| Sex | Number | Average Earnings |
| Male | 2,950 (54.7%) | $40,286 |
| Female | 2,444 (45.3%) | $26,601 |
| Total | 5,394 (100.0%) | $32,548 |
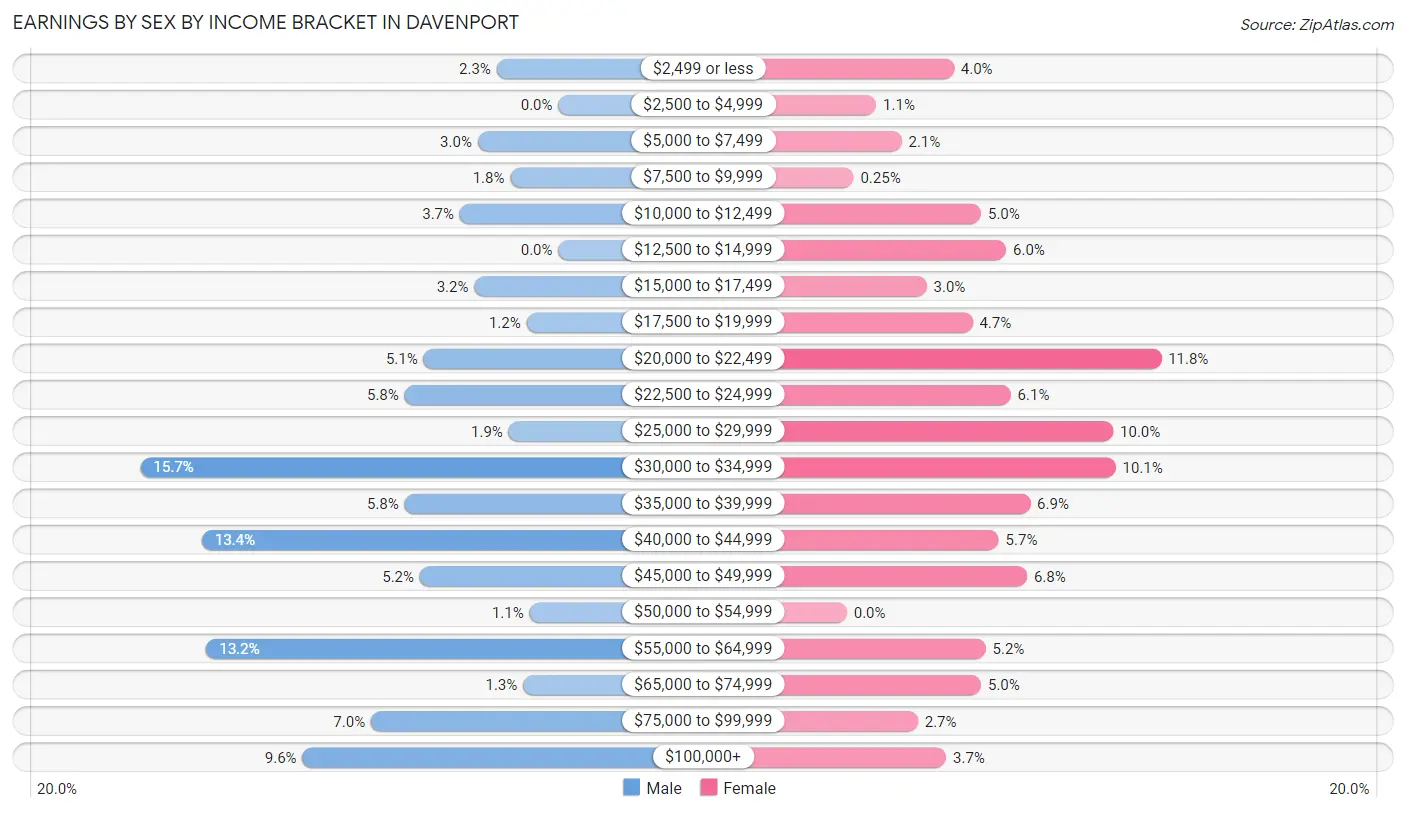
Earnings by Sex by Income Bracket in Davenport
The most common earnings brackets in Davenport are $30,000 to $34,999 for men (462 | 15.7%) and $20,000 to $22,499 for women (288 | 11.8%).
| Income | Male | Female |
| $2,499 or less | 68 (2.3%) | 98 (4.0%) |
| $2,500 to $4,999 | 0 (0.0%) | 27 (1.1%) |
| $5,000 to $7,499 | 89 (3.0%) | 50 (2.1%) |
| $7,500 to $9,999 | 53 (1.8%) | 6 (0.3%) |
| $10,000 to $12,499 | 109 (3.7%) | 123 (5.0%) |
| $12,500 to $14,999 | 0 (0.0%) | 146 (6.0%) |
| $15,000 to $17,499 | 93 (3.2%) | 73 (3.0%) |
| $17,500 to $19,999 | 35 (1.2%) | 115 (4.7%) |
| $20,000 to $22,499 | 149 (5.1%) | 288 (11.8%) |
| $22,500 to $24,999 | 170 (5.8%) | 150 (6.1%) |
| $25,000 to $29,999 | 55 (1.9%) | 244 (10.0%) |
| $30,000 to $34,999 | 462 (15.7%) | 246 (10.1%) |
| $35,000 to $39,999 | 170 (5.8%) | 168 (6.9%) |
| $40,000 to $44,999 | 394 (13.4%) | 139 (5.7%) |
| $45,000 to $49,999 | 153 (5.2%) | 165 (6.8%) |
| $50,000 to $54,999 | 32 (1.1%) | 0 (0.0%) |
| $55,000 to $64,999 | 389 (13.2%) | 127 (5.2%) |
| $65,000 to $74,999 | 39 (1.3%) | 123 (5.0%) |
| $75,000 to $99,999 | 207 (7.0%) | 65 (2.7%) |
| $100,000+ | 283 (9.6%) | 91 (3.7%) |
| Total | 2,950 (100.0%) | 2,444 (100.0%) |
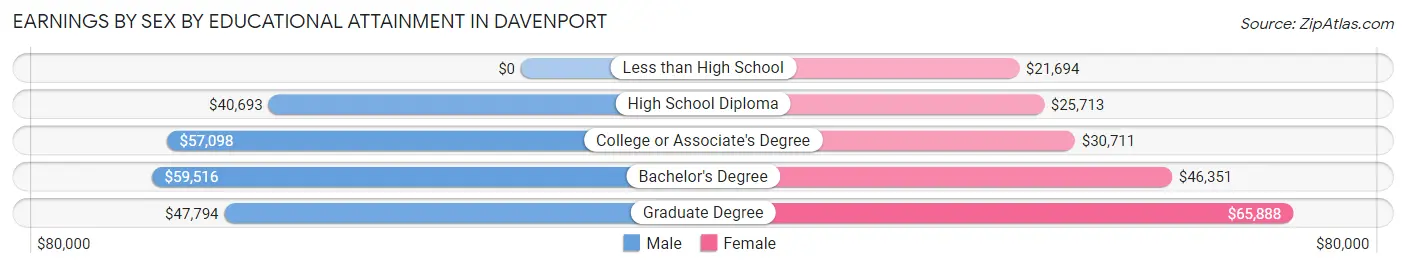
Earnings by Sex by Educational Attainment in Davenport
Average earnings in Davenport are $42,834 for men and $30,768 for women, a difference of 28.2%. Men with an educational attainment of bachelor's degree enjoy the highest average annual earnings of $59,516, while those with high school diploma education earn the least with $40,693. Women with an educational attainment of graduate degree earn the most with the average annual earnings of $65,888, while those with less than high school education have the smallest earnings of $21,694.
| Educational Attainment | Male Income | Female Income |
| Less than High School | - | - |
| High School Diploma | $40,693 | $25,713 |
| College or Associate's Degree | $57,098 | $30,711 |
| Bachelor's Degree | $59,516 | $46,351 |
| Graduate Degree | $47,794 | $65,888 |
| Total | $42,834 | $30,768 |
Family Income in Davenport
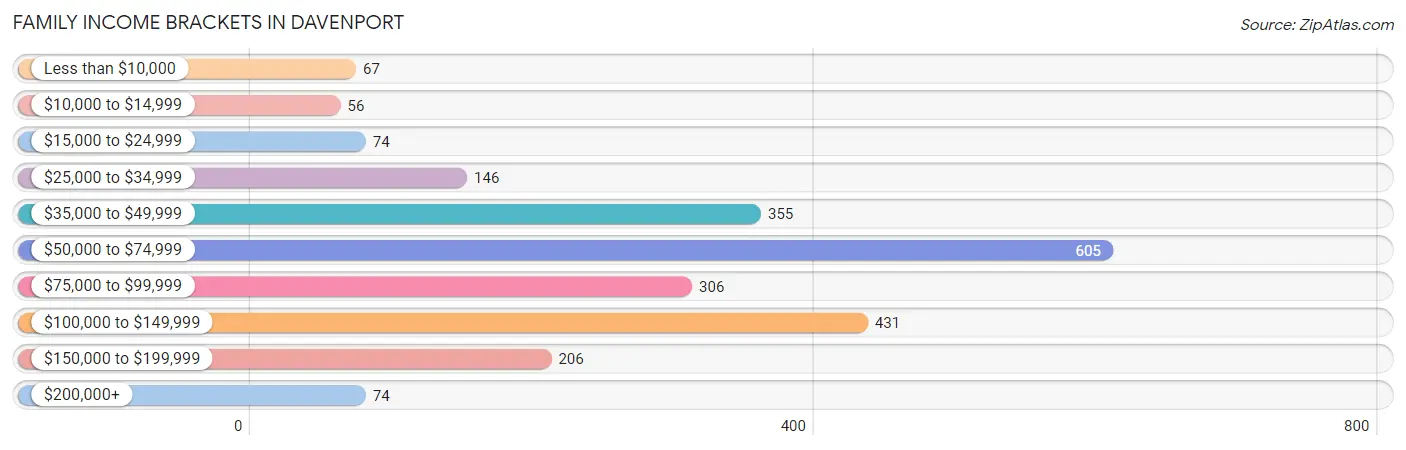
Family Income Brackets in Davenport
According to the Davenport family income data, there are 605 families falling into the $50,000 to $74,999 income range, which is the most common income bracket and makes up 26.1% of all families. Conversely, the $10,000 to $14,999 income bracket is the least frequent group with only 56 families (2.4%) belonging to this category.
| Income Bracket | # Families | % Families |
| Less than $10,000 | 67 | 2.9% |
| $10,000 to $14,999 | 56 | 2.4% |
| $15,000 to $24,999 | 74 | 3.2% |
| $25,000 to $34,999 | 146 | 6.3% |
| $35,000 to $49,999 | 355 | 15.3% |
| $50,000 to $74,999 | 605 | 26.1% |
| $75,000 to $99,999 | 306 | 13.2% |
| $100,000 to $149,999 | 431 | 18.6% |
| $150,000 to $199,999 | 206 | 8.9% |
| $200,000+ | 74 | 3.2% |
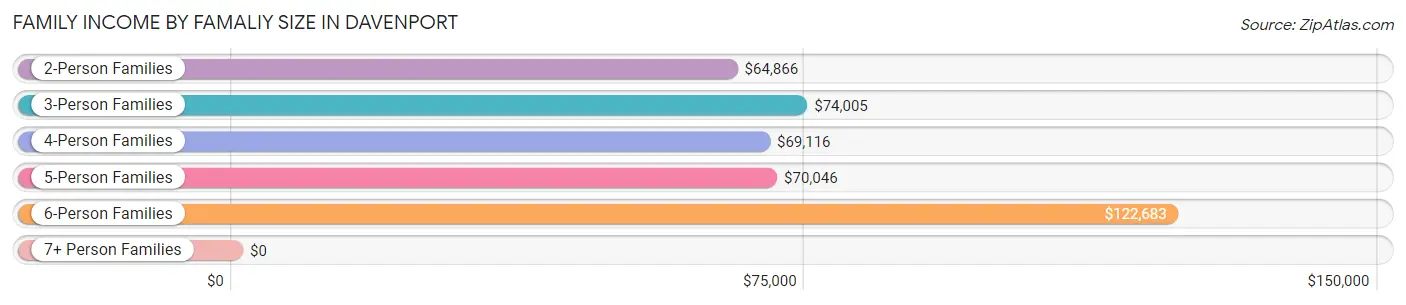
Family Income by Famaliy Size in Davenport
6-person families (165 | 7.1%) account for the highest median family income in Davenport with $122,683 per family, while 2-person families (699 | 30.2%) have the highest median income of $32,433 per family member.
| Income Bracket | # Families | Median Income |
| 2-Person Families | 699 (30.2%) | $64,866 |
| 3-Person Families | 389 (16.8%) | $74,005 |
| 4-Person Families | 518 (22.4%) | $69,116 |
| 5-Person Families | 419 (18.1%) | $70,046 |
| 6-Person Families | 165 (7.1%) | $122,683 |
| 7+ Person Families | 127 (5.5%) | $0 |
| Total | 2,317 (100.0%) | $69,509 |
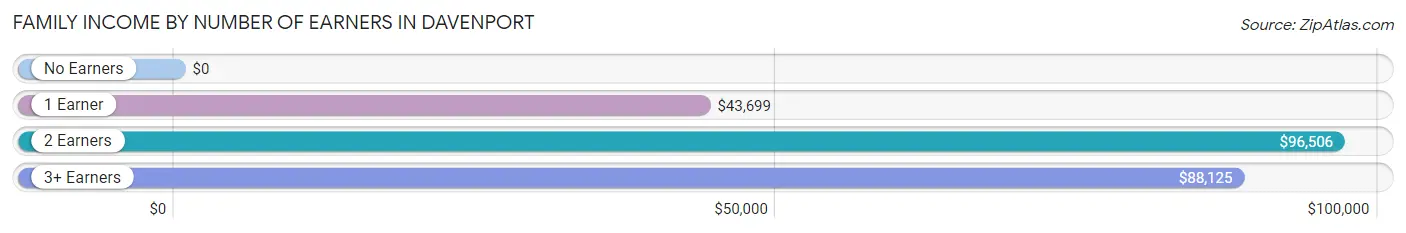
Family Income by Number of Earners in Davenport
| Number of Earners | # Families | Median Income |
| No Earners | 109 (4.7%) | $0 |
| 1 Earner | 809 (34.9%) | $43,699 |
| 2 Earners | 984 (42.5%) | $96,506 |
| 3+ Earners | 415 (17.9%) | $88,125 |
| Total | 2,317 (100.0%) | $69,509 |
Household Income in Davenport
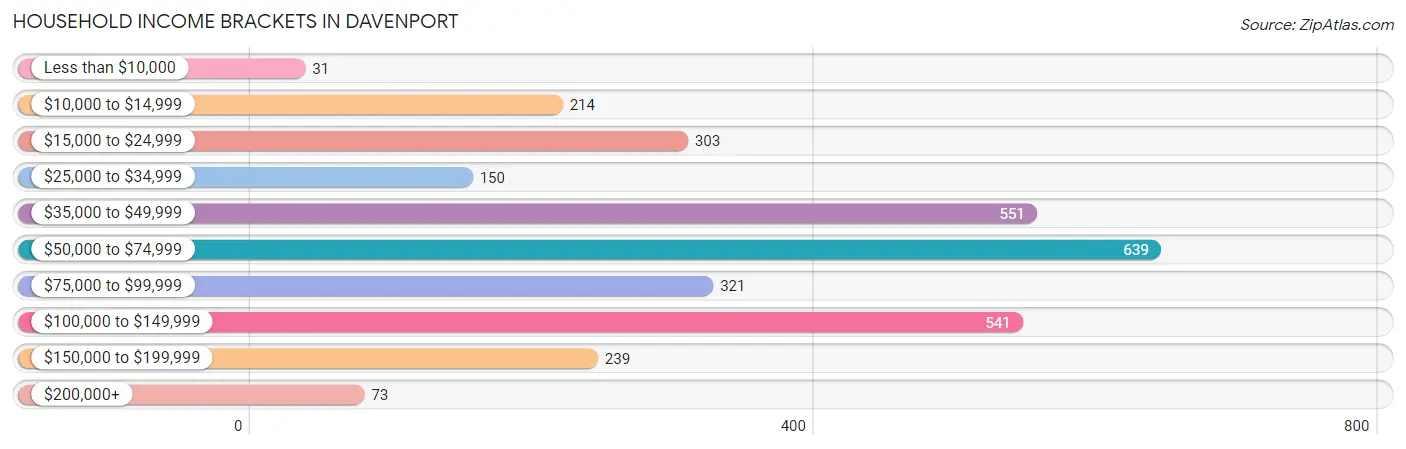
Household Income Brackets in Davenport
With 639 households falling in the category, the $50,000 to $74,999 income range is the most frequent in Davenport, accounting for 20.9% of all households. In contrast, only 31 households (1.0%) fall into the less than $10,000 income bracket, making it the least populous group.
| Income Bracket | # Households | % Households |
| Less than $10,000 | 31 | 1.0% |
| $10,000 to $14,999 | 214 | 7.0% |
| $15,000 to $24,999 | 303 | 9.9% |
| $25,000 to $34,999 | 150 | 4.9% |
| $35,000 to $49,999 | 551 | 18.0% |
| $50,000 to $74,999 | 639 | 20.9% |
| $75,000 to $99,999 | 321 | 10.5% |
| $100,000 to $149,999 | 541 | 17.7% |
| $150,000 to $199,999 | 239 | 7.8% |
| $200,000+ | 73 | 2.4% |
Household Income by Householder Age in Davenport
The median household income in Davenport is $64,428, with the highest median household income of $69,299 found in the 25 to 44 years age bracket for the primary householder. A total of 1,334 households (43.6%) fall into this category. Meanwhile, the 15 to 24 years age bracket for the primary householder has the lowest median household income of $0, with 230 households (7.5%) in this group.
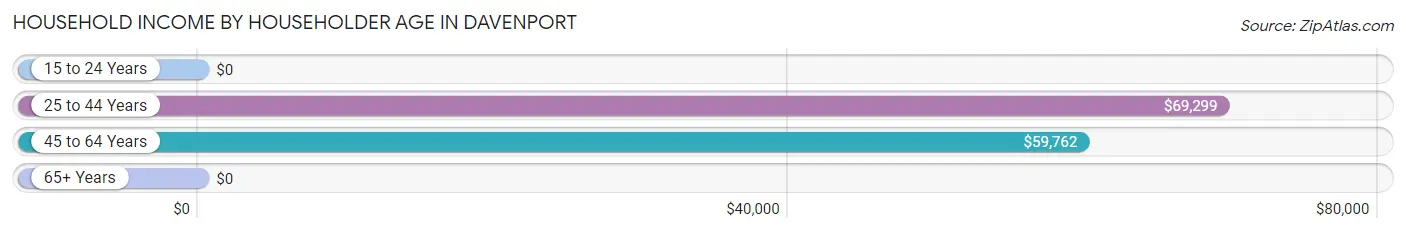
| Income Bracket | # Households | Median Income |
| 15 to 24 Years | 230 (7.5%) | $0 |
| 25 to 44 Years | 1,334 (43.6%) | $69,299 |
| 45 to 64 Years | 986 (32.2%) | $59,762 |
| 65+ Years | 509 (16.6%) | $0 |
| Total | 3,059 (100.0%) | $64,428 |
Poverty in Davenport
Income Below Poverty by Sex and Age in Davenport
With 18.6% poverty level for males and 17.0% for females among the residents of Davenport, 12 to 14 year old males and under 5 year old females are the most vulnerable to poverty, with 156 males (76.8%) and 167 females (38.6%) in their respective age groups living below the poverty level.
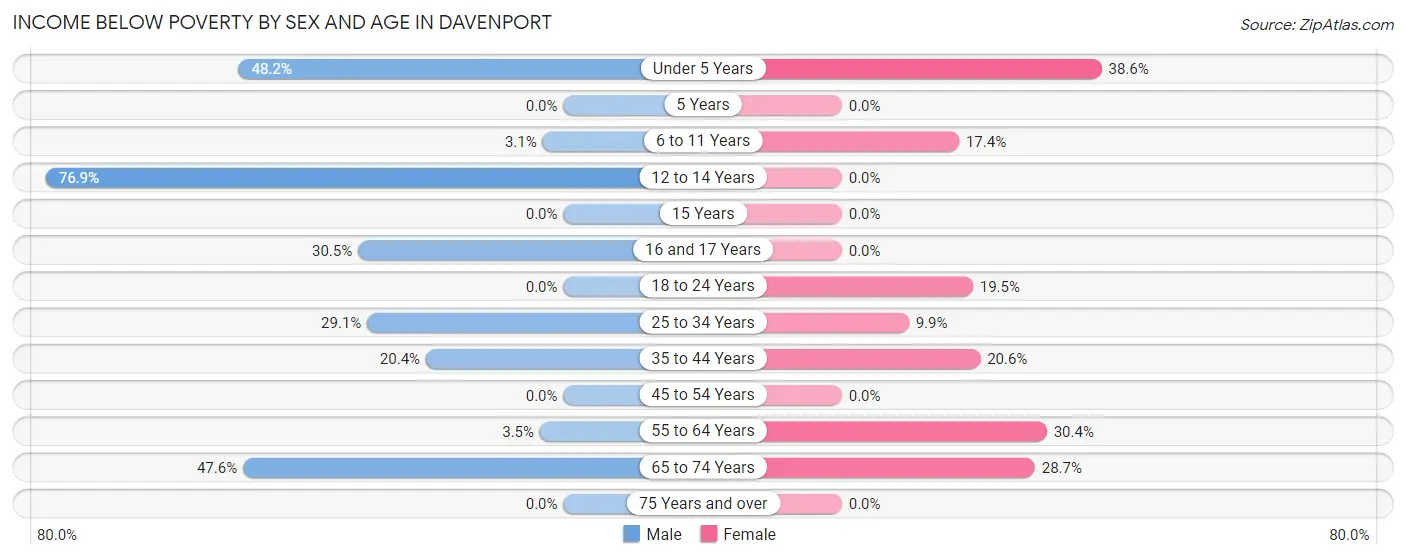
| Age Bracket | Male | Female |
| Under 5 Years | 203 (48.2%) | 167 (38.6%) |
| 5 Years | 0 (0.0%) | 0 (0.0%) |
| 6 to 11 Years | 14 (3.1%) | 59 (17.4%) |
| 12 to 14 Years | 156 (76.8%) | 0 (0.0%) |
| 15 Years | 0 (0.0%) | 0 (0.0%) |
| 16 and 17 Years | 50 (30.5%) | 0 (0.0%) |
| 18 to 24 Years | 0 (0.0%) | 127 (19.5%) |
| 25 to 34 Years | 185 (29.1%) | 54 (9.9%) |
| 35 to 44 Years | 201 (20.4%) | 225 (20.5%) |
| 45 to 54 Years | 0 (0.0%) | 0 (0.0%) |
| 55 to 64 Years | 16 (3.5%) | 126 (30.4%) |
| 65 to 74 Years | 137 (47.6%) | 96 (28.7%) |
| 75 Years and over | 0 (0.0%) | 0 (0.0%) |
| Total | 962 (18.6%) | 854 (17.0%) |
Income Above Poverty by Sex and Age in Davenport
According to the poverty statistics in Davenport, males aged 5 years and females aged 5 years are the age groups that are most secure financially, with 100.0% of males and 100.0% of females in these age groups living above the poverty line.
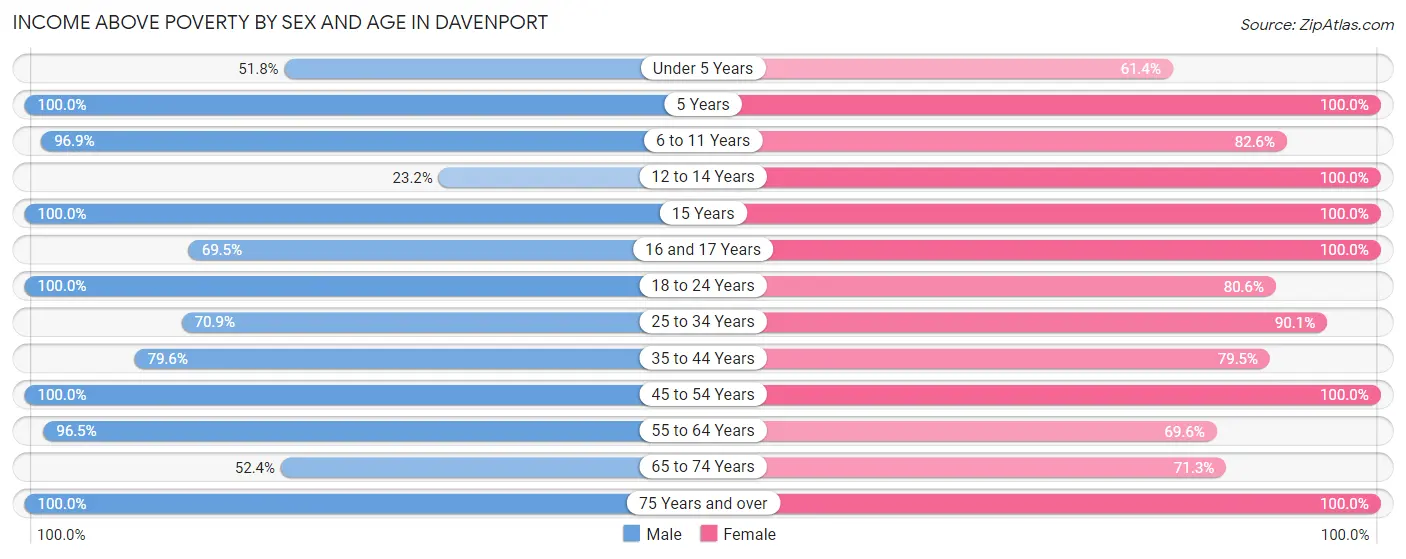
| Age Bracket | Male | Female |
| Under 5 Years | 218 (51.8%) | 266 (61.4%) |
| 5 Years | 112 (100.0%) | 43 (100.0%) |
| 6 to 11 Years | 439 (96.9%) | 280 (82.6%) |
| 12 to 14 Years | 47 (23.2%) | 217 (100.0%) |
| 15 Years | 141 (100.0%) | 69 (100.0%) |
| 16 and 17 Years | 114 (69.5%) | 177 (100.0%) |
| 18 to 24 Years | 454 (100.0%) | 526 (80.5%) |
| 25 to 34 Years | 450 (70.9%) | 489 (90.1%) |
| 35 to 44 Years | 784 (79.6%) | 870 (79.4%) |
| 45 to 54 Years | 671 (100.0%) | 508 (100.0%) |
| 55 to 64 Years | 443 (96.5%) | 288 (69.6%) |
| 65 to 74 Years | 151 (52.4%) | 239 (71.3%) |
| 75 Years and over | 176 (100.0%) | 185 (100.0%) |
| Total | 4,200 (81.4%) | 4,157 (83.0%) |
Income Below Poverty Among Married-Couple Families in Davenport
The poverty statistics for married-couple families in Davenport show that 13.0% or 236 of the total 1,823 families live below the poverty line. Families with 3 or 4 children have the highest poverty rate of 46.7%, comprising of 185 families. On the other hand, families with 1 or 2 children have the lowest poverty rate of 2.5%, which includes 20 families.
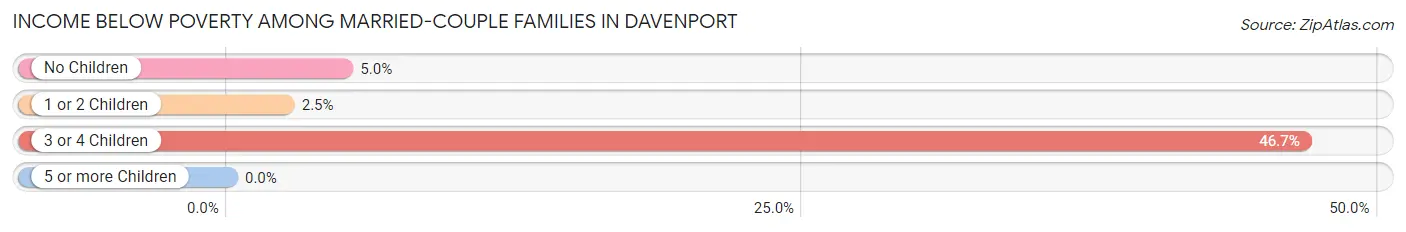
| Children | Above Poverty | Below Poverty |
| No Children | 586 (95.0%) | 31 (5.0%) |
| 1 or 2 Children | 790 (97.5%) | 20 (2.5%) |
| 3 or 4 Children | 211 (53.3%) | 185 (46.7%) |
| 5 or more Children | 0 (0.0%) | 0 (0.0%) |
| Total | 1,587 (87.1%) | 236 (13.0%) |
Income Below Poverty Among Single-Parent Households in Davenport
According to the poverty data in Davenport, 52.2% or 36 single-father households and 13.2% or 56 single-mother households are living below the poverty line. Among single-father households, those with 1 or 2 children have the highest poverty rate, with 20 households (100.0%) experiencing poverty. Likewise, among single-mother households, those with 1 or 2 children have the highest poverty rate, with 56 households (33.7%) falling below the poverty line.
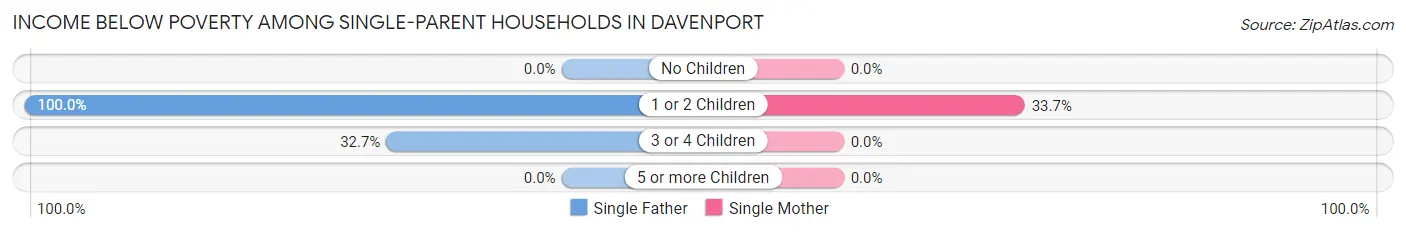
| Children | Single Father | Single Mother |
| No Children | 0 (0.0%) | 0 (0.0%) |
| 1 or 2 Children | 20 (100.0%) | 56 (33.7%) |
| 3 or 4 Children | 16 (32.7%) | 0 (0.0%) |
| 5 or more Children | 0 (0.0%) | 0 (0.0%) |
| Total | 36 (52.2%) | 56 (13.2%) |
Income Below Poverty Among Married-Couple vs Single-Parent Households in Davenport
The poverty data for Davenport shows that 236 of the married-couple family households (13.0%) and 92 of the single-parent households (18.6%) are living below the poverty level. Within the married-couple family households, those with 3 or 4 children have the highest poverty rate, with 185 households (46.7%) falling below the poverty line. Among the single-parent households, those with 1 or 2 children have the highest poverty rate, with 76 household (40.9%) living below poverty.
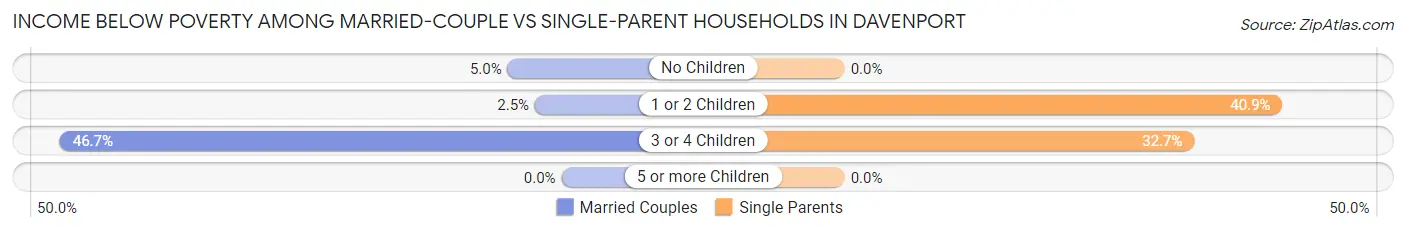
| Children | Married-Couple Families | Single-Parent Households |
| No Children | 31 (5.0%) | 0 (0.0%) |
| 1 or 2 Children | 20 (2.5%) | 76 (40.9%) |
| 3 or 4 Children | 185 (46.7%) | 16 (32.7%) |
| 5 or more Children | 0 (0.0%) | 0 (0.0%) |
| Total | 236 (13.0%) | 92 (18.6%) |
Race in Davenport
The most populous races in Davenport are Hispanic or Latino (5,598 | 54.6%), White / Caucasian (4,455 | 43.5%), and Some other Race (2,308 | 22.5%).
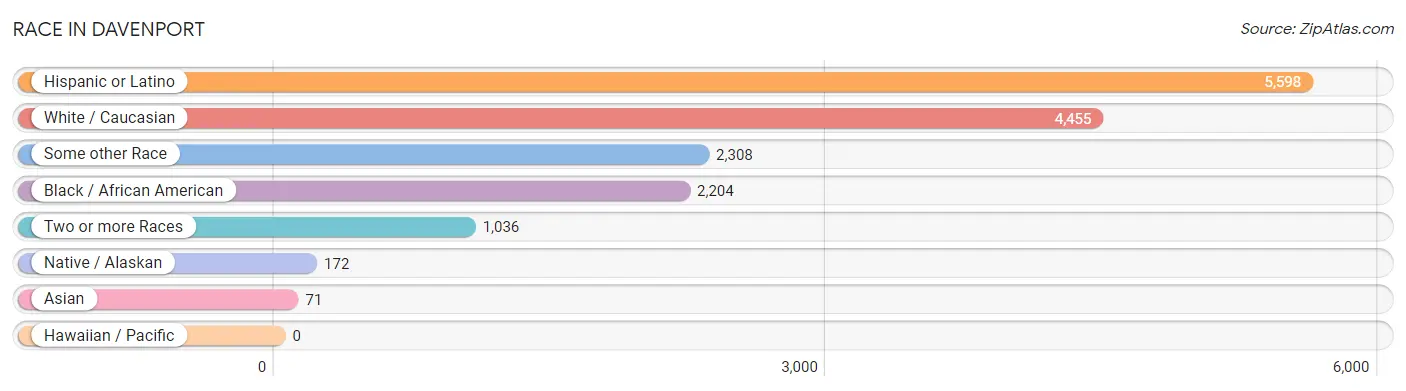
| Race | # Population | % Population |
| Asian | 71 | 0.7% |
| Black / African American | 2,204 | 21.5% |
| Hawaiian / Pacific | 0 | 0.0% |
| Hispanic or Latino | 5,598 | 54.6% |
| Native / Alaskan | 172 | 1.7% |
| White / Caucasian | 4,455 | 43.5% |
| Two or more Races | 1,036 | 10.1% |
| Some other Race | 2,308 | 22.5% |
| Total | 10,246 | 100.0% |
Ancestry in Davenport
The most populous ancestries reported in Davenport are Puerto Rican (3,537 | 34.5%), Haitian (1,127 | 11.0%), Mexican (844 | 8.2%), American (525 | 5.1%), and Dominican (520 | 5.1%), together accounting for 64.0% of all Davenport residents.
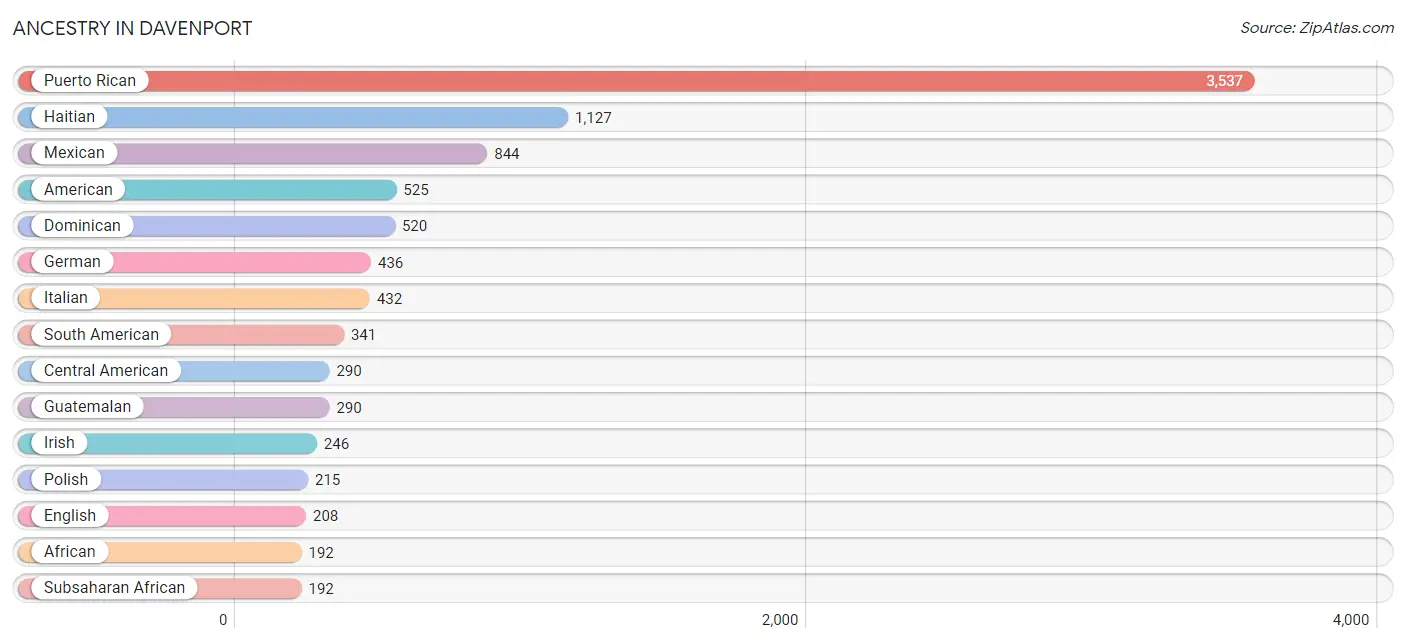
| Ancestry | # Population | % Population |
| African | 192 | 1.9% |
| American | 525 | 5.1% |
| Arab | 36 | 0.4% |
| Argentinean | 90 | 0.9% |
| Austrian | 39 | 0.4% |
| Brazilian | 70 | 0.7% |
| British | 65 | 0.6% |
| British West Indian | 22 | 0.2% |
| Central American | 290 | 2.8% |
| Central American Indian | 172 | 1.7% |
| Chilean | 23 | 0.2% |
| Colombian | 77 | 0.7% |
| Cuban | 66 | 0.6% |
| Dominican | 520 | 5.1% |
| Ecuadorian | 57 | 0.6% |
| English | 208 | 2.0% |
| European | 120 | 1.2% |
| French | 119 | 1.2% |
| French Canadian | 18 | 0.2% |
| German | 436 | 4.3% |
| Greek | 23 | 0.2% |
| Guatemalan | 290 | 2.8% |
| Haitian | 1,127 | 11.0% |
| Irish | 246 | 2.4% |
| Italian | 432 | 4.2% |
| Korean | 16 | 0.2% |
| Mexican | 844 | 8.2% |
| Moroccan | 36 | 0.4% |
| Northern European | 15 | 0.2% |
| Norwegian | 31 | 0.3% |
| Peruvian | 49 | 0.5% |
| Polish | 215 | 2.1% |
| Portuguese | 16 | 0.2% |
| Puerto Rican | 3,537 | 34.5% |
| Scotch-Irish | 41 | 0.4% |
| Scottish | 14 | 0.1% |
| South American | 341 | 3.3% |
| Sri Lankan | 55 | 0.5% |
| Subsaharan African | 192 | 1.9% |
| Trinidadian and Tobagonian | 46 | 0.4% |
| Venezuelan | 45 | 0.4% |
| Welsh | 63 | 0.6% |
| West Indian | 82 | 0.8% | View All 43 Rows |
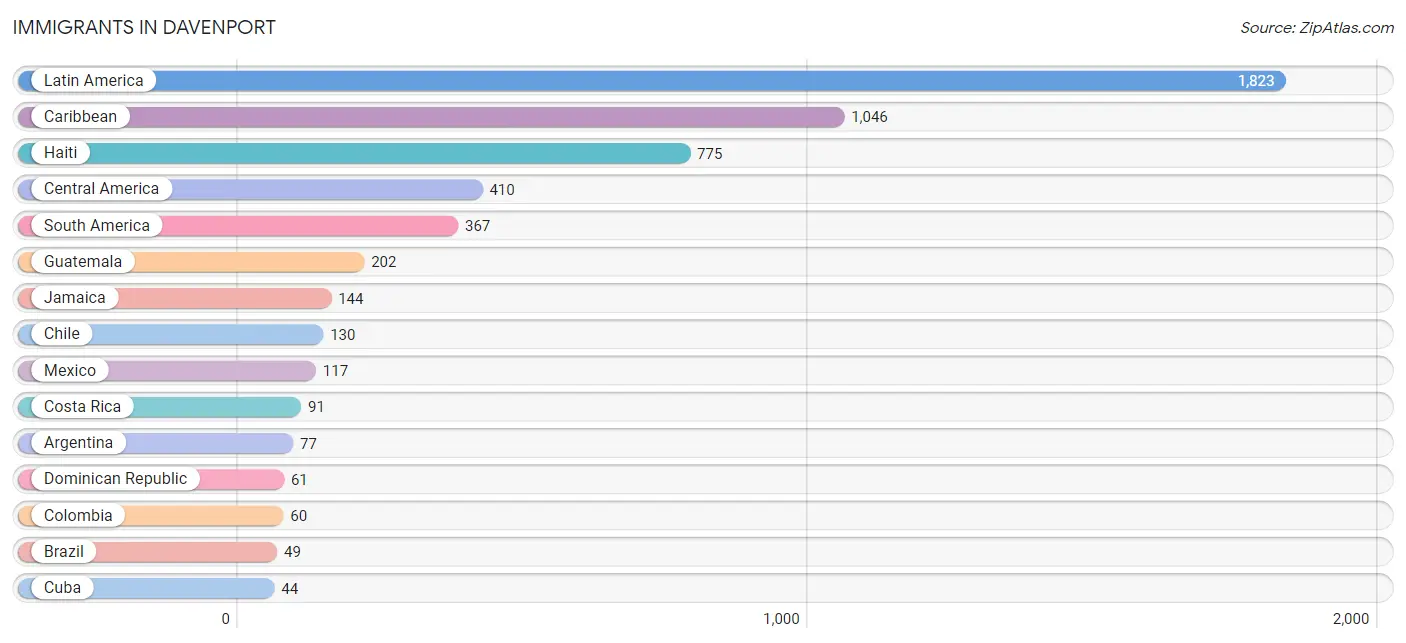
Immigrants in Davenport
The most numerous immigrant groups reported in Davenport came from Latin America (1,823 | 17.8%), Caribbean (1,046 | 10.2%), Haiti (775 | 7.6%), Central America (410 | 4.0%), and South America (367 | 3.6%), together accounting for 43.1% of all Davenport residents.
| Immigration Origin | # Population | % Population |
| Africa | 36 | 0.4% |
| Argentina | 77 | 0.7% |
| Asia | 16 | 0.2% |
| Brazil | 49 | 0.5% |
| Canada | 18 | 0.2% |
| Caribbean | 1,046 | 10.2% |
| Central America | 410 | 4.0% |
| Chile | 130 | 1.3% |
| Colombia | 60 | 0.6% |
| Costa Rica | 91 | 0.9% |
| Cuba | 44 | 0.4% |
| Dominican Republic | 61 | 0.6% |
| Europe | 34 | 0.3% |
| Guatemala | 202 | 2.0% |
| Haiti | 775 | 7.6% |
| Italy | 20 | 0.2% |
| Jamaica | 144 | 1.4% |
| Latin America | 1,823 | 17.8% |
| Mexico | 117 | 1.1% |
| Morocco | 36 | 0.4% |
| Northern Africa | 36 | 0.4% |
| Northern Europe | 14 | 0.1% |
| Peru | 31 | 0.3% |
| Philippines | 16 | 0.2% |
| South America | 367 | 3.6% |
| South Eastern Asia | 16 | 0.2% |
| Southern Europe | 20 | 0.2% |
| Venezuela | 20 | 0.2% | View All 28 Rows |
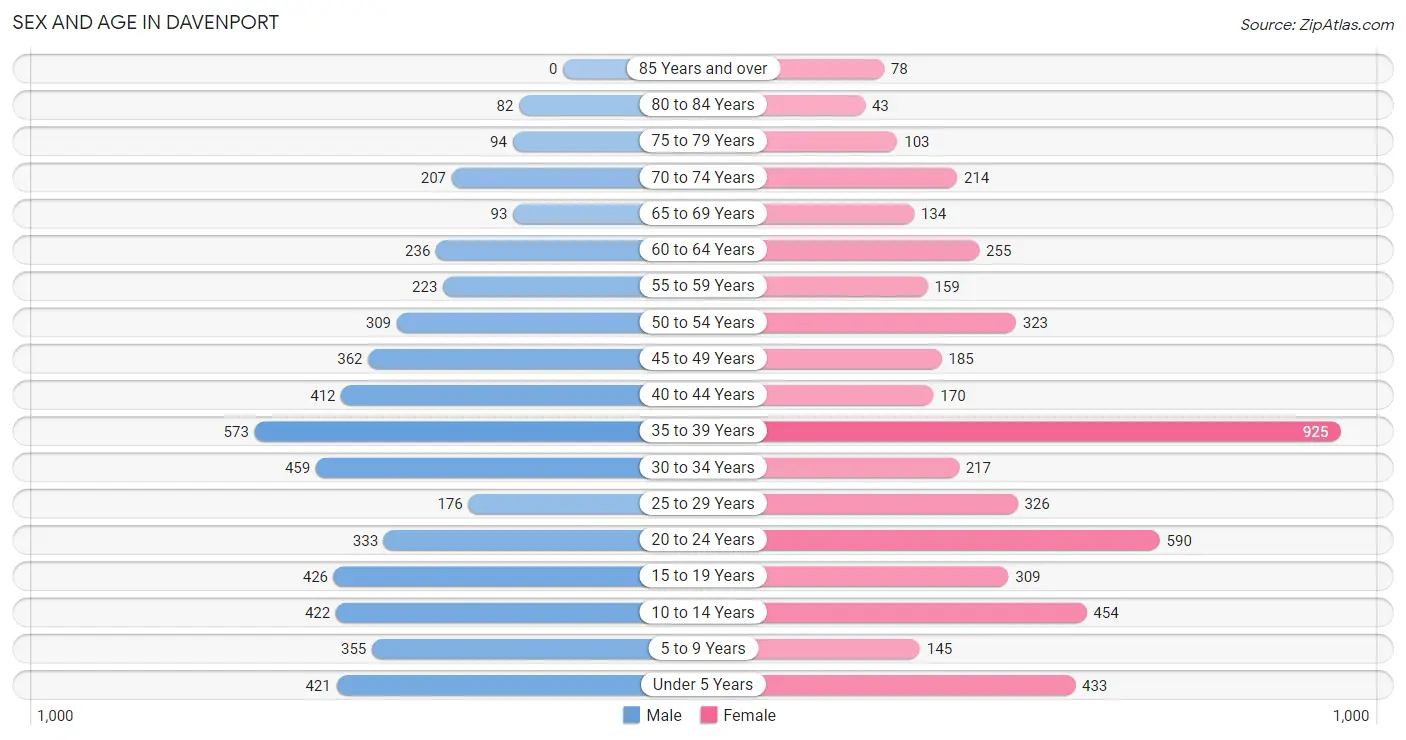
Sex and Age in Davenport
Sex and Age in Davenport
The most populous age groups in Davenport are 35 to 39 Years (573 | 11.1%) for men and 35 to 39 Years (925 | 18.3%) for women.
| Age Bracket | Male | Female |
| Under 5 Years | 421 (8.1%) | 433 (8.6%) |
| 5 to 9 Years | 355 (6.9%) | 145 (2.9%) |
| 10 to 14 Years | 422 (8.1%) | 454 (9.0%) |
| 15 to 19 Years | 426 (8.2%) | 309 (6.1%) |
| 20 to 24 Years | 333 (6.4%) | 590 (11.7%) |
| 25 to 29 Years | 176 (3.4%) | 326 (6.4%) |
| 30 to 34 Years | 459 (8.9%) | 217 (4.3%) |
| 35 to 39 Years | 573 (11.1%) | 925 (18.3%) |
| 40 to 44 Years | 412 (8.0%) | 170 (3.4%) |
| 45 to 49 Years | 362 (7.0%) | 185 (3.6%) |
| 50 to 54 Years | 309 (6.0%) | 323 (6.4%) |
| 55 to 59 Years | 223 (4.3%) | 159 (3.1%) |
| 60 to 64 Years | 236 (4.5%) | 255 (5.0%) |
| 65 to 69 Years | 93 (1.8%) | 134 (2.6%) |
| 70 to 74 Years | 207 (4.0%) | 214 (4.2%) |
| 75 to 79 Years | 94 (1.8%) | 103 (2.0%) |
| 80 to 84 Years | 82 (1.6%) | 43 (0.9%) |
| 85 Years and over | 0 (0.0%) | 78 (1.5%) |
| Total | 5,183 (100.0%) | 5,063 (100.0%) |
Families and Households in Davenport
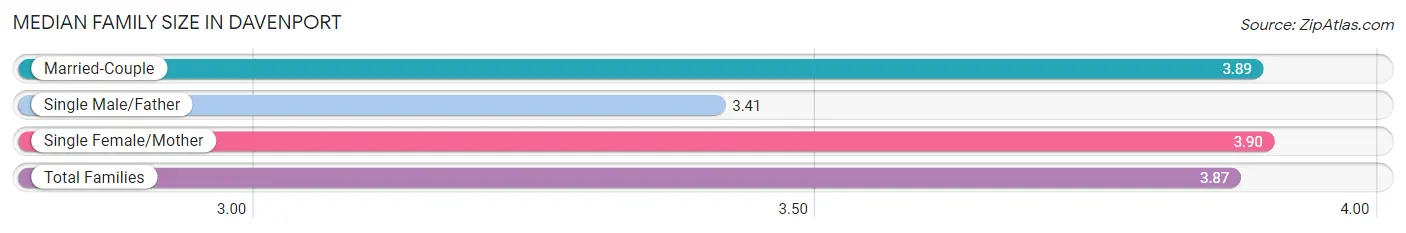
Median Family Size in Davenport
The median family size in Davenport is 3.87 persons per family, with single female/mother families (425 | 18.3%) accounting for the largest median family size of 3.9 persons per family. On the other hand, single male/father families (69 | 3.0%) represent the smallest median family size with 3.41 persons per family.
| Family Type | # Families | Family Size |
| Married-Couple | 1,823 (78.7%) | 3.89 |
| Single Male/Father | 69 (3.0%) | 3.41 |
| Single Female/Mother | 425 (18.3%) | 3.90 |
| Total Families | 2,317 (100.0%) | 3.87 |
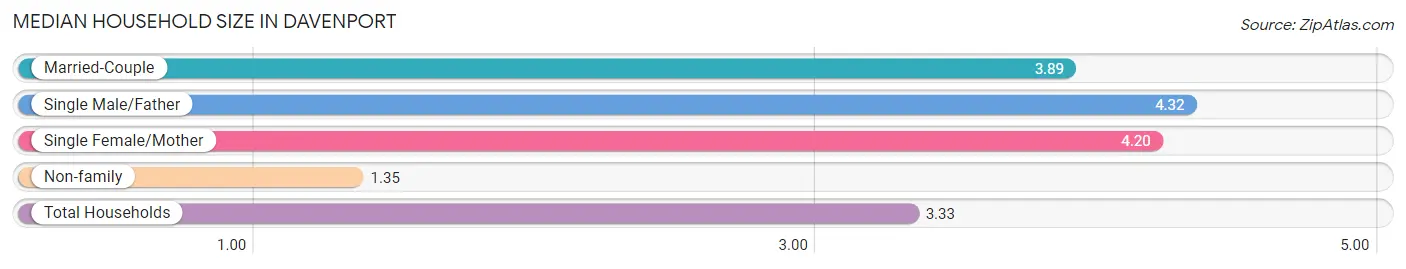
Median Household Size in Davenport
The median household size in Davenport is 3.33 persons per household, with single male/father households (69 | 2.3%) accounting for the largest median household size of 4.32 persons per household. non-family households (742 | 24.3%) represent the smallest median household size with 1.35 persons per household.
| Household Type | # Households | Household Size |
| Married-Couple | 1,823 (59.6%) | 3.89 |
| Single Male/Father | 69 (2.3%) | 4.32 |
| Single Female/Mother | 425 (13.9%) | 4.20 |
| Non-family | 742 (24.3%) | 1.35 |
| Total Households | 3,059 (100.0%) | 3.33 |
Household Size by Marriage Status in Davenport
Out of a total of 3,059 households in Davenport, 2,317 (75.7%) are family households, while 742 (24.3%) are nonfamily households. The most numerous type of family households are 2-person households, comprising 588, and the most common type of nonfamily households are 1-person households, comprising 534.
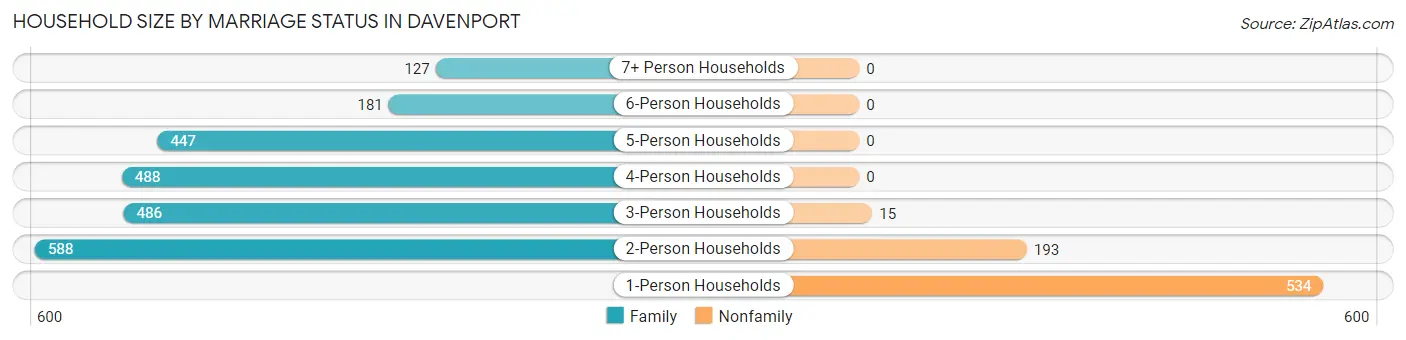
| Household Size | Family Households | Nonfamily Households |
| 1-Person Households | - | 534 (17.5%) |
| 2-Person Households | 588 (19.2%) | 193 (6.3%) |
| 3-Person Households | 486 (15.9%) | 15 (0.5%) |
| 4-Person Households | 488 (16.0%) | 0 (0.0%) |
| 5-Person Households | 447 (14.6%) | 0 (0.0%) |
| 6-Person Households | 181 (5.9%) | 0 (0.0%) |
| 7+ Person Households | 127 (4.2%) | 0 (0.0%) |
| Total | 2,317 (75.7%) | 742 (24.3%) |
Female Fertility in Davenport
Fertility by Age in Davenport
Average fertility rate in Davenport is 109.0 births per 1,000 women. Women in the age bracket of 20 to 34 years have the highest fertility rate with 234.0 births per 1,000 women. Women in the age bracket of 20 to 34 years acount for 84.1% of all women with births.
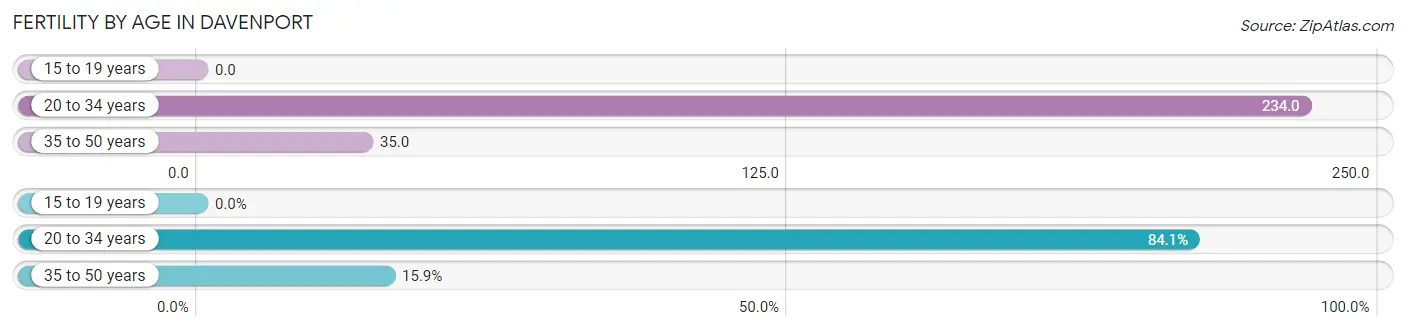
| Age Bracket | Women with Births | Births / 1,000 Women |
| 15 to 19 years | 0 (0.0%) | 0.0 |
| 20 to 34 years | 265 (84.1%) | 234.0 |
| 35 to 50 years | 50 (15.9%) | 35.0 |
| Total | 315 (100.0%) | 109.0 |
Fertility by Age by Marriage Status in Davenport
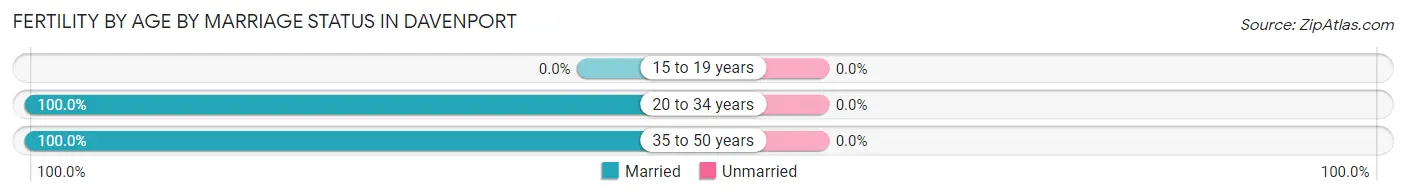
| Age Bracket | Married | Unmarried |
| 15 to 19 years | 0 (0.0%) | 0 (0.0%) |
| 20 to 34 years | 265 (100.0%) | 0 (0.0%) |
| 35 to 50 years | 50 (100.0%) | 0 (0.0%) |
| Total | 315 (100.0%) | 0 (0.0%) |
Fertility by Education in Davenport
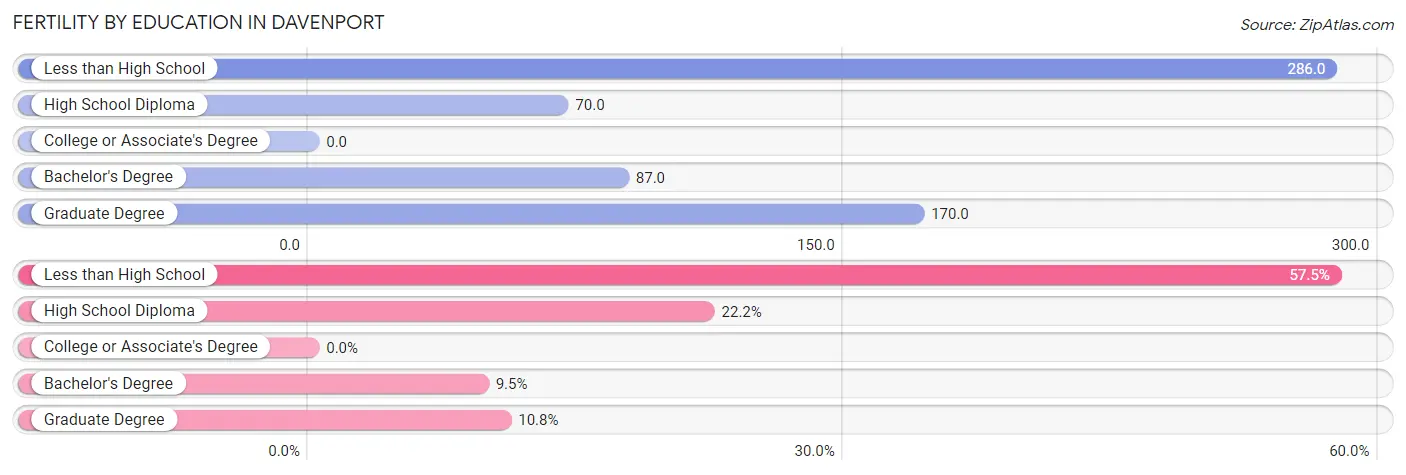
| Educational Attainment | Women with Births | Births / 1,000 Women |
| Less than High School | 181 (57.5%) | 286.0 |
| High School Diploma | 70 (22.2%) | 70.0 |
| College or Associate's Degree | 0 (0.0%) | 0.0 |
| Bachelor's Degree | 30 (9.5%) | 87.0 |
| Graduate Degree | 34 (10.8%) | 170.0 |
| Total | 315 (100.0%) | 109.0 |
Fertility by Education by Marriage Status in Davenport
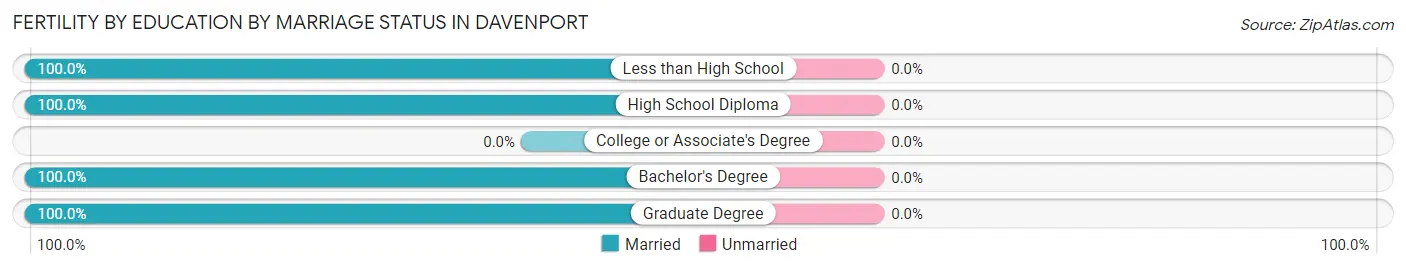
| Educational Attainment | Married | Unmarried |
| Less than High School | 181 (100.0%) | 0 (0.0%) |
| High School Diploma | 70 (100.0%) | 0 (0.0%) |
| College or Associate's Degree | 0 (0.0%) | 0 (0.0%) |
| Bachelor's Degree | 30 (100.0%) | 0 (0.0%) |
| Graduate Degree | 34 (100.0%) | 0 (0.0%) |
| Total | 315 (100.0%) | 0 (0.0%) |
Employment Characteristics in Davenport
Employment by Class of Employer in Davenport
Among the 5,163 employed individuals in Davenport, private company employees (4,202 | 81.4%), federal government employees (246 | 4.8%), and not-for-profit organizations (180 | 3.5%) make up the most common classes of employment.
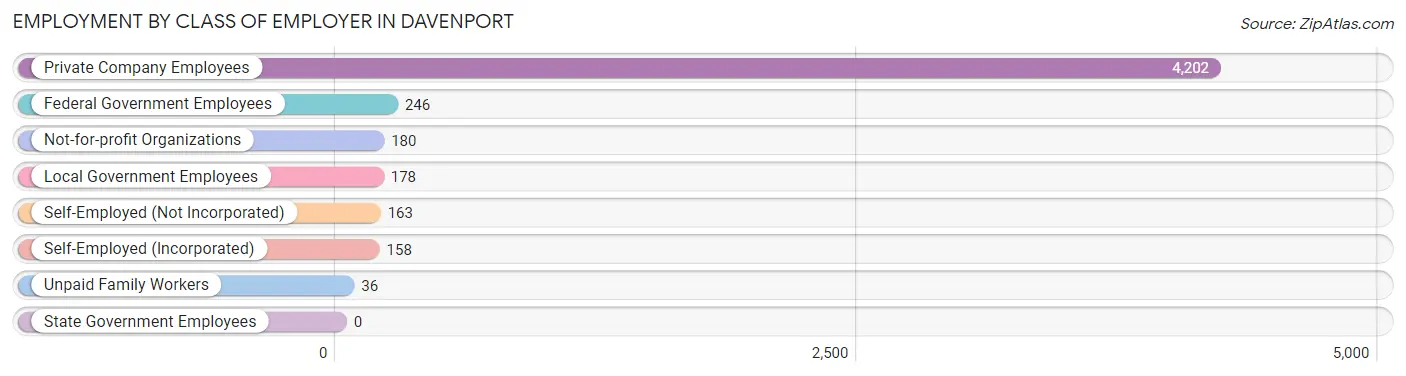
| Employer Class | # Employees | % Employees |
| Private Company Employees | 4,202 | 81.4% |
| Self-Employed (Incorporated) | 158 | 3.1% |
| Self-Employed (Not Incorporated) | 163 | 3.2% |
| Not-for-profit Organizations | 180 | 3.5% |
| Local Government Employees | 178 | 3.5% |
| State Government Employees | 0 | 0.0% |
| Federal Government Employees | 246 | 4.8% |
| Unpaid Family Workers | 36 | 0.7% |
| Total | 5,163 | 100.0% |
Employment Status by Age in Davenport
According to the labor force statistics for Davenport, out of the total population over 16 years of age (7,806), 69.2% or 5,402 individuals are in the labor force, with 2.6% or 140 of them unemployed. The age group with the highest labor force participation rate is 45 to 54 years, with 91.9% or 1,084 individuals in the labor force. Within the labor force, the 60 to 64 years age range has the highest percentage of unemployed individuals, with 7.4% or 21 of them being unemployed.
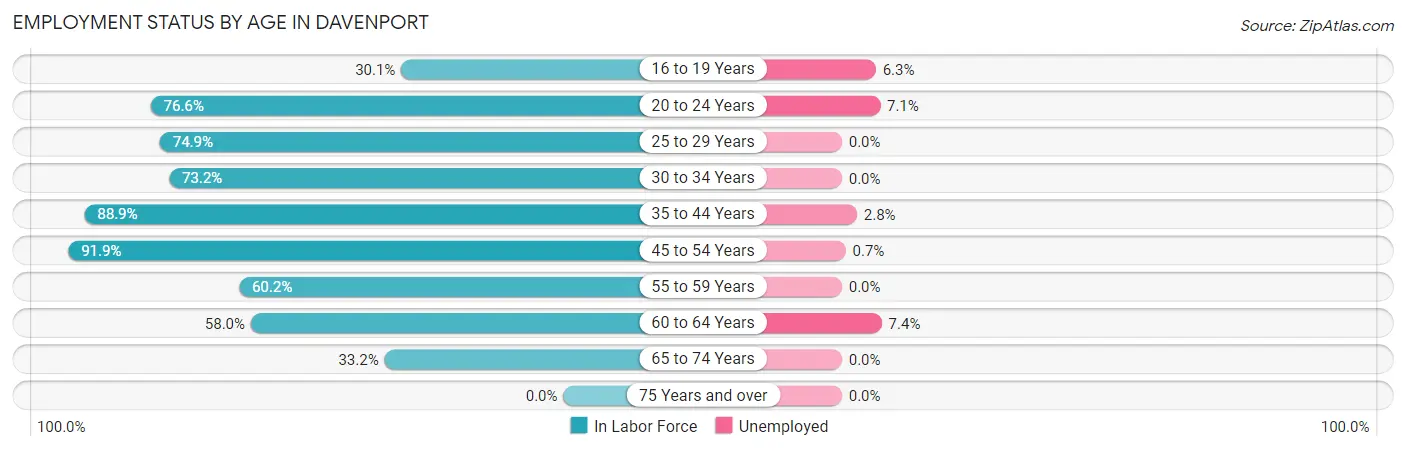
| Age Bracket | In Labor Force | Unemployed |
| 16 to 19 Years | 158 (30.1%) | 10 (6.3%) |
| 20 to 24 Years | 707 (76.6%) | 50 (7.1%) |
| 25 to 29 Years | 376 (74.9%) | 0 (0.0%) |
| 30 to 34 Years | 495 (73.2%) | 0 (0.0%) |
| 35 to 44 Years | 1,849 (88.9%) | 52 (2.8%) |
| 45 to 54 Years | 1,084 (91.9%) | 8 (0.7%) |
| 55 to 59 Years | 230 (60.2%) | 0 (0.0%) |
| 60 to 64 Years | 285 (58.0%) | 21 (7.4%) |
| 65 to 74 Years | 215 (33.2%) | 0 (0.0%) |
| 75 Years and over | 0 (0.0%) | 0 (0.0%) |
| Total | 5,402 (69.2%) | 140 (2.6%) |
Employment Status by Educational Attainment in Davenport
According to labor force statistics for Davenport, 81.3% of individuals (4,317) out of the total population between 25 and 64 years of age (5,310) are in the labor force, with 1.9% or 82 of them being unemployed. The group with the highest labor force participation rate are those with the educational attainment of high school diploma, with 89.0% or 1,566 individuals in the labor force. Within the labor force, individuals with less than high school education have the highest percentage of unemployment, with 5.3% or 21 of them being unemployed.
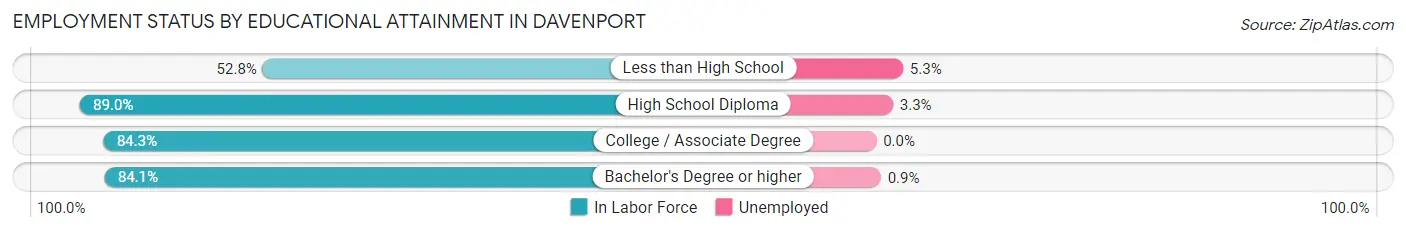
| Educational Attainment | In Labor Force | Unemployed |
| Less than High School | 398 (52.8%) | 40 (5.3%) |
| High School Diploma | 1,566 (89.0%) | 58 (3.3%) |
| College / Associate Degree | 1,500 (84.3%) | 0 (0.0%) |
| Bachelor's Degree or higher | 856 (84.1%) | 9 (0.9%) |
| Total | 4,317 (81.3%) | 101 (1.9%) |
Employment Occupations by Sex in Davenport
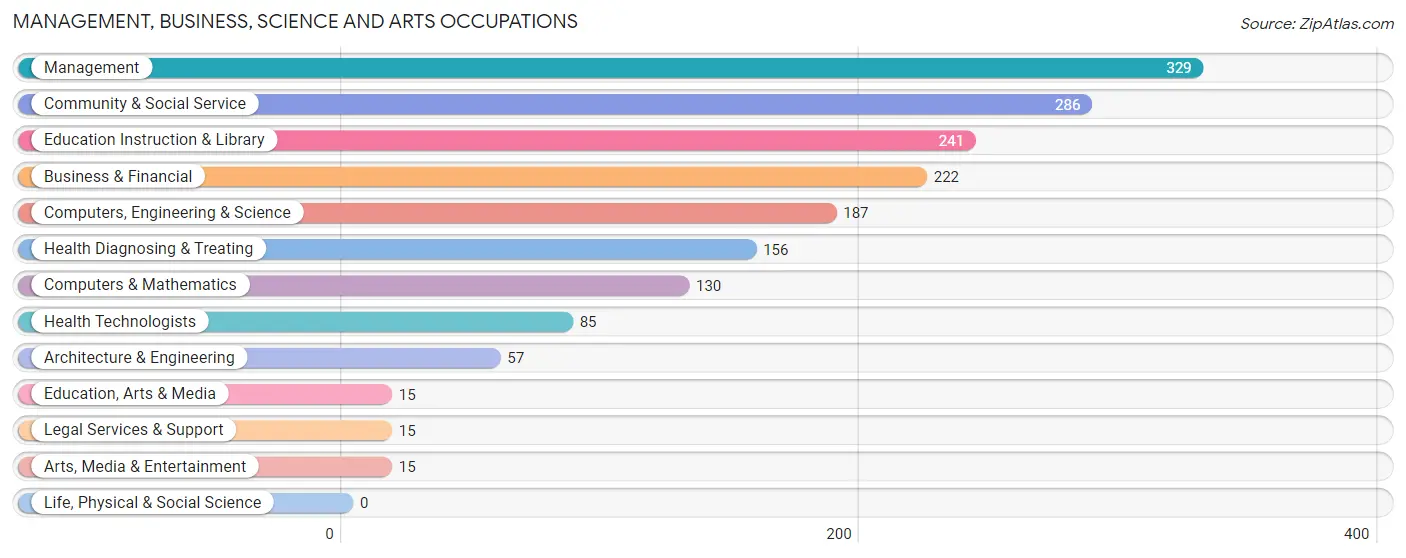
Management, Business, Science and Arts Occupations
The most common Management, Business, Science and Arts occupations in Davenport are Management (329 | 6.3%), Community & Social Service (286 | 5.4%), Education Instruction & Library (241 | 4.6%), Business & Financial (222 | 4.2%), and Computers, Engineering & Science (187 | 3.6%).
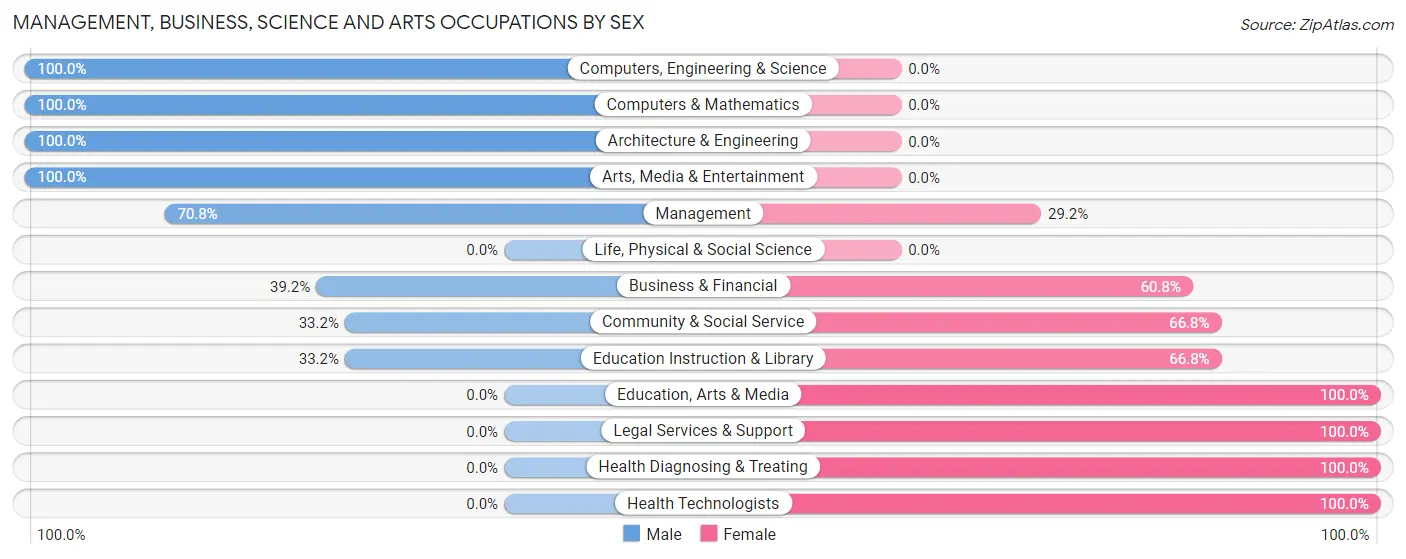
Management, Business, Science and Arts Occupations by Sex
Within the Management, Business, Science and Arts occupations in Davenport, the most male-oriented occupations are Computers, Engineering & Science (100.0%), Computers & Mathematics (100.0%), and Architecture & Engineering (100.0%), while the most female-oriented occupations are Education, Arts & Media (100.0%), Legal Services & Support (100.0%), and Health Diagnosing & Treating (100.0%).
| Occupation | Male | Female |
| Management | 233 (70.8%) | 96 (29.2%) |
| Business & Financial | 87 (39.2%) | 135 (60.8%) |
| Computers, Engineering & Science | 187 (100.0%) | 0 (0.0%) |
| Computers & Mathematics | 130 (100.0%) | 0 (0.0%) |
| Architecture & Engineering | 57 (100.0%) | 0 (0.0%) |
| Life, Physical & Social Science | 0 (0.0%) | 0 (0.0%) |
| Community & Social Service | 95 (33.2%) | 191 (66.8%) |
| Education, Arts & Media | 0 (0.0%) | 15 (100.0%) |
| Legal Services & Support | 0 (0.0%) | 15 (100.0%) |
| Education Instruction & Library | 80 (33.2%) | 161 (66.8%) |
| Arts, Media & Entertainment | 15 (100.0%) | 0 (0.0%) |
| Health Diagnosing & Treating | 0 (0.0%) | 156 (100.0%) |
| Health Technologists | 0 (0.0%) | 85 (100.0%) |
| Total (Category) | 602 (51.0%) | 578 (49.0%) |
| Total (Overall) | 2,878 (54.7%) | 2,379 (45.3%) |
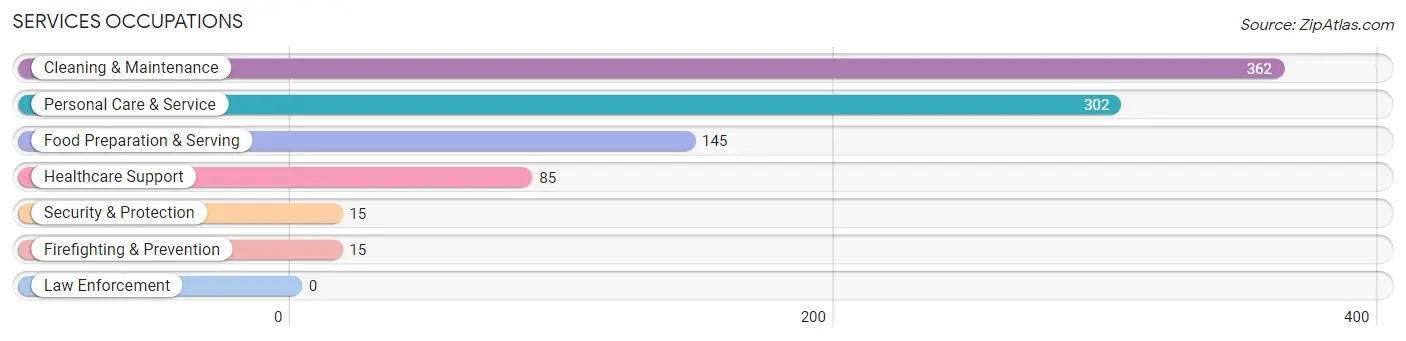
Services Occupations
The most common Services occupations in Davenport are Cleaning & Maintenance (362 | 6.9%), Personal Care & Service (302 | 5.7%), Food Preparation & Serving (145 | 2.8%), Healthcare Support (85 | 1.6%), and Security & Protection (15 | 0.3%).
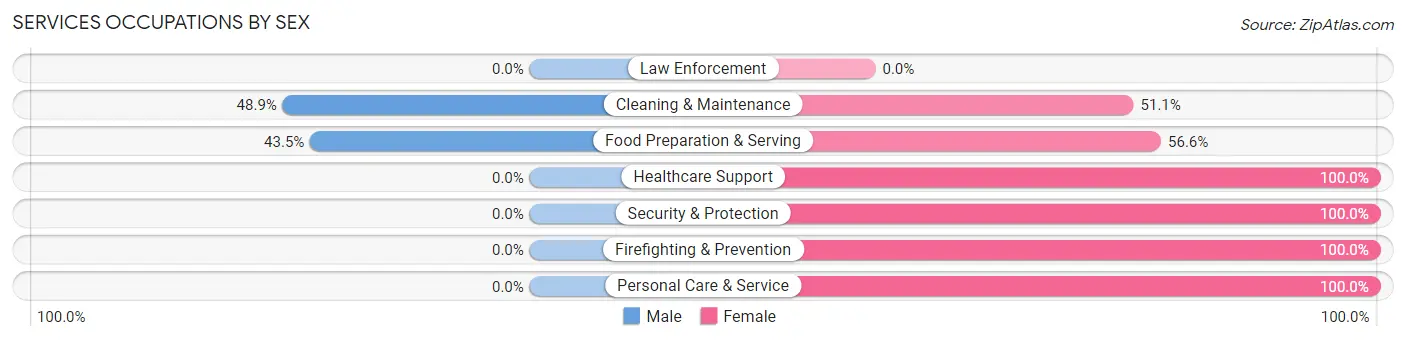
Services Occupations by Sex
Within the Services occupations in Davenport, the most male-oriented occupations are Cleaning & Maintenance (48.9%), and Food Preparation & Serving (43.4%), while the most female-oriented occupations are Healthcare Support (100.0%), Security & Protection (100.0%), and Firefighting & Prevention (100.0%).
| Occupation | Male | Female |
| Healthcare Support | 0 (0.0%) | 85 (100.0%) |
| Security & Protection | 0 (0.0%) | 15 (100.0%) |
| Firefighting & Prevention | 0 (0.0%) | 15 (100.0%) |
| Law Enforcement | 0 (0.0%) | 0 (0.0%) |
| Food Preparation & Serving | 63 (43.4%) | 82 (56.6%) |
| Cleaning & Maintenance | 177 (48.9%) | 185 (51.1%) |
| Personal Care & Service | 0 (0.0%) | 302 (100.0%) |
| Total (Category) | 240 (26.4%) | 669 (73.6%) |
| Total (Overall) | 2,878 (54.7%) | 2,379 (45.3%) |
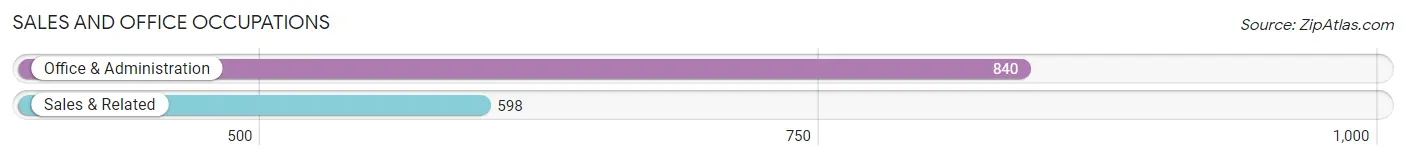
Sales and Office Occupations
The most common Sales and Office occupations in Davenport are Office & Administration (840 | 16.0%), and Sales & Related (598 | 11.4%).
Sales and Office Occupations by Sex
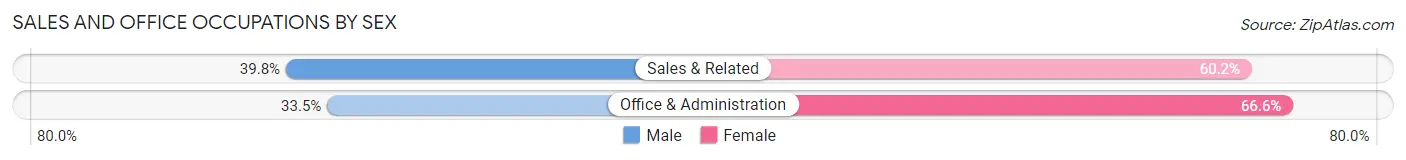
| Occupation | Male | Female |
| Sales & Related | 238 (39.8%) | 360 (60.2%) |
| Office & Administration | 281 (33.5%) | 559 (66.5%) |
| Total (Category) | 519 (36.1%) | 919 (63.9%) |
| Total (Overall) | 2,878 (54.7%) | 2,379 (45.3%) |
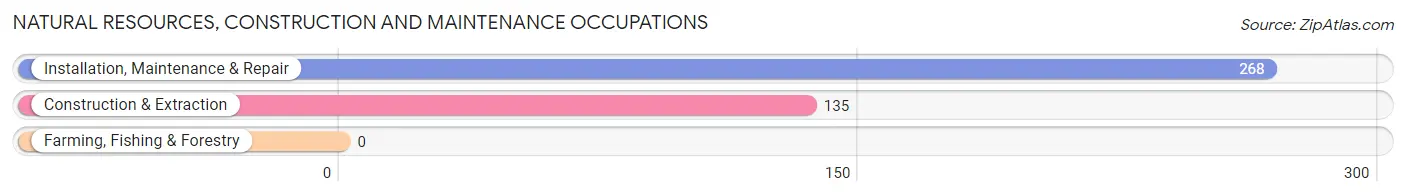
Natural Resources, Construction and Maintenance Occupations
The most common Natural Resources, Construction and Maintenance occupations in Davenport are Installation, Maintenance & Repair (268 | 5.1%), and Construction & Extraction (135 | 2.6%).
Natural Resources, Construction and Maintenance Occupations by Sex
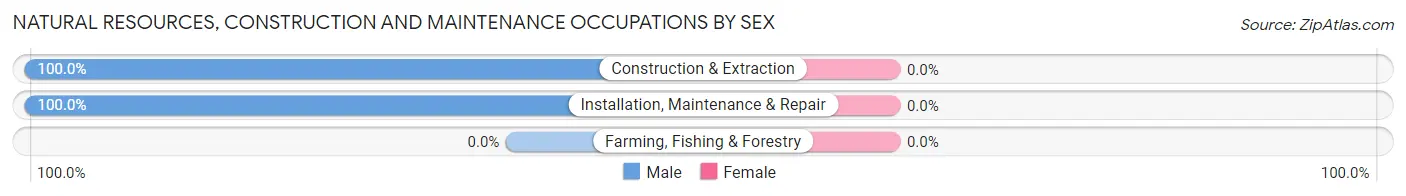
| Occupation | Male | Female |
| Farming, Fishing & Forestry | 0 (0.0%) | 0 (0.0%) |
| Construction & Extraction | 135 (100.0%) | 0 (0.0%) |
| Installation, Maintenance & Repair | 268 (100.0%) | 0 (0.0%) |
| Total (Category) | 403 (100.0%) | 0 (0.0%) |
| Total (Overall) | 2,878 (54.7%) | 2,379 (45.3%) |
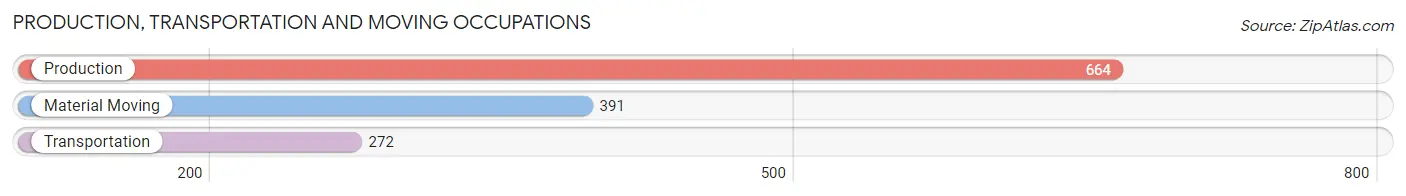
Production, Transportation and Moving Occupations
The most common Production, Transportation and Moving occupations in Davenport are Production (664 | 12.6%), Material Moving (391 | 7.4%), and Transportation (272 | 5.2%).
Production, Transportation and Moving Occupations by Sex
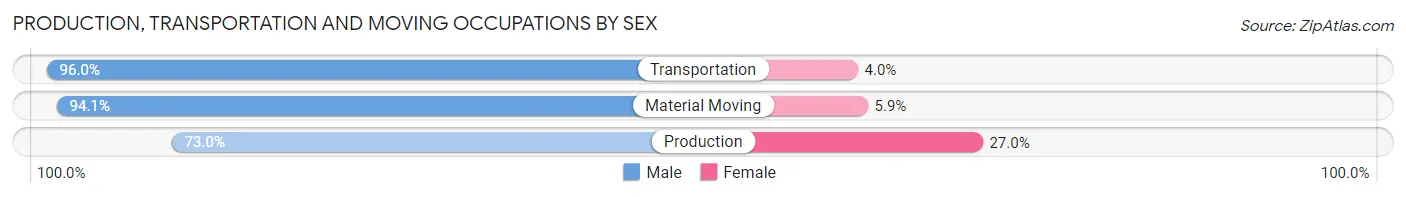
| Occupation | Male | Female |
| Production | 485 (73.0%) | 179 (27.0%) |
| Transportation | 261 (96.0%) | 11 (4.0%) |
| Material Moving | 368 (94.1%) | 23 (5.9%) |
| Total (Category) | 1,114 (84.0%) | 213 (16.1%) |
| Total (Overall) | 2,878 (54.7%) | 2,379 (45.3%) |
Employment Industries by Sex in Davenport
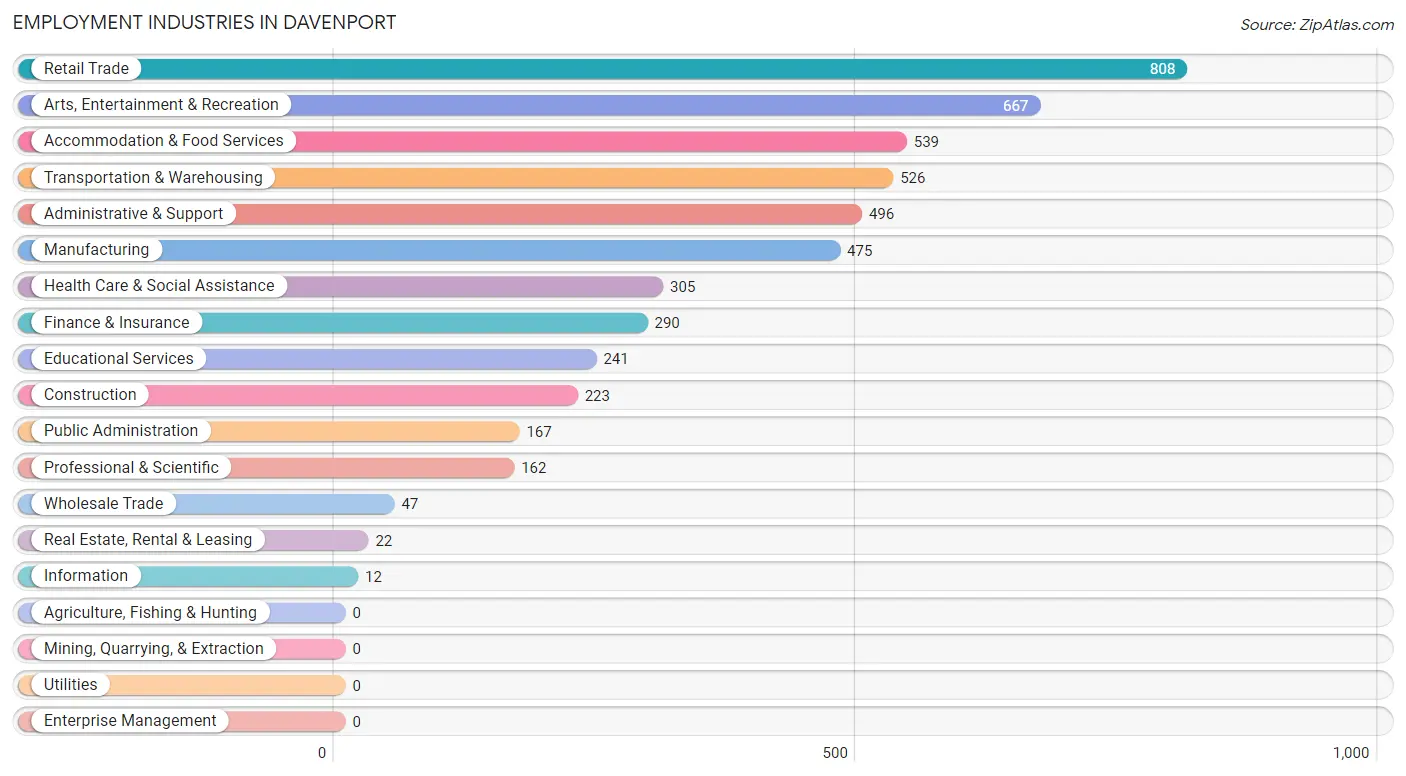
Employment Industries in Davenport
The major employment industries in Davenport include Retail Trade (808 | 15.4%), Arts, Entertainment & Recreation (667 | 12.7%), Accommodation & Food Services (539 | 10.2%), Transportation & Warehousing (526 | 10.0%), and Administrative & Support (496 | 9.4%).
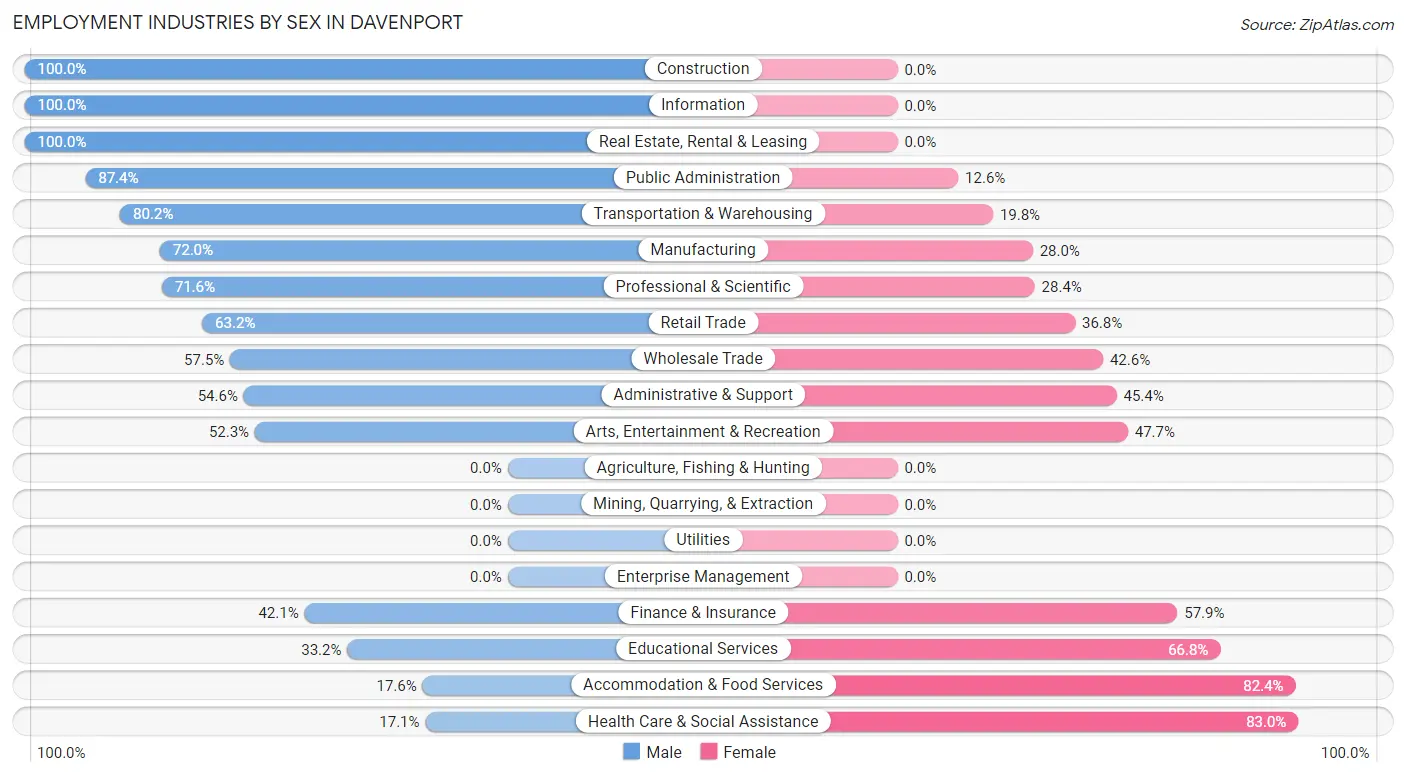
Employment Industries by Sex in Davenport
The Davenport industries that see more men than women are Construction (100.0%), Information (100.0%), and Real Estate, Rental & Leasing (100.0%), whereas the industries that tend to have a higher number of women are Health Care & Social Assistance (83.0%), Accommodation & Food Services (82.4%), and Educational Services (66.8%).
| Industry | Male | Female |
| Agriculture, Fishing & Hunting | 0 (0.0%) | 0 (0.0%) |
| Mining, Quarrying, & Extraction | 0 (0.0%) | 0 (0.0%) |
| Construction | 223 (100.0%) | 0 (0.0%) |
| Manufacturing | 342 (72.0%) | 133 (28.0%) |
| Wholesale Trade | 27 (57.5%) | 20 (42.5%) |
| Retail Trade | 511 (63.2%) | 297 (36.8%) |
| Transportation & Warehousing | 422 (80.2%) | 104 (19.8%) |
| Utilities | 0 (0.0%) | 0 (0.0%) |
| Information | 12 (100.0%) | 0 (0.0%) |
| Finance & Insurance | 122 (42.1%) | 168 (57.9%) |
| Real Estate, Rental & Leasing | 22 (100.0%) | 0 (0.0%) |
| Professional & Scientific | 116 (71.6%) | 46 (28.4%) |
| Enterprise Management | 0 (0.0%) | 0 (0.0%) |
| Administrative & Support | 271 (54.6%) | 225 (45.4%) |
| Educational Services | 80 (33.2%) | 161 (66.8%) |
| Health Care & Social Assistance | 52 (17.1%) | 253 (83.0%) |
| Arts, Entertainment & Recreation | 349 (52.3%) | 318 (47.7%) |
| Accommodation & Food Services | 95 (17.6%) | 444 (82.4%) |
| Public Administration | 146 (87.4%) | 21 (12.6%) |
| Total | 2,878 (54.7%) | 2,379 (45.3%) |
Education in Davenport
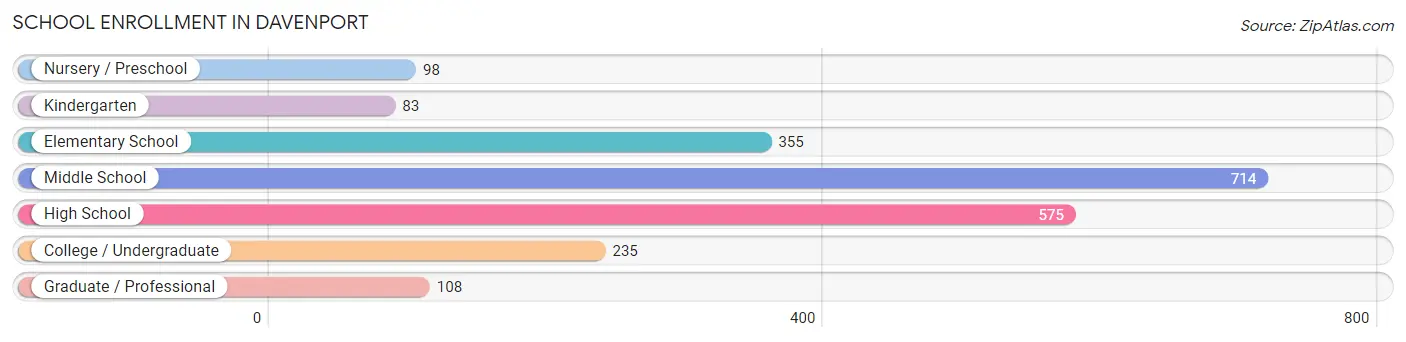
School Enrollment in Davenport
The most common levels of schooling among the 2,168 students in Davenport are middle school (714 | 32.9%), high school (575 | 26.5%), and elementary school (355 | 16.4%).
| School Level | # Students | % Students |
| Nursery / Preschool | 98 | 4.5% |
| Kindergarten | 83 | 3.8% |
| Elementary School | 355 | 16.4% |
| Middle School | 714 | 32.9% |
| High School | 575 | 26.5% |
| College / Undergraduate | 235 | 10.8% |
| Graduate / Professional | 108 | 5.0% |
| Total | 2,168 | 100.0% |
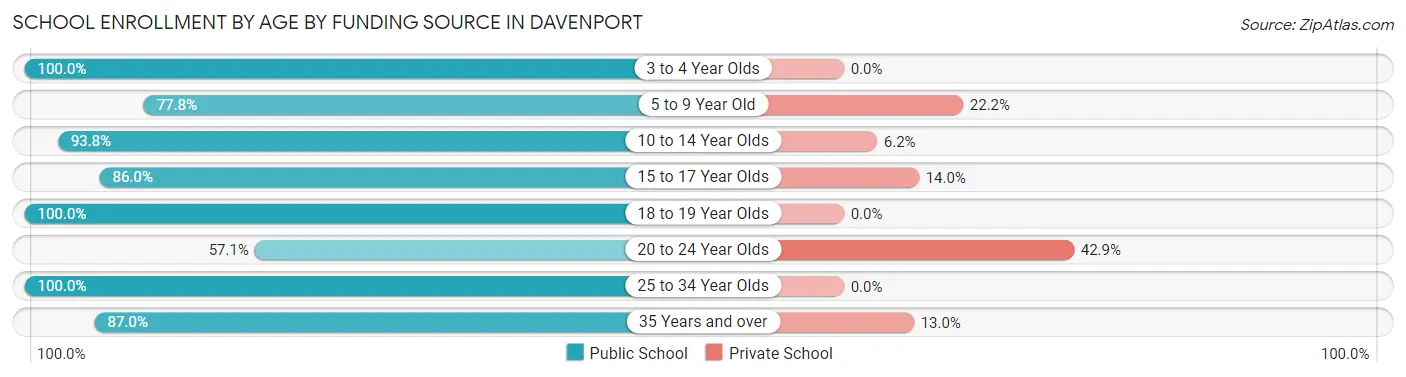
School Enrollment by Age by Funding Source in Davenport
Out of a total of 2,168 students who are enrolled in schools in Davenport, 273 (12.6%) attend a private institution, while the remaining 1,895 (87.4%) are enrolled in public schools. The age group of 20 to 24 year olds has the highest likelihood of being enrolled in private schools, with 24 (42.9% in the age bracket) enrolled. Conversely, the age group of 3 to 4 year olds has the lowest likelihood of being enrolled in a private school, with 19 (100.0% in the age bracket) attending a public institution.
| Age Bracket | Public School | Private School |
| 3 to 4 Year Olds | 19 (100.0%) | 0 (0.0%) |
| 5 to 9 Year Old | 347 (77.8%) | 99 (22.2%) |
| 10 to 14 Year Olds | 744 (93.8%) | 49 (6.2%) |
| 15 to 17 Year Olds | 474 (86.0%) | 77 (14.0%) |
| 18 to 19 Year Olds | 99 (100.0%) | 0 (0.0%) |
| 20 to 24 Year Olds | 32 (57.1%) | 24 (42.9%) |
| 25 to 34 Year Olds | 20 (100.0%) | 0 (0.0%) |
| 35 Years and over | 160 (87.0%) | 24 (13.0%) |
| Total | 1,895 (87.4%) | 273 (12.6%) |
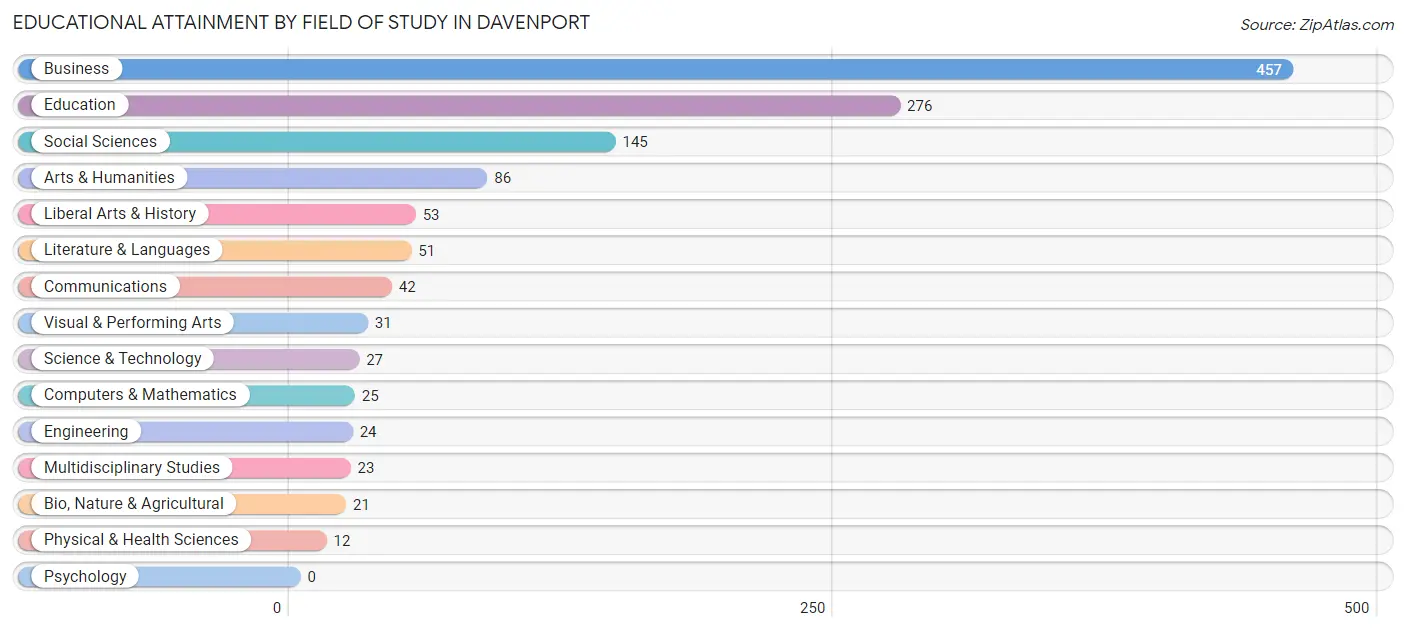
Educational Attainment by Field of Study in Davenport
Business (457 | 35.9%), education (276 | 21.7%), social sciences (145 | 11.4%), arts & humanities (86 | 6.8%), and liberal arts & history (53 | 4.2%) are the most common fields of study among 1,273 individuals in Davenport who have obtained a bachelor's degree or higher.
| Field of Study | # Graduates | % Graduates |
| Computers & Mathematics | 25 | 2.0% |
| Bio, Nature & Agricultural | 21 | 1.7% |
| Physical & Health Sciences | 12 | 0.9% |
| Psychology | 0 | 0.0% |
| Social Sciences | 145 | 11.4% |
| Engineering | 24 | 1.9% |
| Multidisciplinary Studies | 23 | 1.8% |
| Science & Technology | 27 | 2.1% |
| Business | 457 | 35.9% |
| Education | 276 | 21.7% |
| Literature & Languages | 51 | 4.0% |
| Liberal Arts & History | 53 | 4.2% |
| Visual & Performing Arts | 31 | 2.4% |
| Communications | 42 | 3.3% |
| Arts & Humanities | 86 | 6.8% |
| Total | 1,273 | 100.0% |
Transportation & Commute in Davenport
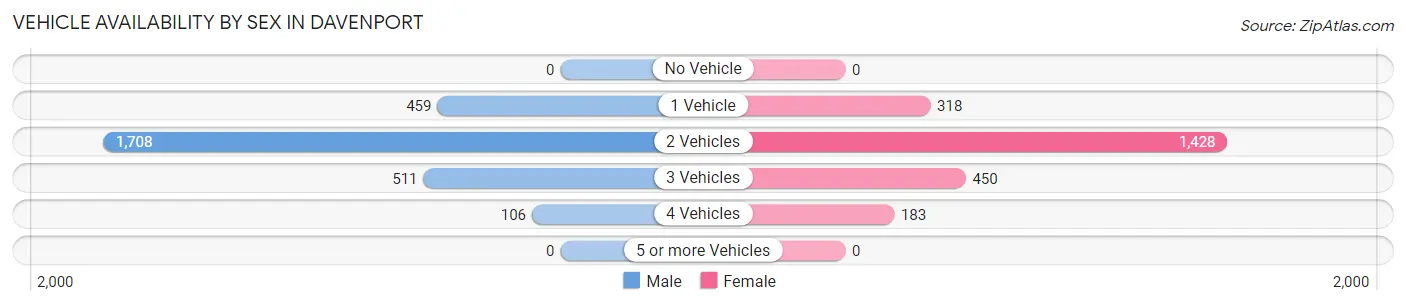
Vehicle Availability by Sex in Davenport
The most prevalent vehicle ownership categories in Davenport are males with 2 vehicles (1,708, accounting for 61.4%) and females with 2 vehicles (1,428, making up 71.8%).
| Vehicles Available | Male | Female |
| No Vehicle | 0 (0.0%) | 0 (0.0%) |
| 1 Vehicle | 459 (16.5%) | 318 (13.4%) |
| 2 Vehicles | 1,708 (61.4%) | 1,428 (60.0%) |
| 3 Vehicles | 511 (18.3%) | 450 (18.9%) |
| 4 Vehicles | 106 (3.8%) | 183 (7.7%) |
| 5 or more Vehicles | 0 (0.0%) | 0 (0.0%) |
| Total | 2,784 (100.0%) | 2,379 (100.0%) |
Commute Time in Davenport
The most frequently occuring commute durations in Davenport are 45 to 59 minutes (1,479 commuters, 32.2%), 30 to 34 minutes (607 commuters, 13.2%), and 40 to 44 minutes (510 commuters, 11.1%).
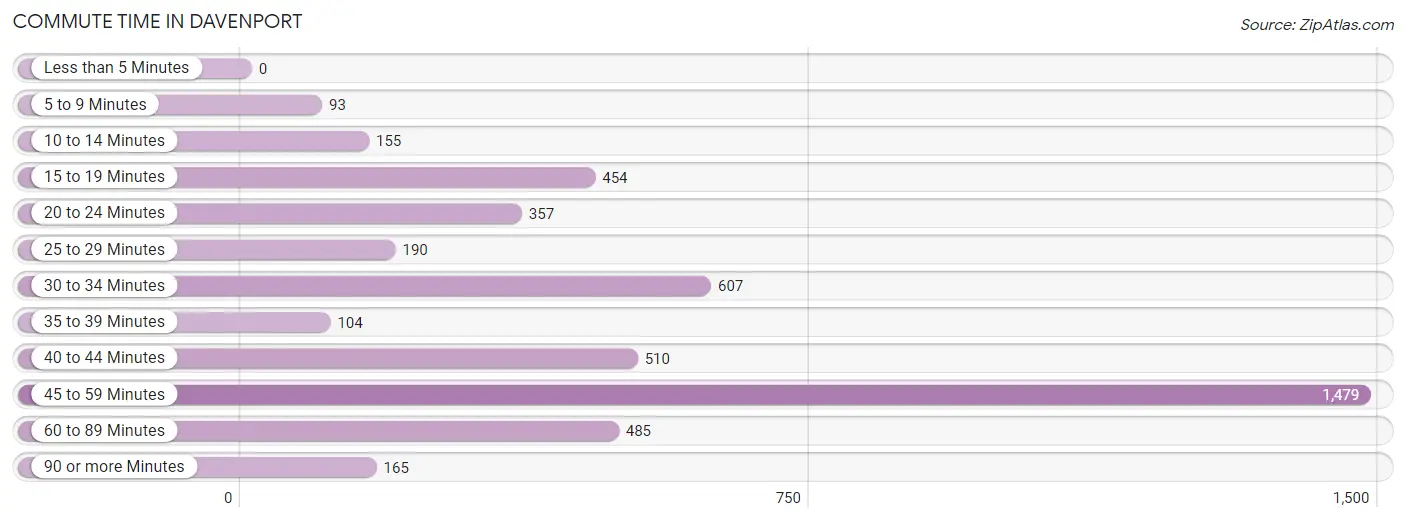
| Commute Time | # Commuters | % Commuters |
| Less than 5 Minutes | 0 | 0.0% |
| 5 to 9 Minutes | 93 | 2.0% |
| 10 to 14 Minutes | 155 | 3.4% |
| 15 to 19 Minutes | 454 | 9.9% |
| 20 to 24 Minutes | 357 | 7.8% |
| 25 to 29 Minutes | 190 | 4.1% |
| 30 to 34 Minutes | 607 | 13.2% |
| 35 to 39 Minutes | 104 | 2.3% |
| 40 to 44 Minutes | 510 | 11.1% |
| 45 to 59 Minutes | 1,479 | 32.2% |
| 60 to 89 Minutes | 485 | 10.5% |
| 90 or more Minutes | 165 | 3.6% |
Commute Time by Sex in Davenport
The most common commute times in Davenport are 45 to 59 minutes (897 commuters, 34.1%) for males and 45 to 59 minutes (582 commuters, 29.5%) for females.
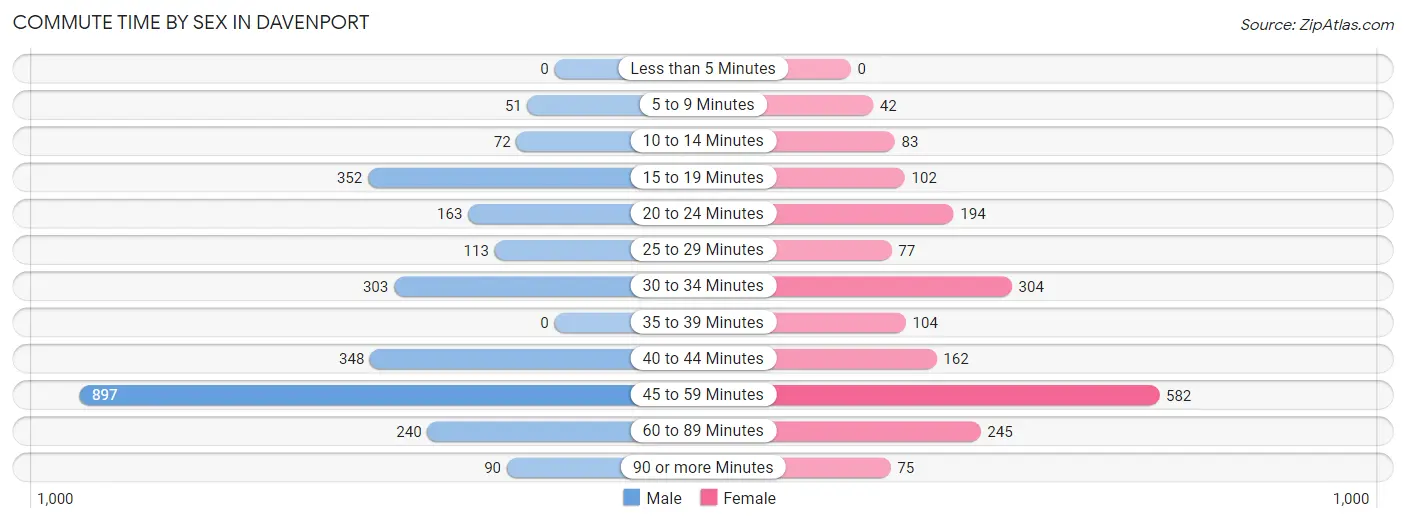
| Commute Time | Male | Female |
| Less than 5 Minutes | 0 (0.0%) | 0 (0.0%) |
| 5 to 9 Minutes | 51 (1.9%) | 42 (2.1%) |
| 10 to 14 Minutes | 72 (2.7%) | 83 (4.2%) |
| 15 to 19 Minutes | 352 (13.4%) | 102 (5.2%) |
| 20 to 24 Minutes | 163 (6.2%) | 194 (9.9%) |
| 25 to 29 Minutes | 113 (4.3%) | 77 (3.9%) |
| 30 to 34 Minutes | 303 (11.5%) | 304 (15.4%) |
| 35 to 39 Minutes | 0 (0.0%) | 104 (5.3%) |
| 40 to 44 Minutes | 348 (13.2%) | 162 (8.2%) |
| 45 to 59 Minutes | 897 (34.1%) | 582 (29.5%) |
| 60 to 89 Minutes | 240 (9.1%) | 245 (12.4%) |
| 90 or more Minutes | 90 (3.4%) | 75 (3.8%) |
Time of Departure to Work by Sex in Davenport
The most frequent times of departure to work in Davenport are 7:00 AM to 7:29 AM (725, 27.6%) for males and 7:00 AM to 7:29 AM (374, 19.0%) for females.
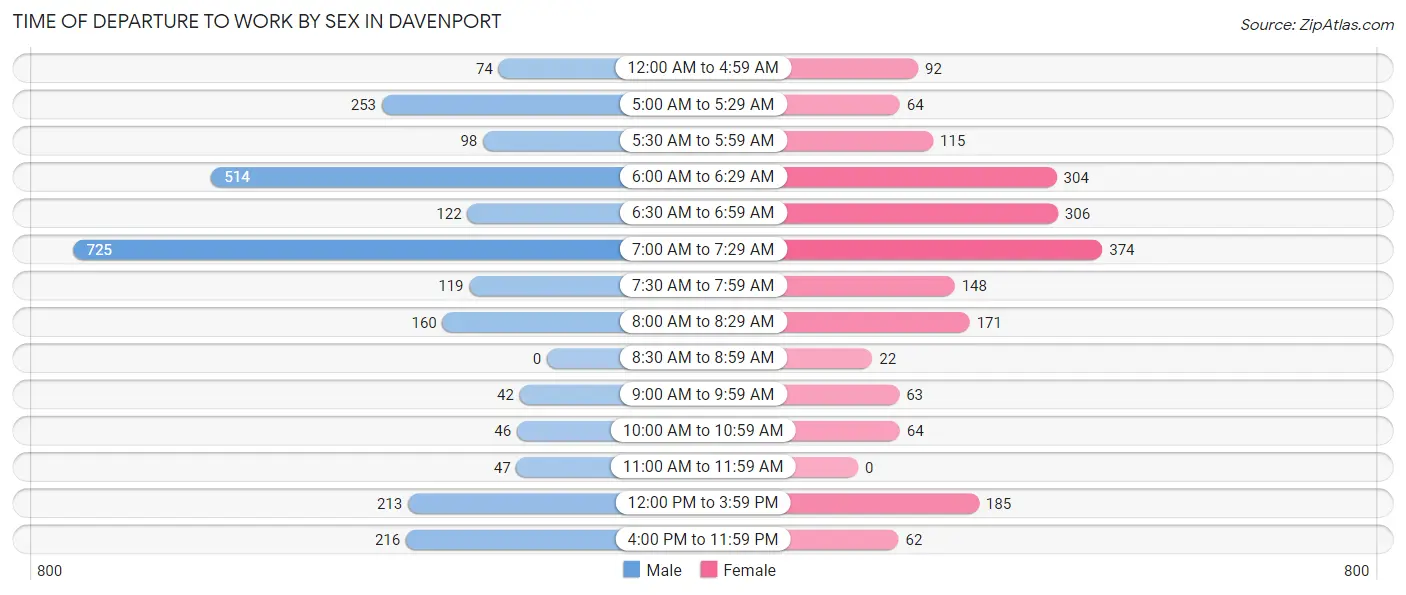
| Time of Departure | Male | Female |
| 12:00 AM to 4:59 AM | 74 (2.8%) | 92 (4.7%) |
| 5:00 AM to 5:29 AM | 253 (9.6%) | 64 (3.3%) |
| 5:30 AM to 5:59 AM | 98 (3.7%) | 115 (5.8%) |
| 6:00 AM to 6:29 AM | 514 (19.6%) | 304 (15.4%) |
| 6:30 AM to 6:59 AM | 122 (4.6%) | 306 (15.5%) |
| 7:00 AM to 7:29 AM | 725 (27.6%) | 374 (19.0%) |
| 7:30 AM to 7:59 AM | 119 (4.5%) | 148 (7.5%) |
| 8:00 AM to 8:29 AM | 160 (6.1%) | 171 (8.7%) |
| 8:30 AM to 8:59 AM | 0 (0.0%) | 22 (1.1%) |
| 9:00 AM to 9:59 AM | 42 (1.6%) | 63 (3.2%) |
| 10:00 AM to 10:59 AM | 46 (1.8%) | 64 (3.3%) |
| 11:00 AM to 11:59 AM | 47 (1.8%) | 0 (0.0%) |
| 12:00 PM to 3:59 PM | 213 (8.1%) | 185 (9.4%) |
| 4:00 PM to 11:59 PM | 216 (8.2%) | 62 (3.2%) |
| Total | 2,629 (100.0%) | 1,970 (100.0%) |
Housing Occupancy in Davenport
Occupancy by Ownership in Davenport
Of the total 3,059 dwellings in Davenport, owner-occupied units account for 2,852 (93.2%), while renter-occupied units make up 207 (6.8%).
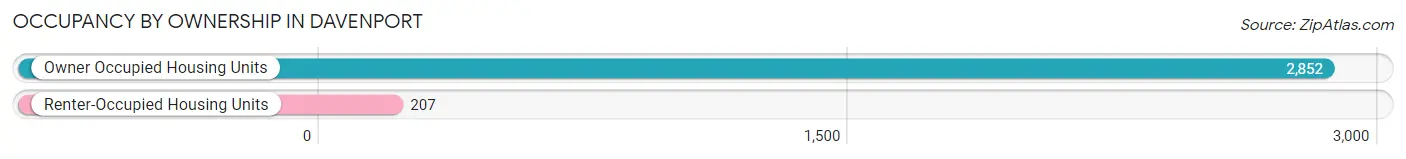
| Occupancy | # Housing Units | % Housing Units |
| Owner Occupied Housing Units | 2,852 | 93.2% |
| Renter-Occupied Housing Units | 207 | 6.8% |
| Total Occupied Housing Units | 3,059 | 100.0% |
Occupancy by Household Size in Davenport
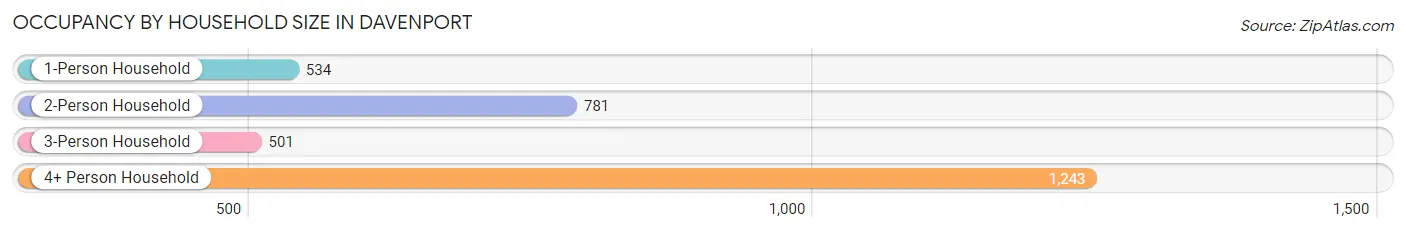
| Household Size | # Housing Units | % Housing Units |
| 1-Person Household | 534 | 17.5% |
| 2-Person Household | 781 | 25.5% |
| 3-Person Household | 501 | 16.4% |
| 4+ Person Household | 1,243 | 40.6% |
| Total Housing Units | 3,059 | 100.0% |
Occupancy by Ownership by Household Size in Davenport
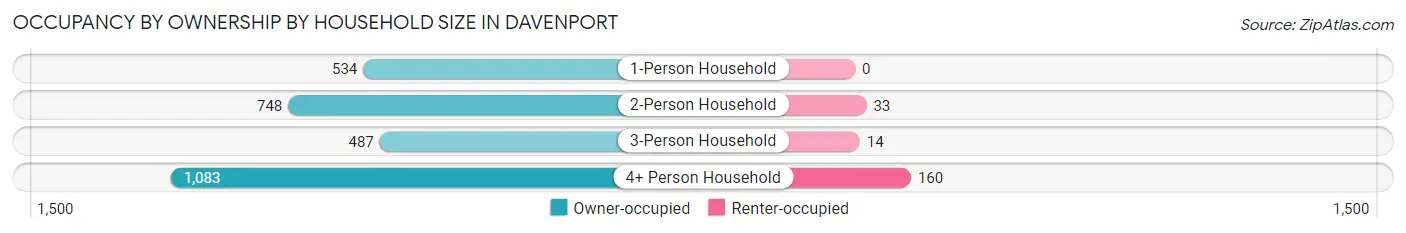
| Household Size | Owner-occupied | Renter-occupied |
| 1-Person Household | 534 (100.0%) | 0 (0.0%) |
| 2-Person Household | 748 (95.8%) | 33 (4.2%) |
| 3-Person Household | 487 (97.2%) | 14 (2.8%) |
| 4+ Person Household | 1,083 (87.1%) | 160 (12.9%) |
| Total Housing Units | 2,852 (93.2%) | 207 (6.8%) |
Occupancy by Educational Attainment in Davenport
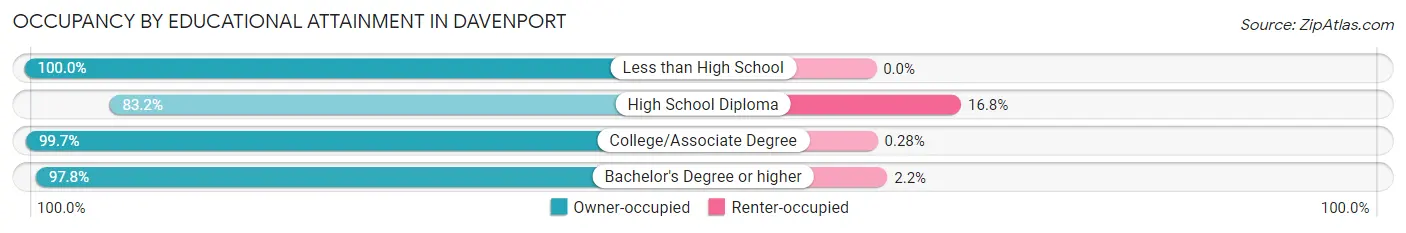
| Household Size | Owner-occupied | Renter-occupied |
| Less than High School | 229 (100.0%) | 0 (0.0%) |
| High School Diploma | 938 (83.2%) | 190 (16.8%) |
| College/Associate Degree | 1,067 (99.7%) | 3 (0.3%) |
| Bachelor's Degree or higher | 618 (97.8%) | 14 (2.2%) |
Occupancy by Age of Householder in Davenport
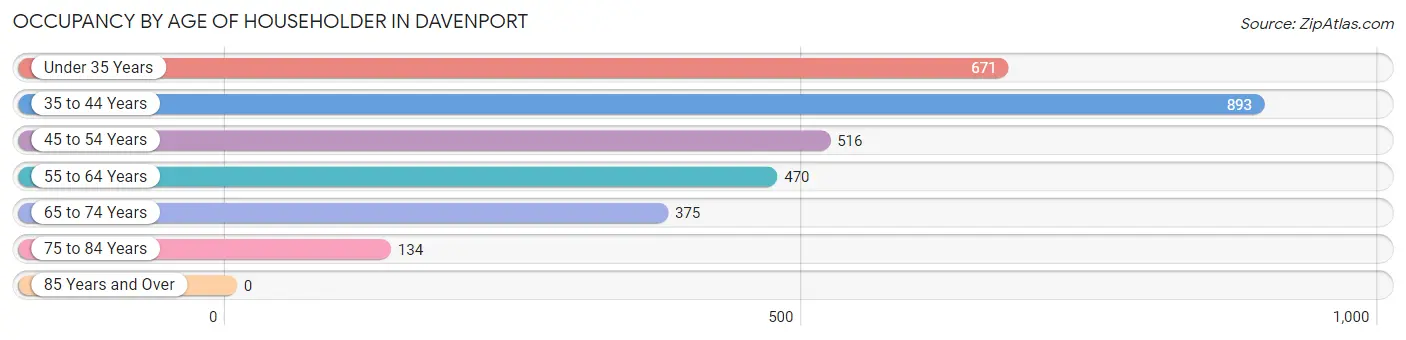
| Age Bracket | # Households | % Households |
| Under 35 Years | 671 | 21.9% |
| 35 to 44 Years | 893 | 29.2% |
| 45 to 54 Years | 516 | 16.9% |
| 55 to 64 Years | 470 | 15.4% |
| 65 to 74 Years | 375 | 12.3% |
| 75 to 84 Years | 134 | 4.4% |
| 85 Years and Over | 0 | 0.0% |
| Total | 3,059 | 100.0% |
Housing Finances in Davenport
Median Income by Occupancy in Davenport
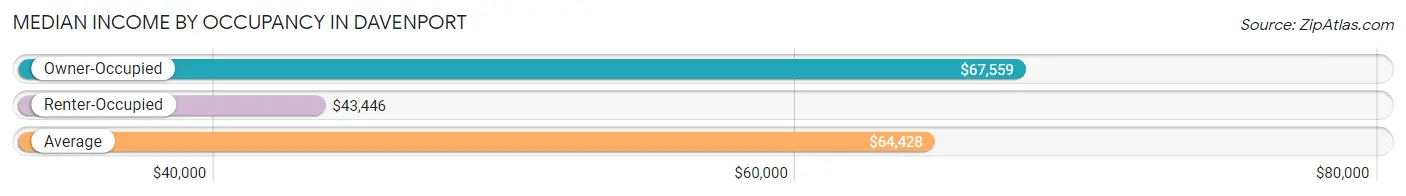
| Occupancy Type | # Households | Median Income |
| Owner-Occupied | 2,852 (93.2%) | $67,559 |
| Renter-Occupied | 207 (6.8%) | $43,446 |
| Average | 3,059 (100.0%) | $64,428 |
Occupancy by Householder Income Bracket in Davenport
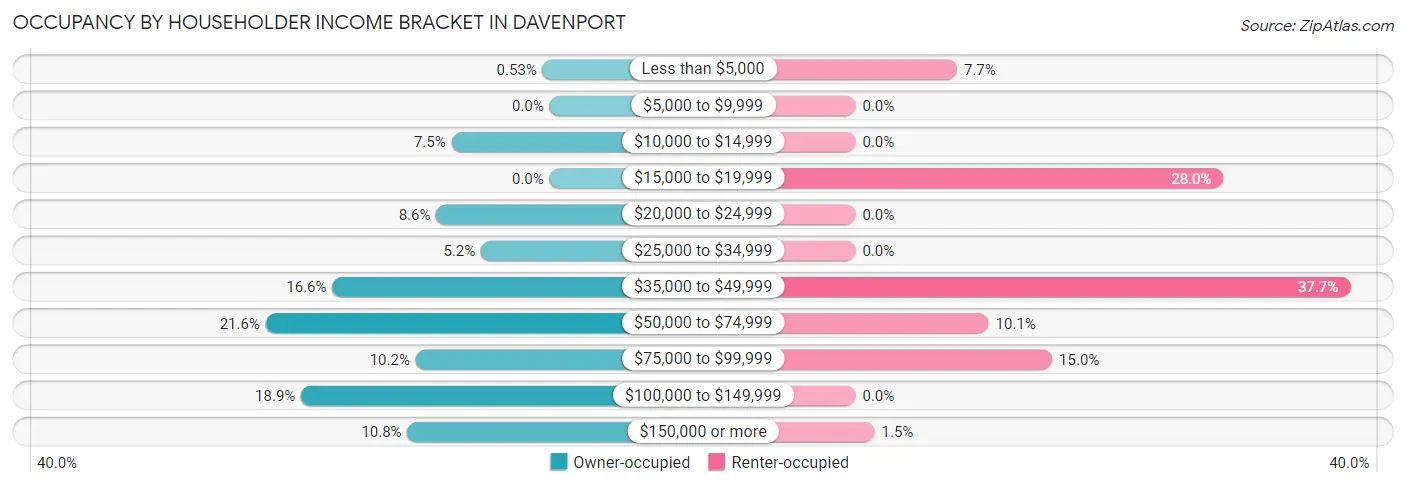
| Income Bracket | Owner-occupied | Renter-occupied |
| Less than $5,000 | 15 (0.5%) | 16 (7.7%) |
| $5,000 to $9,999 | 0 (0.0%) | 0 (0.0%) |
| $10,000 to $14,999 | 213 (7.5%) | 0 (0.0%) |
| $15,000 to $19,999 | 0 (0.0%) | 58 (28.0%) |
| $20,000 to $24,999 | 246 (8.6%) | 0 (0.0%) |
| $25,000 to $34,999 | 149 (5.2%) | 0 (0.0%) |
| $35,000 to $49,999 | 472 (16.6%) | 78 (37.7%) |
| $50,000 to $74,999 | 617 (21.6%) | 21 (10.1%) |
| $75,000 to $99,999 | 291 (10.2%) | 31 (15.0%) |
| $100,000 to $149,999 | 540 (18.9%) | 0 (0.0%) |
| $150,000 or more | 309 (10.8%) | 3 (1.5%) |
| Total | 2,852 (100.0%) | 207 (100.0%) |
Monthly Housing Cost Tiers in Davenport
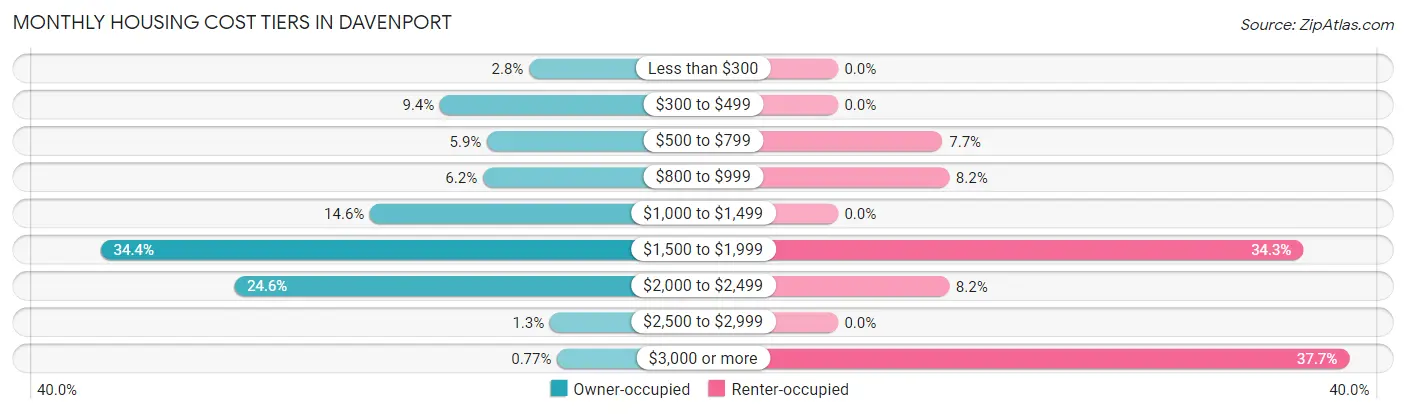
| Monthly Cost | Owner-occupied | Renter-occupied |
| Less than $300 | 81 (2.8%) | 0 (0.0%) |
| $300 to $499 | 268 (9.4%) | 0 (0.0%) |
| $500 to $799 | 169 (5.9%) | 16 (7.7%) |
| $800 to $999 | 178 (6.2%) | 17 (8.2%) |
| $1,000 to $1,499 | 415 (14.5%) | 0 (0.0%) |
| $1,500 to $1,999 | 981 (34.4%) | 71 (34.3%) |
| $2,000 to $2,499 | 701 (24.6%) | 17 (8.2%) |
| $2,500 to $2,999 | 37 (1.3%) | 0 (0.0%) |
| $3,000 or more | 22 (0.8%) | 78 (37.7%) |
| Total | 2,852 (100.0%) | 207 (100.0%) |
Physical Housing Characteristics in Davenport
Housing Structures in Davenport
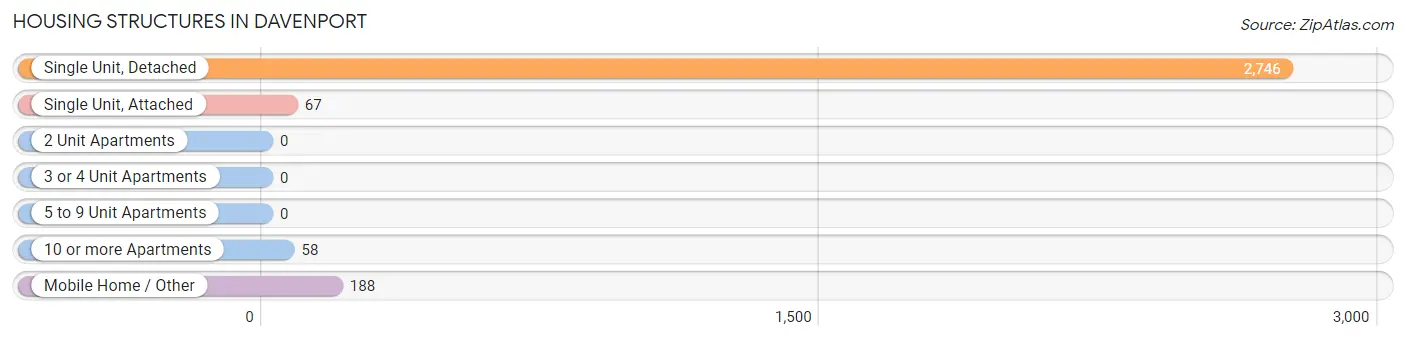
| Structure Type | # Housing Units | % Housing Units |
| Single Unit, Detached | 2,746 | 89.8% |
| Single Unit, Attached | 67 | 2.2% |
| 2 Unit Apartments | 0 | 0.0% |
| 3 or 4 Unit Apartments | 0 | 0.0% |
| 5 to 9 Unit Apartments | 0 | 0.0% |
| 10 or more Apartments | 58 | 1.9% |
| Mobile Home / Other | 188 | 6.1% |
| Total | 3,059 | 100.0% |
Housing Structures by Occupancy in Davenport
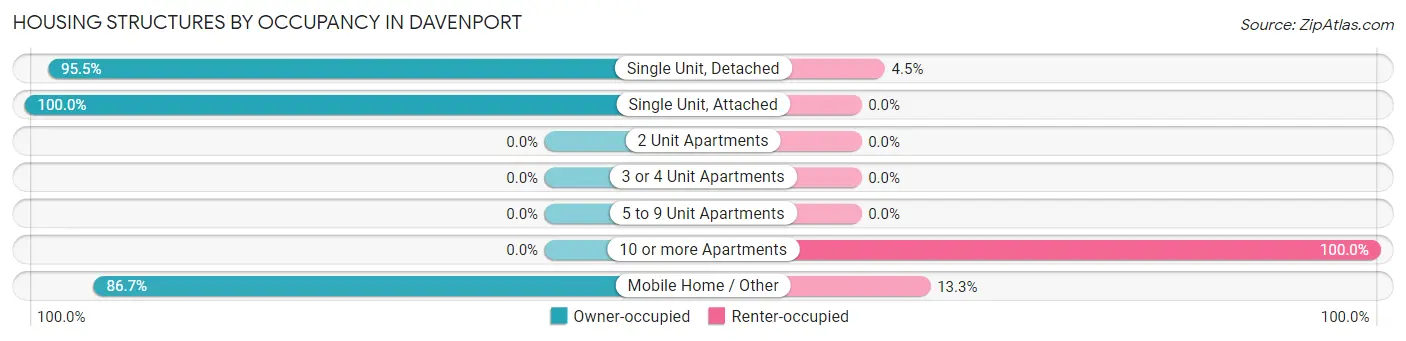
| Structure Type | Owner-occupied | Renter-occupied |
| Single Unit, Detached | 2,622 (95.5%) | 124 (4.5%) |
| Single Unit, Attached | 67 (100.0%) | 0 (0.0%) |
| 2 Unit Apartments | 0 (0.0%) | 0 (0.0%) |
| 3 or 4 Unit Apartments | 0 (0.0%) | 0 (0.0%) |
| 5 to 9 Unit Apartments | 0 (0.0%) | 0 (0.0%) |
| 10 or more Apartments | 0 (0.0%) | 58 (100.0%) |
| Mobile Home / Other | 163 (86.7%) | 25 (13.3%) |
| Total | 2,852 (93.2%) | 207 (6.8%) |
Housing Structures by Number of Rooms in Davenport
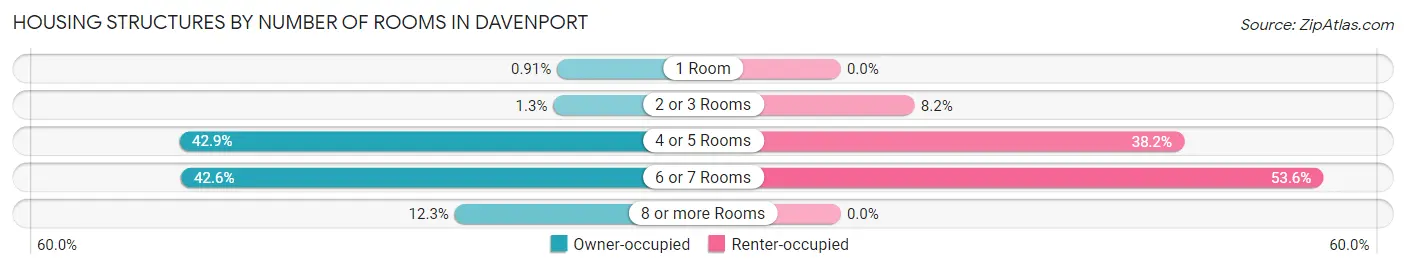
| Number of Rooms | Owner-occupied | Renter-occupied |
| 1 Room | 26 (0.9%) | 0 (0.0%) |
| 2 or 3 Rooms | 38 (1.3%) | 17 (8.2%) |
| 4 or 5 Rooms | 1,222 (42.8%) | 79 (38.2%) |
| 6 or 7 Rooms | 1,216 (42.6%) | 111 (53.6%) |
| 8 or more Rooms | 350 (12.3%) | 0 (0.0%) |
| Total | 2,852 (100.0%) | 207 (100.0%) |
Housing Structure by Heating Type in Davenport
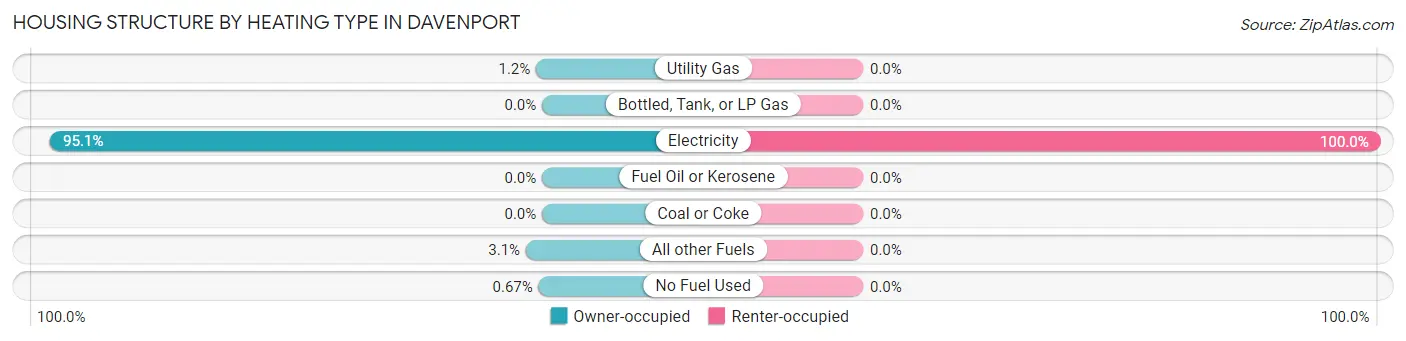
| Heating Type | Owner-occupied | Renter-occupied |
| Utility Gas | 33 (1.2%) | 0 (0.0%) |
| Bottled, Tank, or LP Gas | 0 (0.0%) | 0 (0.0%) |
| Electricity | 2,711 (95.1%) | 207 (100.0%) |
| Fuel Oil or Kerosene | 0 (0.0%) | 0 (0.0%) |
| Coal or Coke | 0 (0.0%) | 0 (0.0%) |
| All other Fuels | 89 (3.1%) | 0 (0.0%) |
| No Fuel Used | 19 (0.7%) | 0 (0.0%) |
| Total | 2,852 (100.0%) | 207 (100.0%) |
Household Vehicle Usage in Davenport
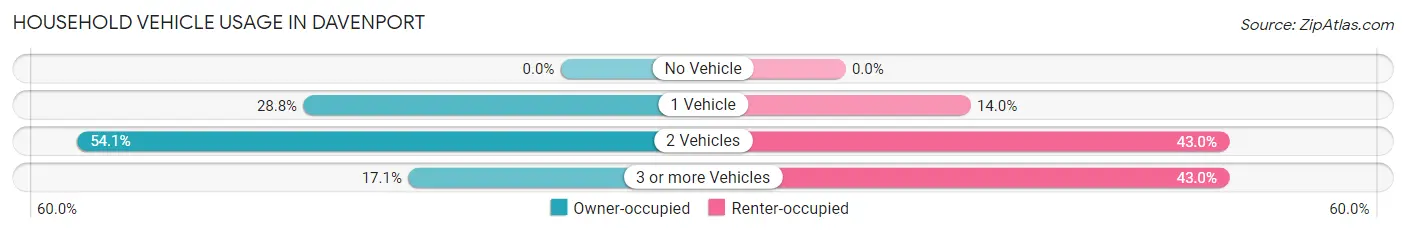
| Vehicles per Household | Owner-occupied | Renter-occupied |
| No Vehicle | 0 (0.0%) | 0 (0.0%) |
| 1 Vehicle | 822 (28.8%) | 29 (14.0%) |
| 2 Vehicles | 1,543 (54.1%) | 89 (43.0%) |
| 3 or more Vehicles | 487 (17.1%) | 89 (43.0%) |
| Total | 2,852 (100.0%) | 207 (100.0%) |
Real Estate & Mortgages in Davenport
Real Estate and Mortgage Overview in Davenport
| Characteristic | Without Mortgage | With Mortgage |
| Housing Units | 528 | 2,324 |
| Median Property Value | $262,000 | $283,200 |
| Median Household Income | $70,530 | $228 |
| Monthly Housing Costs | $491 | $22 |
| Real Estate Taxes | $1,587 | $128 |
Property Value by Mortgage Status in Davenport
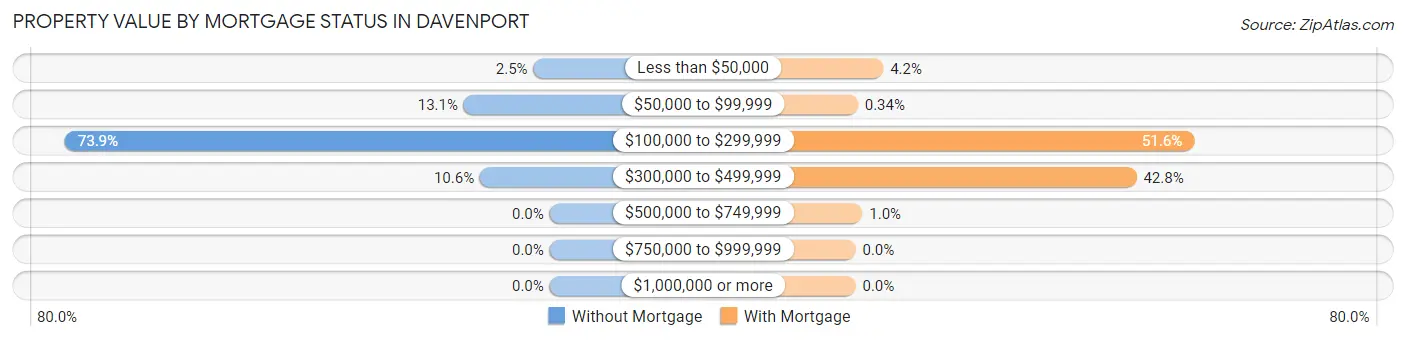
| Property Value | Without Mortgage | With Mortgage |
| Less than $50,000 | 13 (2.5%) | 98 (4.2%) |
| $50,000 to $99,999 | 69 (13.1%) | 8 (0.3%) |
| $100,000 to $299,999 | 390 (73.9%) | 1,199 (51.6%) |
| $300,000 to $499,999 | 56 (10.6%) | 995 (42.8%) |
| $500,000 to $749,999 | 0 (0.0%) | 24 (1.0%) |
| $750,000 to $999,999 | 0 (0.0%) | 0 (0.0%) |
| $1,000,000 or more | 0 (0.0%) | 0 (0.0%) |
| Total | 528 (100.0%) | 2,324 (100.0%) |
Household Income by Mortgage Status in Davenport
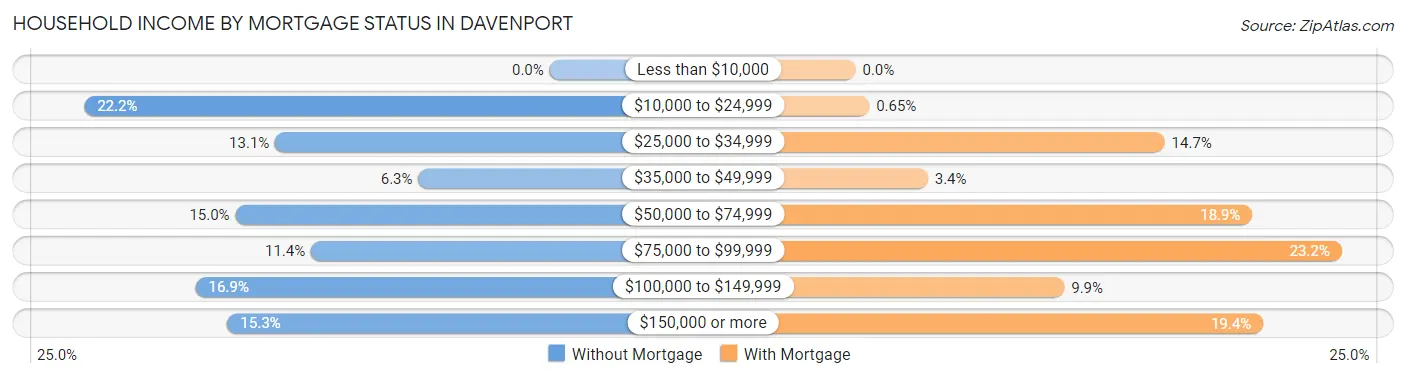
| Household Income | Without Mortgage | With Mortgage |
| Less than $10,000 | 0 (0.0%) | 0 (0.0%) |
| $10,000 to $24,999 | 117 (22.2%) | 15 (0.6%) |
| $25,000 to $34,999 | 69 (13.1%) | 342 (14.7%) |
| $35,000 to $49,999 | 33 (6.2%) | 80 (3.4%) |
| $50,000 to $74,999 | 79 (15.0%) | 439 (18.9%) |
| $75,000 to $99,999 | 60 (11.4%) | 538 (23.2%) |
| $100,000 to $149,999 | 89 (16.9%) | 231 (9.9%) |
| $150,000 or more | 81 (15.3%) | 451 (19.4%) |
| Total | 528 (100.0%) | 2,324 (100.0%) |
Property Value to Household Income Ratio in Davenport
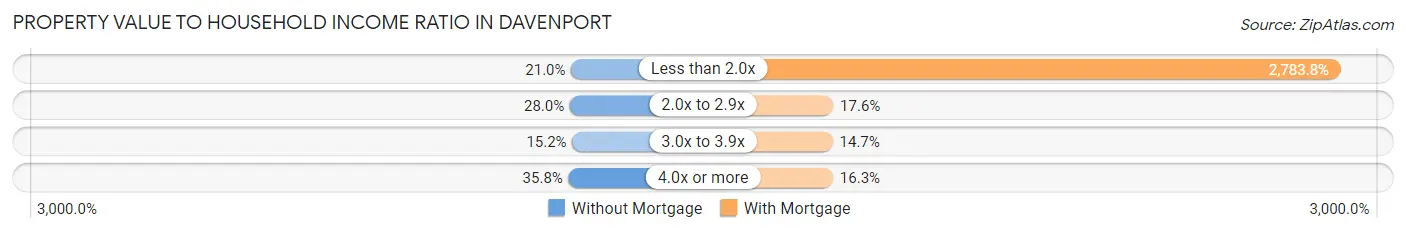
| Value-to-Income Ratio | Without Mortgage | With Mortgage |
| Less than 2.0x | 111 (21.0%) | 64,696 (2,783.8%) |
| 2.0x to 2.9x | 148 (28.0%) | 410 (17.6%) |
| 3.0x to 3.9x | 80 (15.1%) | 341 (14.7%) |
| 4.0x or more | 189 (35.8%) | 378 (16.3%) |
| Total | 528 (100.0%) | 2,324 (100.0%) |
Real Estate Taxes by Mortgage Status in Davenport
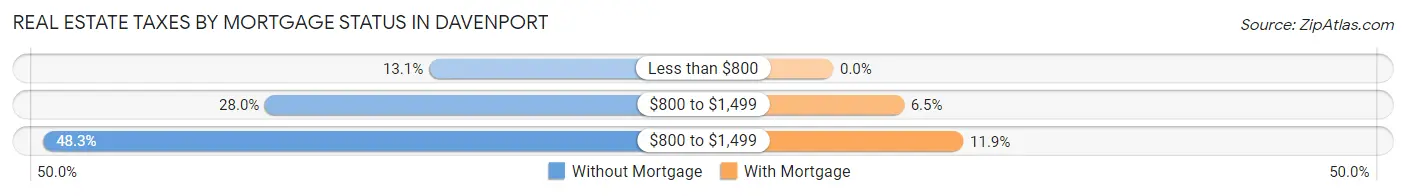
| Property Taxes | Without Mortgage | With Mortgage |
| Less than $800 | 69 (13.1%) | 0 (0.0%) |
| $800 to $1,499 | 148 (28.0%) | 150 (6.5%) |
| $800 to $1,499 | 255 (48.3%) | 276 (11.9%) |
| Total | 528 (100.0%) | 2,324 (100.0%) |
Health & Disability in Davenport
Health Insurance Coverage by Age in Davenport
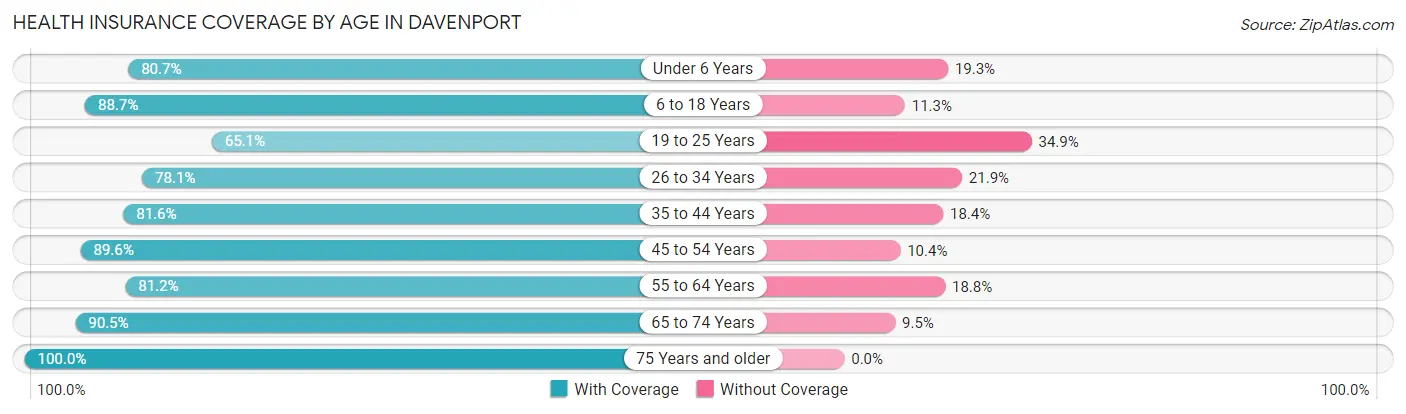
| Age Bracket | With Coverage | Without Coverage |
| Under 6 Years | 814 (80.7%) | 195 (19.3%) |
| 6 to 18 Years | 1,595 (88.7%) | 203 (11.3%) |
| 19 to 25 Years | 740 (65.1%) | 397 (34.9%) |
| 26 to 34 Years | 876 (78.1%) | 246 (21.9%) |
| 35 to 44 Years | 1,697 (81.6%) | 383 (18.4%) |
| 45 to 54 Years | 1,056 (89.6%) | 123 (10.4%) |
| 55 to 64 Years | 709 (81.2%) | 164 (18.8%) |
| 65 to 74 Years | 564 (90.5%) | 59 (9.5%) |
| 75 Years and older | 361 (100.0%) | 0 (0.0%) |
| Total | 8,412 (82.6%) | 1,770 (17.4%) |
Health Insurance Coverage by Citizenship Status in Davenport
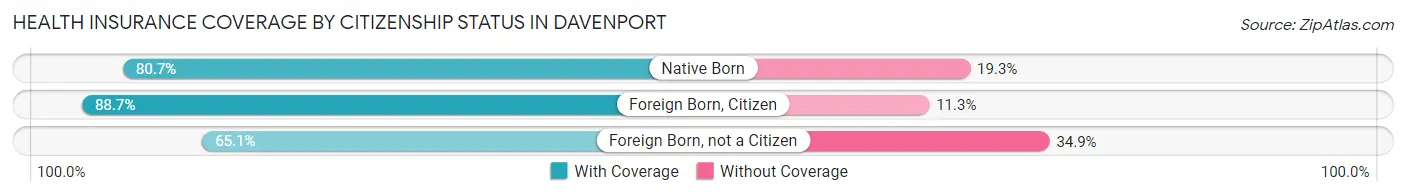
| Citizenship Status | With Coverage | Without Coverage |
| Native Born | 814 (80.7%) | 195 (19.3%) |
| Foreign Born, Citizen | 1,595 (88.7%) | 203 (11.3%) |
| Foreign Born, not a Citizen | 740 (65.1%) | 397 (34.9%) |
Health Insurance Coverage by Household Income in Davenport
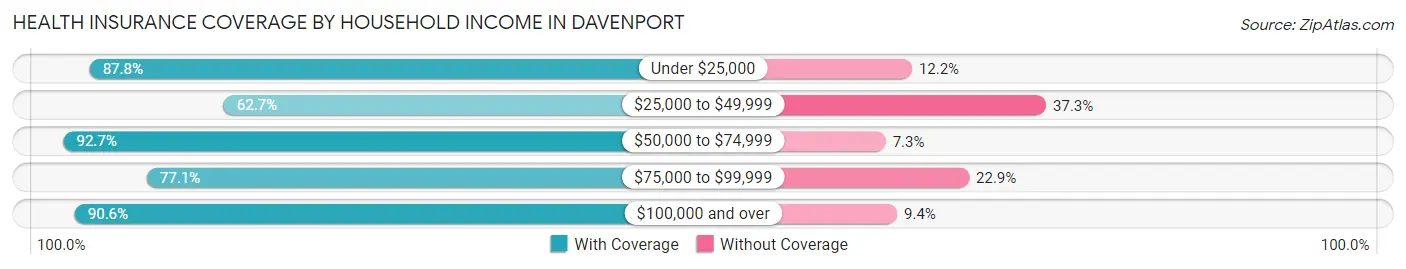
| Household Income | With Coverage | Without Coverage |
| Under $25,000 | 870 (87.8%) | 121 (12.2%) |
| $25,000 to $49,999 | 1,480 (62.7%) | 882 (37.3%) |
| $50,000 to $74,999 | 1,955 (92.7%) | 154 (7.3%) |
| $75,000 to $99,999 | 962 (77.1%) | 286 (22.9%) |
| $100,000 and over | 3,145 (90.6%) | 327 (9.4%) |
Public vs Private Health Insurance Coverage by Age in Davenport
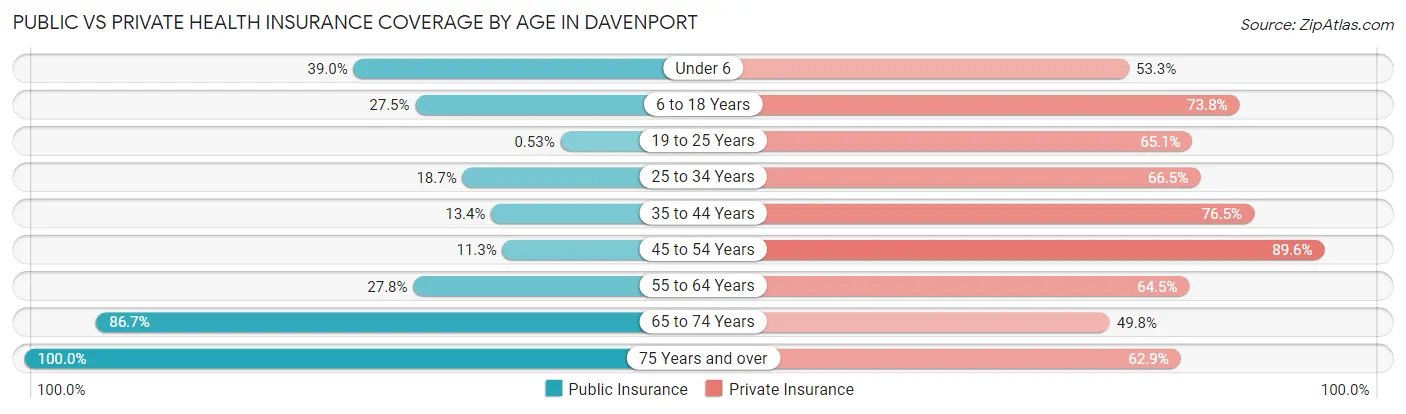
| Age Bracket | Public Insurance | Private Insurance |
| Under 6 | 393 (39.0%) | 538 (53.3%) |
| 6 to 18 Years | 494 (27.5%) | 1,327 (73.8%) |
| 19 to 25 Years | 6 (0.5%) | 740 (65.1%) |
| 25 to 34 Years | 210 (18.7%) | 746 (66.5%) |
| 35 to 44 Years | 278 (13.4%) | 1,591 (76.5%) |
| 45 to 54 Years | 133 (11.3%) | 1,056 (89.6%) |
| 55 to 64 Years | 243 (27.8%) | 563 (64.5%) |
| 65 to 74 Years | 540 (86.7%) | 310 (49.8%) |
| 75 Years and over | 361 (100.0%) | 227 (62.9%) |
| Total | 2,658 (26.1%) | 7,098 (69.7%) |
Disability Status by Sex by Age in Davenport
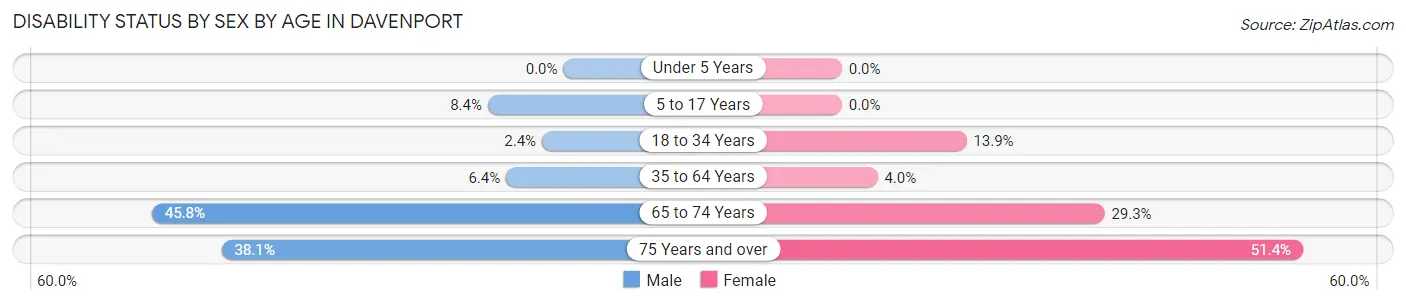
| Age Bracket | Male | Female |
| Under 5 Years | 0 (0.0%) | 0 (0.0%) |
| 5 to 17 Years | 91 (8.4%) | 0 (0.0%) |
| 18 to 34 Years | 26 (2.4%) | 166 (13.9%) |
| 35 to 64 Years | 135 (6.4%) | 80 (4.0%) |
| 65 to 74 Years | 132 (45.8%) | 98 (29.2%) |
| 75 Years and over | 67 (38.1%) | 95 (51.3%) |
Disability Class by Sex by Age in Davenport
Disability Class: Hearing Difficulty
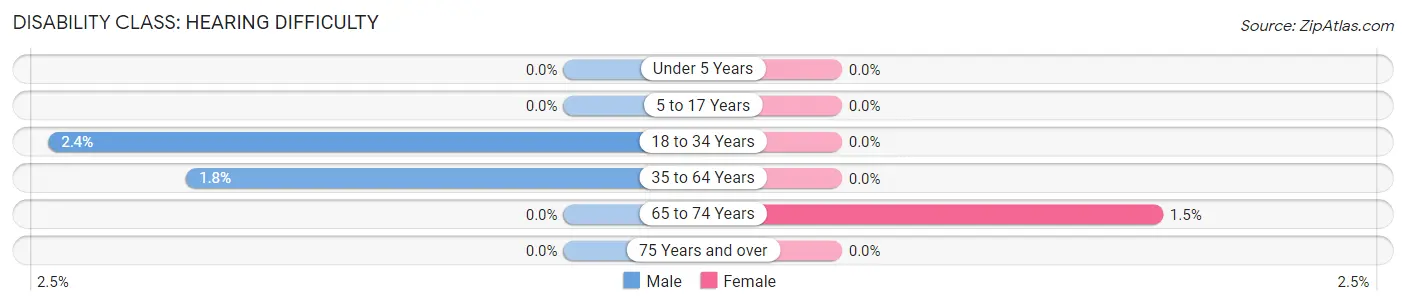
| Age Bracket | Male | Female |
| Under 5 Years | 0 (0.0%) | 0 (0.0%) |
| 5 to 17 Years | 0 (0.0%) | 0 (0.0%) |
| 18 to 34 Years | 26 (2.4%) | 0 (0.0%) |
| 35 to 64 Years | 37 (1.8%) | 0 (0.0%) |
| 65 to 74 Years | 0 (0.0%) | 5 (1.5%) |
| 75 Years and over | 0 (0.0%) | 0 (0.0%) |
Disability Class: Vision Difficulty
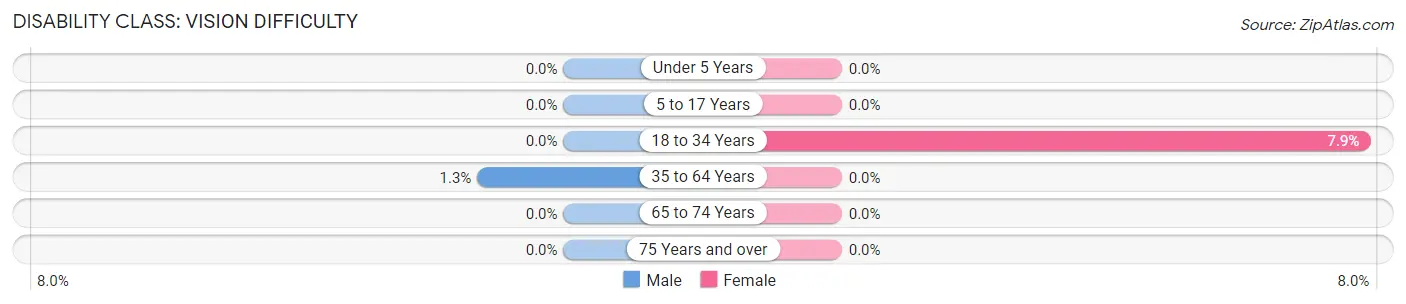
| Age Bracket | Male | Female |
| Under 5 Years | 0 (0.0%) | 0 (0.0%) |
| 5 to 17 Years | 0 (0.0%) | 0 (0.0%) |
| 18 to 34 Years | 0 (0.0%) | 94 (7.9%) |
| 35 to 64 Years | 27 (1.3%) | 0 (0.0%) |
| 65 to 74 Years | 0 (0.0%) | 0 (0.0%) |
| 75 Years and over | 0 (0.0%) | 0 (0.0%) |
Disability Class: Cognitive Difficulty
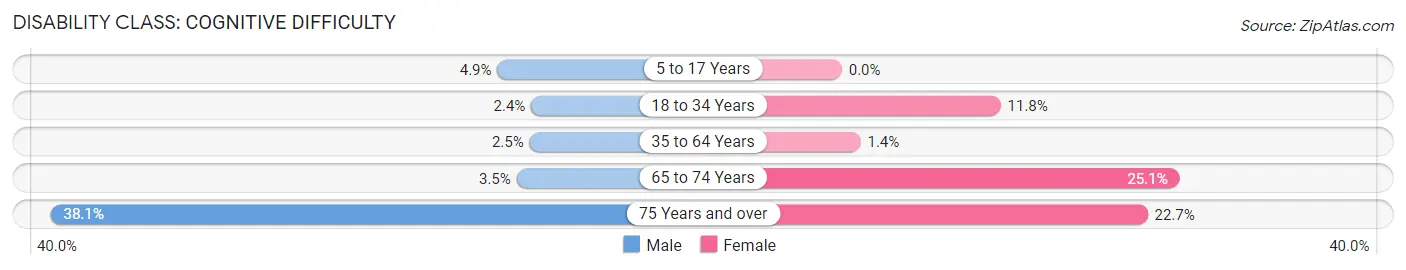
| Age Bracket | Male | Female |
| 5 to 17 Years | 53 (4.9%) | 0 (0.0%) |
| 18 to 34 Years | 26 (2.4%) | 141 (11.8%) |
| 35 to 64 Years | 53 (2.5%) | 28 (1.4%) |
| 65 to 74 Years | 10 (3.5%) | 84 (25.1%) |
| 75 Years and over | 67 (38.1%) | 42 (22.7%) |
Disability Class: Ambulatory Difficulty
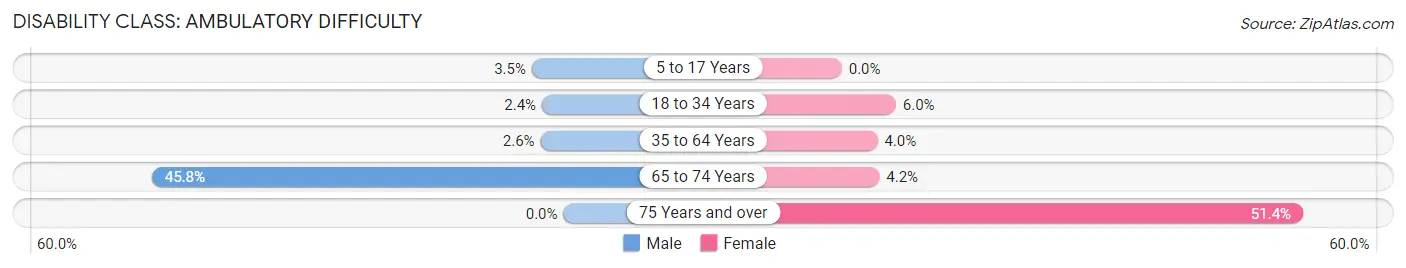
| Age Bracket | Male | Female |
| 5 to 17 Years | 38 (3.5%) | 0 (0.0%) |
| 18 to 34 Years | 26 (2.4%) | 72 (6.0%) |
| 35 to 64 Years | 54 (2.5%) | 80 (4.0%) |
| 65 to 74 Years | 132 (45.8%) | 14 (4.2%) |
| 75 Years and over | 0 (0.0%) | 95 (51.3%) |
Disability Class: Self-Care Difficulty
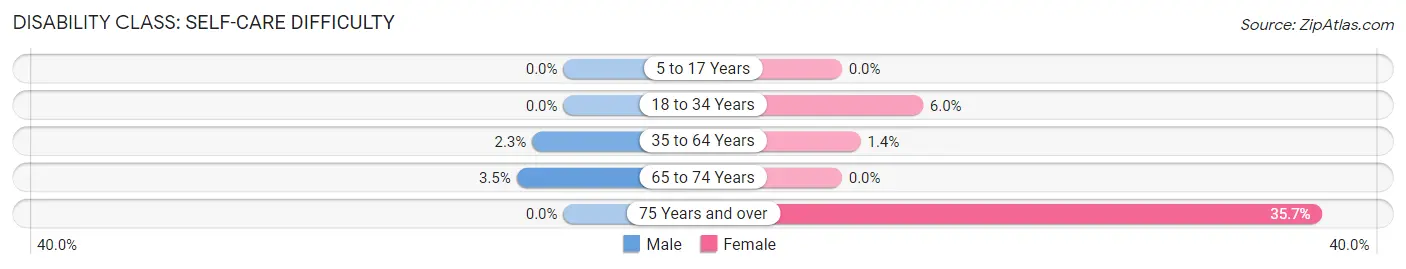
| Age Bracket | Male | Female |
| 5 to 17 Years | 0 (0.0%) | 0 (0.0%) |
| 18 to 34 Years | 0 (0.0%) | 72 (6.0%) |
| 35 to 64 Years | 49 (2.3%) | 28 (1.4%) |
| 65 to 74 Years | 10 (3.5%) | 0 (0.0%) |
| 75 Years and over | 0 (0.0%) | 66 (35.7%) |
Technology Access in Davenport
Computing Device Access in Davenport
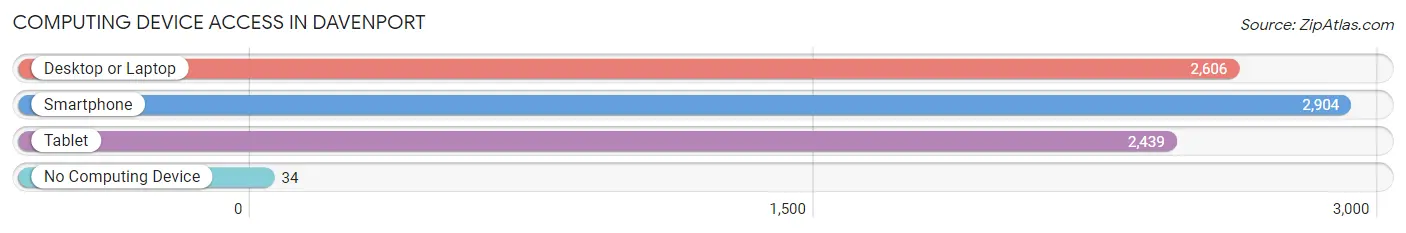
| Device Type | # Households | % Households |
| Desktop or Laptop | 2,606 | 85.2% |
| Smartphone | 2,904 | 94.9% |
| Tablet | 2,439 | 79.7% |
| No Computing Device | 34 | 1.1% |
| Total | 3,059 | 100.0% |
Internet Access in Davenport
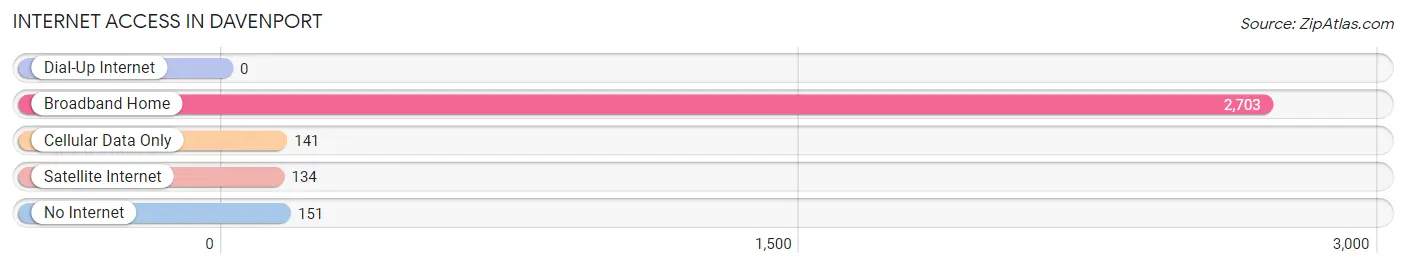
| Internet Type | # Households | % Households |
| Dial-Up Internet | 0 | 0.0% |
| Broadband Home | 2,703 | 88.4% |
| Cellular Data Only | 141 | 4.6% |
| Satellite Internet | 134 | 4.4% |
| No Internet | 151 | 4.9% |
| Total | 3,059 | 100.0% |
Davenport Summary
Davenport is a city located in Polk County, Florida, United States. The population was 2,888 at the 2010 census. It is part of the Lakeland–Winter Haven Metropolitan Statistical Area.
History
Davenport was founded in 1883 by Philip Davenport, a former Confederate soldier. He named the town after himself and it was incorporated in 1925. The city was originally a farming community, but it has since grown into a bedroom community for nearby cities such as Orlando and Tampa.
Geography
Davenport is located at 28°10'25" North, 81°37'45" West (28.173611, -81.629167). According to the United States Census Bureau, the city has a total area of 4.2 square miles (10.8 km2), all land.
Economy
Davenport’s economy is largely based on tourism and hospitality. The city is home to several resorts and hotels, as well as a variety of restaurants and shopping centers. The city is also home to several large employers, such as Walt Disney World, Universal Studios, and Legoland.
Demographics
As of the census of 2010, there were 2,888 people, 1,093 households, and 745 families residing in the city. The population density was 690.2 people per square mile (266.7/km2). There were 1,093 housing units at an average density of 261.3 per square mile (100.9/km2). The racial makeup of the city was 79.2% White, 11.2% African American, 0.3% Native American, 1.2% Asian, 0.1% Pacific Islander, 5.7% from other races, and 2.3% from two or more races. Hispanic or Latino of any race were 14.2% of the population.
There were 1,093 households, out of which 28.2% had children under the age of 18 living with them, 51.2% were married couples living together, 12.2% had a female householder with no husband present, and 31.7% were non-families. 25.2% of all households were made up of individuals, and 9.2% had someone living alone who was 65 years of age or older. The average household size was 2.64 and the average family size was 3.14.
In the city, the population was spread out, with 24.2% under the age of 18, 8.2% from 18 to 24, 28.2% from 25 to 44, 24.7% from 45 to 64, and 14.7% who were 65 years of age or older. The median age was 38 years. For every 100 females, there were 97.2 males. For every 100 females age 18 and over, there were 94.2 males.
The median income for a household in the city was $37,917, and the median income for a family was $45,000. Males had a median income of $30,938 versus $22,917 for females. The per capita income for the city was $18,945. About 8.2% of families and 11.2% of the population were below the poverty line, including 15.2% of those under age 18 and 8.2% of those age 65 or over.
Common Questions
What is Per Capita Income in Davenport?
Per Capita income in Davenport is $25,066.
What is the Median Family Income in Davenport?
Median Family Income in Davenport is $69,509.
What is the Median Household income in Davenport?
Median Household Income in Davenport is $64,428.
What is Income or Wage Gap in Davenport?
Income or Wage Gap in Davenport is 34.0%.
Women in Davenport earn 66.0 cents for every dollar earned by a man.
What is Inequality or Gini Index in Davenport?
Inequality or Gini Index in Davenport is 0.38.
What is the Total Population of Davenport?
Total Population of Davenport is 10,246.
What is the Total Male Population of Davenport?
Total Male Population of Davenport is 5,183.
What is the Total Female Population of Davenport?
Total Female Population of Davenport is 5,063.
What is the Ratio of Males per 100 Females in Davenport?
There are 102.37 Males per 100 Females in Davenport.
What is the Ratio of Females per 100 Males in Davenport?
There are 97.68 Females per 100 Males in Davenport.
What is the Median Population Age in Davenport?
Median Population Age in Davenport is 35.2 Years.
What is the Average Family Size in Davenport
Average Family Size in Davenport is 3.9 People.
What is the Average Household Size in Davenport
Average Household Size in Davenport is 3.3 People.
How Large is the Labor Force in Davenport?
There are 5,402 People in the Labor Forcein in Davenport.
What is the Percentage of People in the Labor Force in Davenport?
69.2% of People are in the Labor Force in Davenport.
What is the Unemployment Rate in Davenport?
Unemployment Rate in Davenport is 2.6%.