Zip Codes with the Highest Percentage of Population Employed in Administrative & Support Services in Crested Butte, CO
RELATED REPORTS & OPTIONS
Administrative & Support Services
Crested Butte
Compare Zip Codes
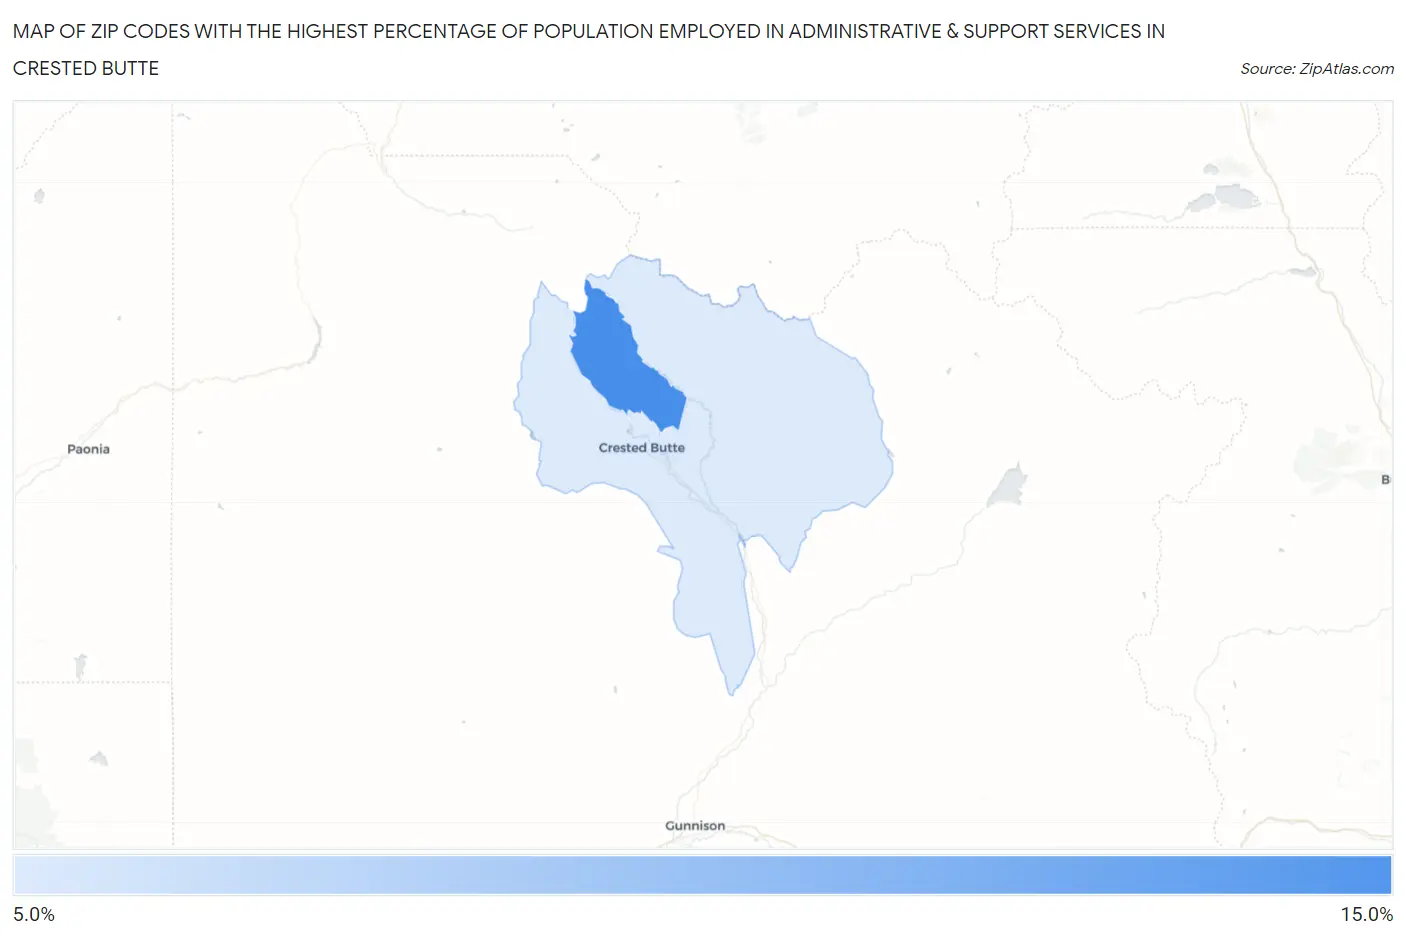
Map of Zip Codes with the Highest Percentage of Population Employed in Administrative & Support Services in Crested Butte
5.3%
10.5%
Zip Codes with the Highest Percentage of Population Employed in Administrative & Support Services in Crested Butte, CO
| Zip Code | % Employed | vs State | vs National | |
| 1. | 81225 | 10.5% | 4.1%(+6.37)#15 | 4.1%(+6.31)#1,164 |
| 2. | 81224 | 5.3% | 4.1%(+1.25)#93 | 4.1%(+1.19)#6,207 |
1
Common Questions
What are the Top Zip Codes with the Highest Percentage of Population Employed in Administrative & Support Services in Crested Butte, CO?
Top Zip Codes with the Highest Percentage of Population Employed in Administrative & Support Services in Crested Butte, CO are:
What zip code has the Highest Percentage of Population Employed in Administrative & Support Services in Crested Butte, CO?
81225 has the Highest Percentage of Population Employed in Administrative & Support Services in Crested Butte, CO with 10.5%.
What is the Percentage of Population Employed in Administrative & Support Services in Crested Butte, CO?
Percentage of Population Employed in Administrative & Support Services in Crested Butte is 4.2%.
What is the Percentage of Population Employed in Administrative & Support Services in Colorado?
Percentage of Population Employed in Administrative & Support Services in Colorado is 4.1%.
What is the Percentage of Population Employed in Administrative & Support Services in the United States?
Percentage of Population Employed in Administrative & Support Services in the United States is 4.1%.