Zip Codes with the Highest Percentage of Private Company Employees in Crested Butte, CO
RELATED REPORTS & OPTIONS
Private Company Employees
Crested Butte
Compare Zip Codes
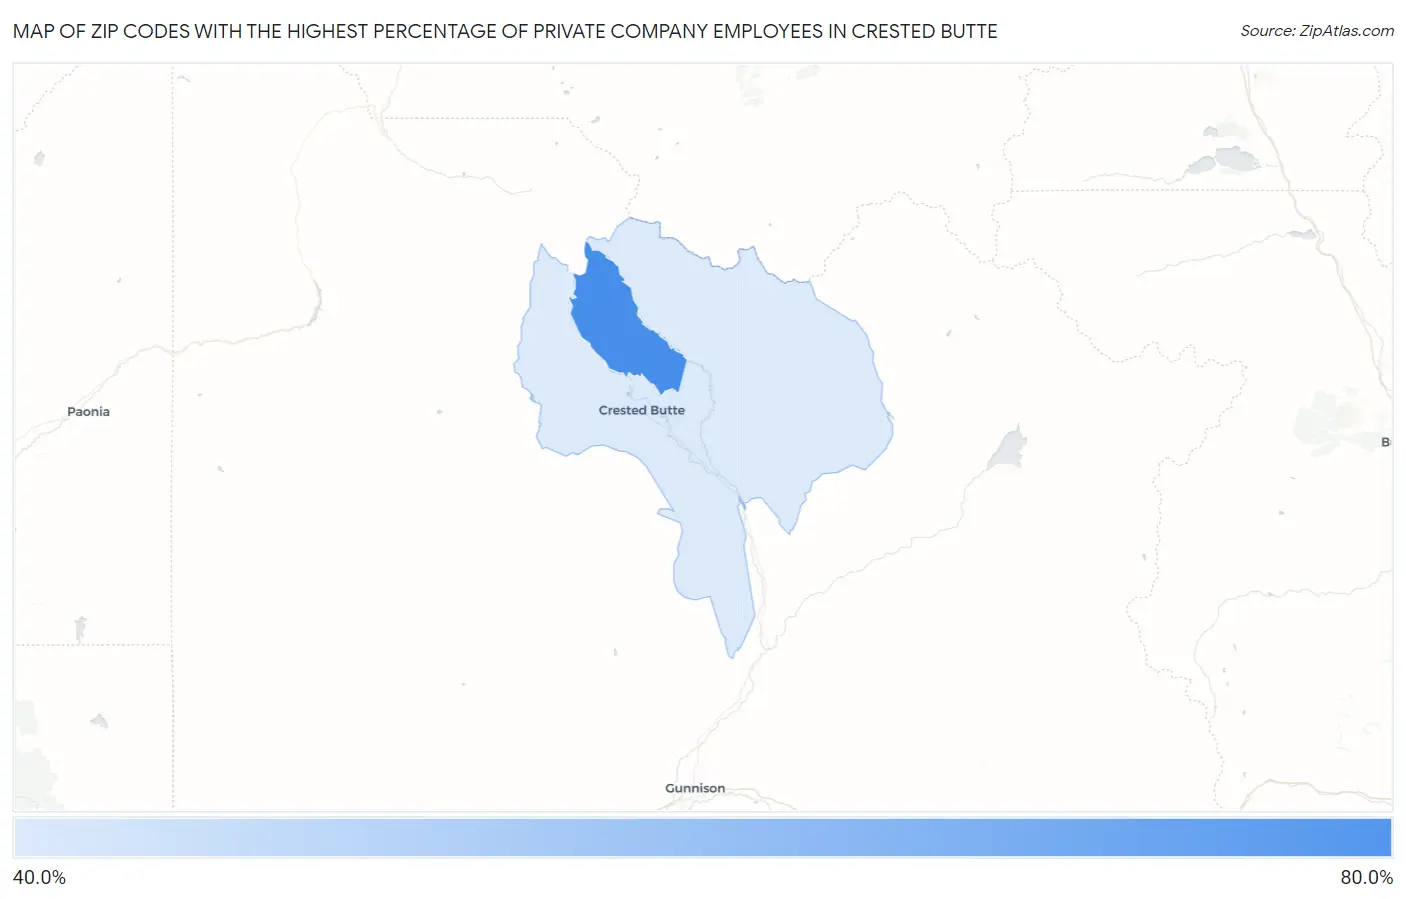
Map of Zip Codes with the Highest Percentage of Private Company Employees in Crested Butte
41.4%
72.5%
Zip Codes with the Highest Percentage of Private Company Employees in Crested Butte, CO
| Zip Code | % Private Company Employees | vs State | vs National | |
| 1. | 81225 | 72.5% | 65.7%(+6.80)#61 | 66.9%(+5.56)#7,337 |
| 2. | 81224 | 41.4% | 65.7%(-24.3)#443 | 66.9%(-25.5)#30,497 |
1
Common Questions
What are the Top Zip Codes with the Highest Percentage of Private Company Employees in Crested Butte, CO?
Top Zip Codes with the Highest Percentage of Private Company Employees in Crested Butte, CO are:
What zip code has the Highest Percentage of Private Company Employees in Crested Butte, CO?
81225 has the Highest Percentage of Private Company Employees in Crested Butte, CO with 72.5%.
What is the Percentage of Private Company Employees in Crested Butte, CO?
Percentage of Private Company Employees in Crested Butte is 51.4%.
What is the Percentage of Private Company Employees in Colorado?
Percentage of Private Company Employees in Colorado is 65.7%.
What is the Percentage of Private Company Employees in the United States?
Percentage of Private Company Employees in the United States is 66.9%.