Zip Codes with the Highest Percentage of Population Employed in Arts, Entertainment & Recreation in Castle Rock, CO
RELATED REPORTS & OPTIONS
Arts, Entertainment & Recreation
Castle Rock
Compare Zip Codes
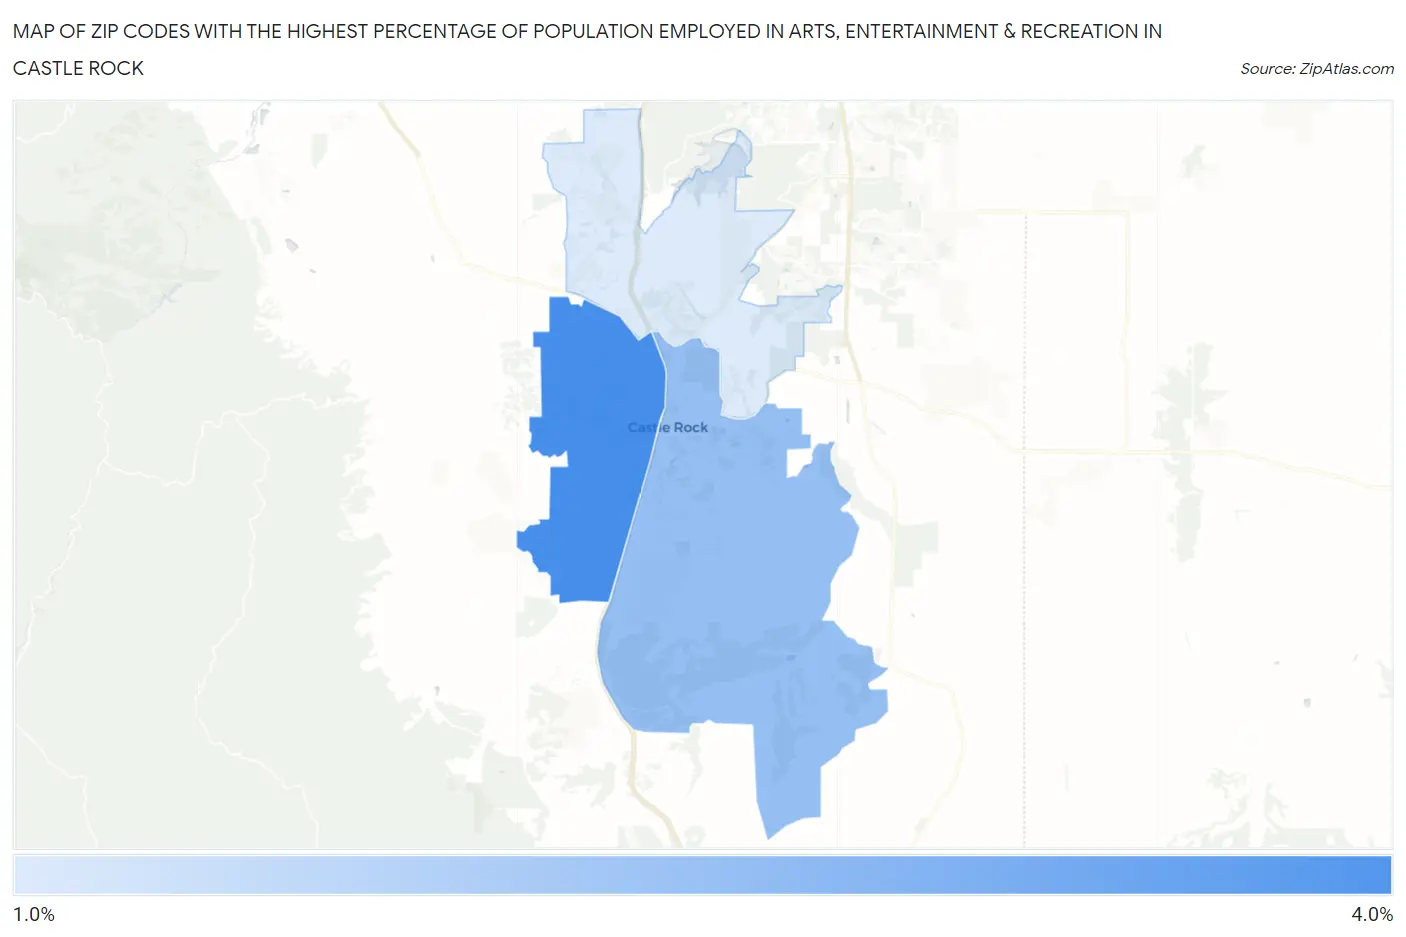
Map of Zip Codes with the Highest Percentage of Population Employed in Arts, Entertainment & Recreation in Castle Rock
1.7%
3.7%
Zip Codes with the Highest Percentage of Population Employed in Arts, Entertainment & Recreation in Castle Rock, CO
| Zip Code | % Employed | vs State | vs National | |
| 1. | 80109 | 3.7% | 2.6%(+1.17)#103 | 2.1%(+1.65)#3,726 |
| 2. | 80104 | 2.7% | 2.6%(+0.103)#165 | 2.1%(+0.591)#6,471 |
| 3. | 80108 | 1.7% | 2.6%(-0.881)#266 | 2.1%(-0.392)#11,815 |
1
Common Questions
What are the Top Zip Codes with the Highest Percentage of Population Employed in Arts, Entertainment & Recreation in Castle Rock, CO?
Top Zip Codes with the Highest Percentage of Population Employed in Arts, Entertainment & Recreation in Castle Rock, CO are:
What zip code has the Highest Percentage of Population Employed in Arts, Entertainment & Recreation in Castle Rock, CO?
80109 has the Highest Percentage of Population Employed in Arts, Entertainment & Recreation in Castle Rock, CO with 3.7%.
What is the Percentage of Population Employed in Arts, Entertainment & Recreation in Castle Rock, CO?
Percentage of Population Employed in Arts, Entertainment & Recreation in Castle Rock is 2.9%.
What is the Percentage of Population Employed in Arts, Entertainment & Recreation in Colorado?
Percentage of Population Employed in Arts, Entertainment & Recreation in Colorado is 2.6%.
What is the Percentage of Population Employed in Arts, Entertainment & Recreation in the United States?
Percentage of Population Employed in Arts, Entertainment & Recreation in the United States is 2.1%.