Zip Codes with the Highest Percentage of Households with Income Above $100,000 in Castle Rock, CO
RELATED REPORTS & OPTIONS
Household Income | $100k+
Castle Rock
Compare Zip Codes
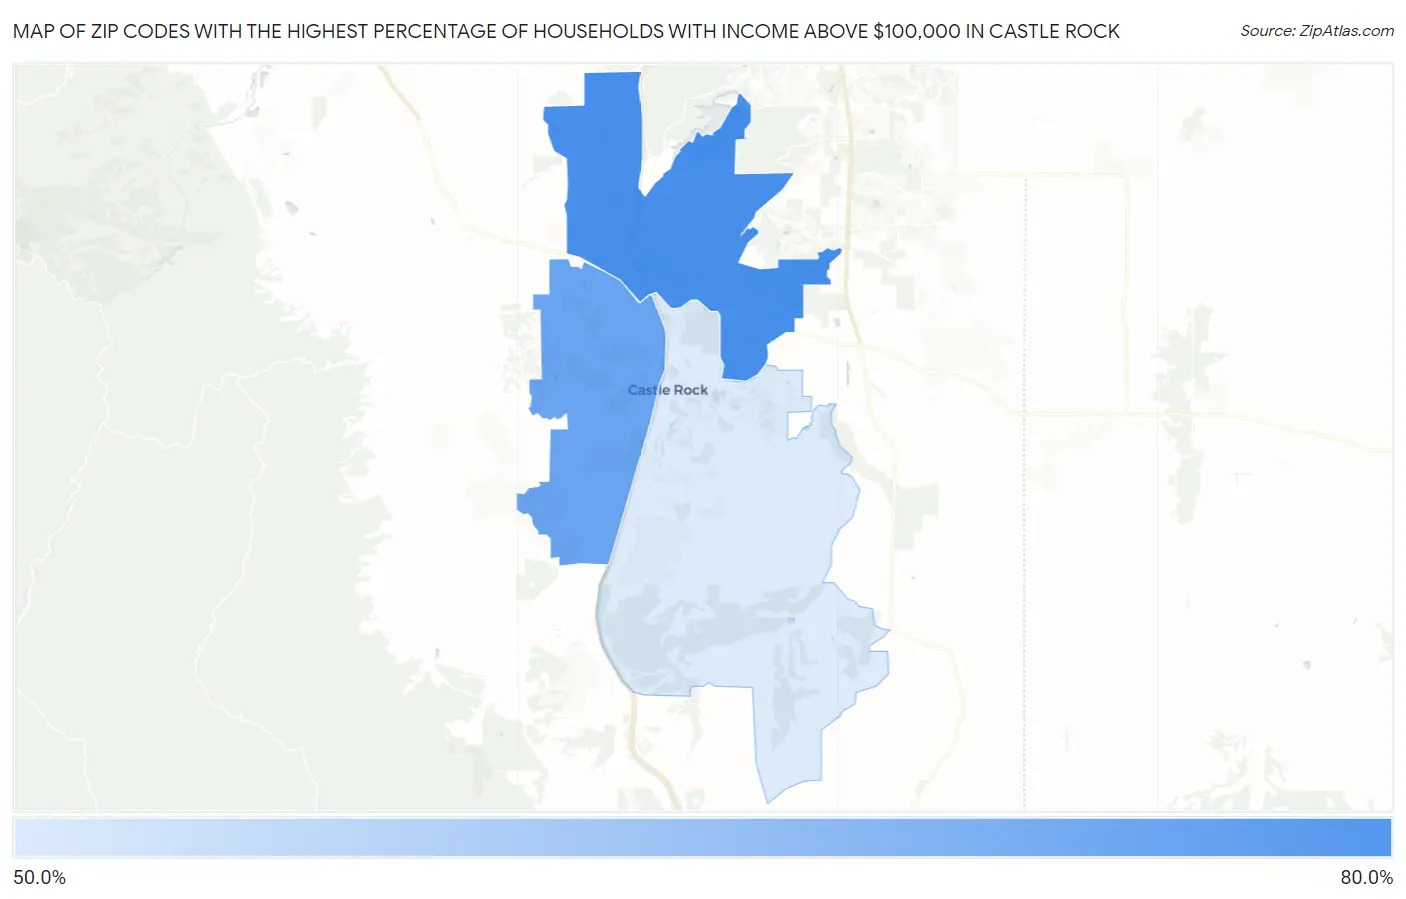
Map of Zip Codes with the Highest Percentage of Households with Income Above $100,000 in Castle Rock
60.0%
73.2%
Zip Codes with the Highest Percentage of Households with Income Above $100,000 in Castle Rock, CO
| Zip Code | Households with Income > $100k | vs State | vs National | |
| 1. | 80108 | 73.2% | 43.9%(+29.3)#14 | 37.3%(+35.9)#685 |
| 2. | 80109 | 70.0% | 43.9%(+26.1)#20 | 37.3%(+32.7)#965 |
| 3. | 80104 | 60.0% | 43.9%(+16.1)#55 | 37.3%(+22.7)#2,359 |
1
Common Questions
What are the Top Zip Codes with the Highest Percentage of Households with Income Above $100,000 in Castle Rock, CO?
Top Zip Codes with the Highest Percentage of Households with Income Above $100,000 in Castle Rock, CO are:
What zip code has the Highest Percentage of Households with Income Above $100,000 in Castle Rock, CO?
80108 has the Highest Percentage of Households with Income Above $100,000 in Castle Rock, CO with 73.2%.
What is the Percentage of Households with Income Above $100,000 in Castle Rock, CO?
Percentage of Households with Income Above $100,000 in Castle Rock is 64.4%.
What is the Percentage of Households with Income Above $100,000 in Colorado?
Percentage of Households with Income Above $100,000 in Colorado is 43.9%.
What is the Percentage of Households with Income Above $100,000 in the United States?
Percentage of Households with Income Above $100,000 in the United States is 37.3%.