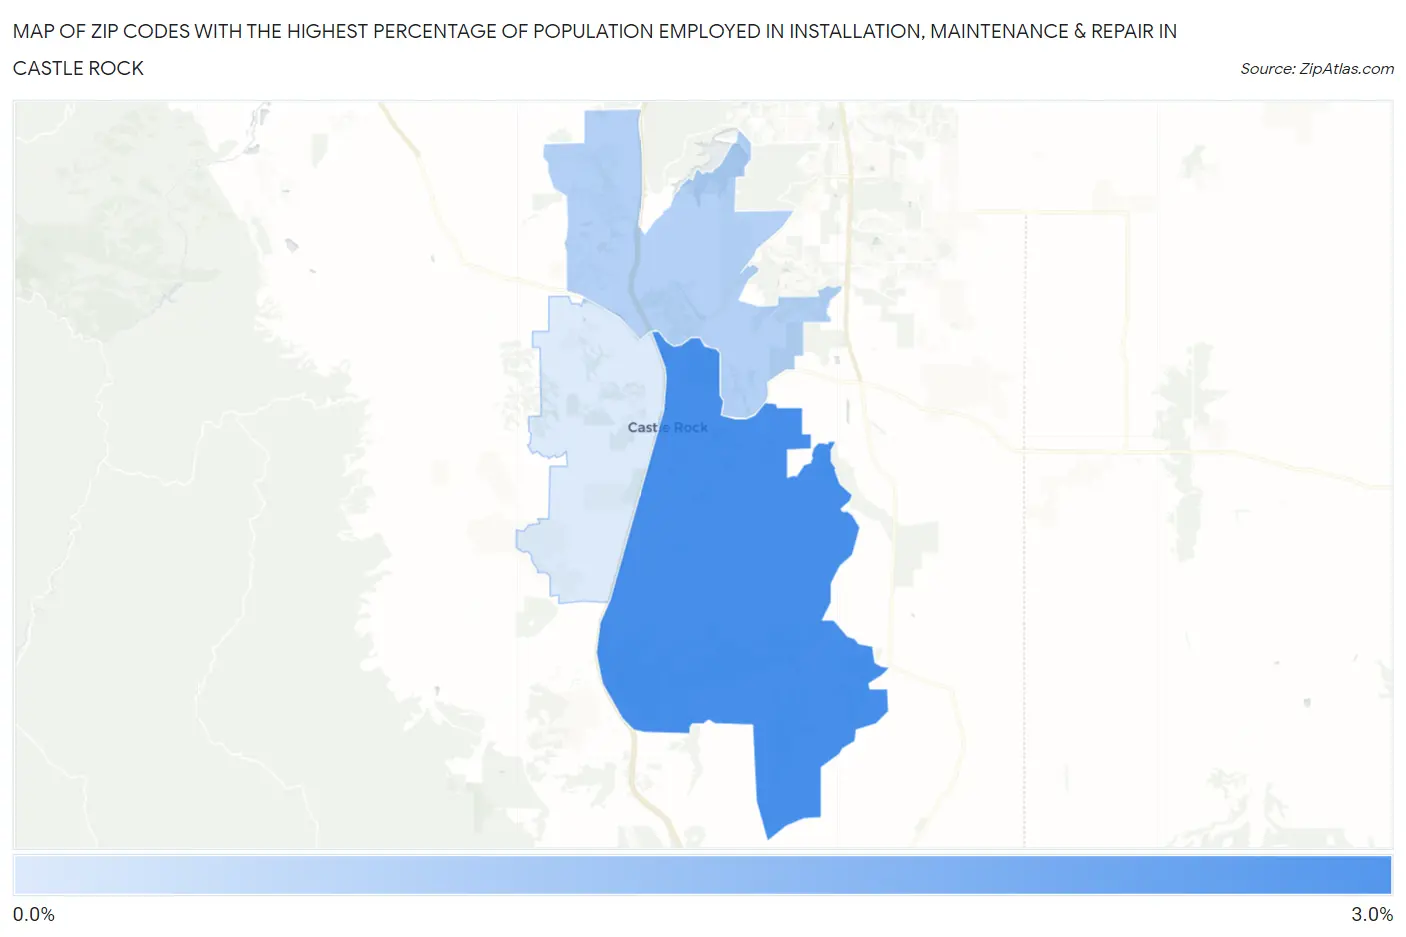
Zip Codes with the Highest Percentage of Population Employed in Installation, Maintenance & Repair in Castle Rock, CO
RELATED REPORTS & OPTIONS
Installation, Maintenance & Repair
Castle Rock
Compare Zip Codes
Map of Zip Codes with the Highest Percentage of Population Employed in Installation, Maintenance & Repair in Castle Rock
0.95%
2.5%
Zip Codes with the Highest Percentage of Population Employed in Installation, Maintenance & Repair in Castle Rock, CO
| Zip Code | % Employed | vs State | vs National | |
| 1. | 80104 | 2.5% | 2.8%(-0.309)#261 | 3.1%(-0.555)#19,488 |
| 2. | 80108 | 1.4% | 2.8%(-1.44)#354 | 3.1%(-1.69)#24,616 |
| 3. | 80109 | 0.95% | 2.8%(-1.88)#382 | 3.1%(-2.12)#26,068 |
1
Common Questions
What are the Top Zip Codes with the Highest Percentage of Population Employed in Installation, Maintenance & Repair in Castle Rock, CO?
Top Zip Codes with the Highest Percentage of Population Employed in Installation, Maintenance & Repair in Castle Rock, CO are:
What zip code has the Highest Percentage of Population Employed in Installation, Maintenance & Repair in Castle Rock, CO?
80104 has the Highest Percentage of Population Employed in Installation, Maintenance & Repair in Castle Rock, CO with 2.5%.
What is the Percentage of Population Employed in Installation, Maintenance & Repair in Castle Rock, CO?
Percentage of Population Employed in Installation, Maintenance & Repair in Castle Rock is 1.8%.
What is the Percentage of Population Employed in Installation, Maintenance & Repair in Colorado?
Percentage of Population Employed in Installation, Maintenance & Repair in Colorado is 2.8%.
What is the Percentage of Population Employed in Installation, Maintenance & Repair in the United States?
Percentage of Population Employed in Installation, Maintenance & Repair in the United States is 3.1%.