Zip Codes with the Highest Percentage of Blackfeet Population in Anniston, AL
RELATED REPORTS & OPTIONS
Blackfeet
Anniston
Compare Zip Codes
Map of Zip Codes with the Highest Percentage of Blackfeet Population in Anniston
0.077%
0.086%
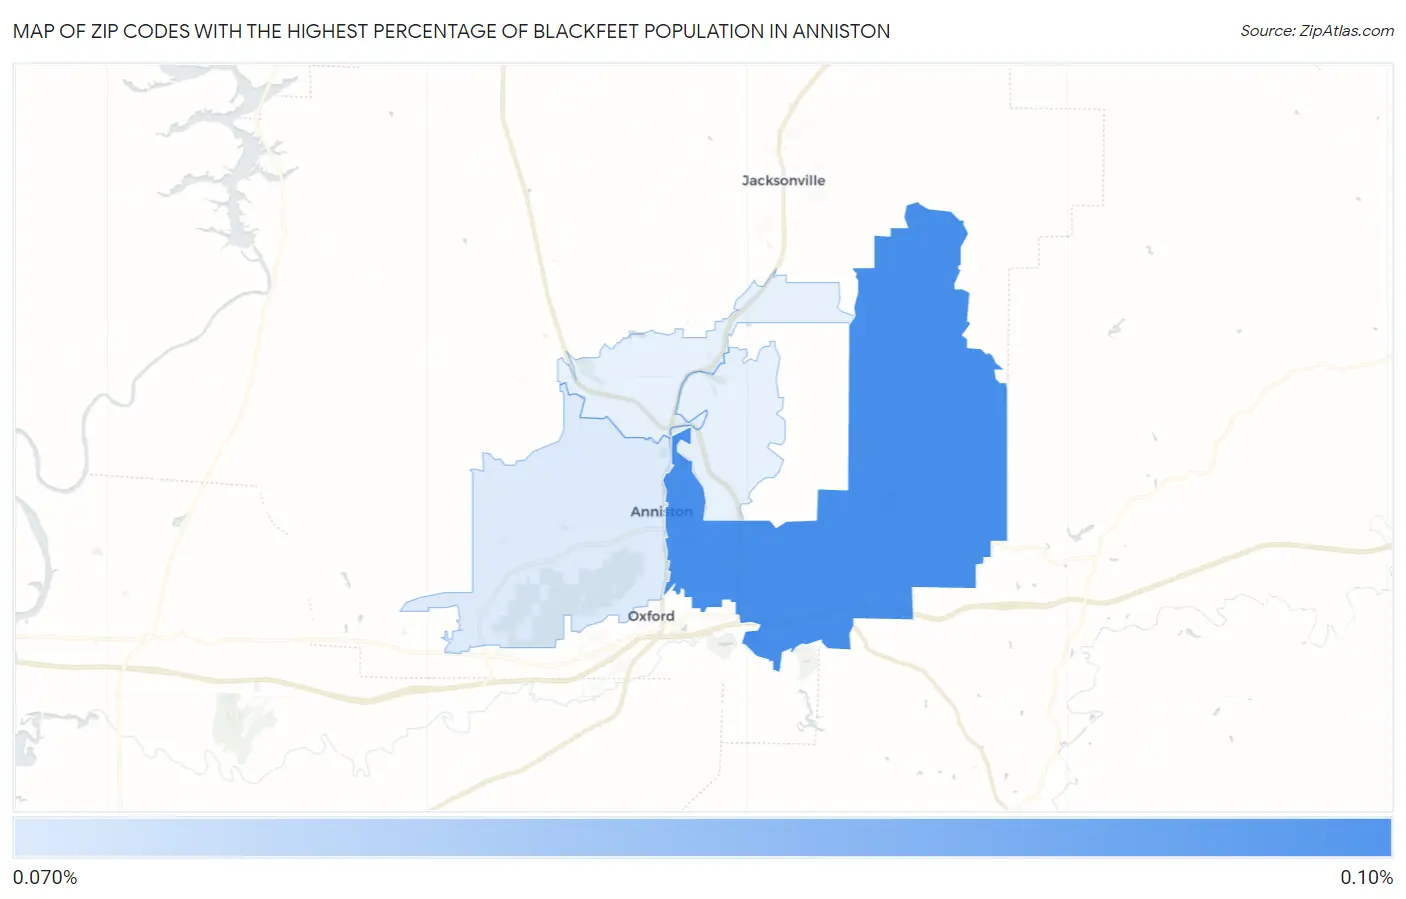
Zip Codes with the Highest Percentage of Blackfeet Population in Anniston, AL
| Zip Code | Blackfeet | vs State | vs National | |
| 1. | 36207 | 0.086% | 0.040%(+0.046)#54 | 0.062%(+0.025)#3,886 |
| 2. | 36201 | 0.077% | 0.040%(+0.037)#56 | 0.062%(+0.016)#4,097 |
1
Common Questions
What are the Top 3 Zip Codes with the Highest Percentage of Blackfeet Population in Anniston, AL?
Top 3 Zip Codes with the Highest Percentage of Blackfeet Population in Anniston, AL are:
What zip code has the Highest Percentage of Blackfeet Population in Anniston, AL?
36207 has the Highest Percentage of Blackfeet Population in Anniston, AL with 0.086%.
What is the Percentage of Blackfeet Population in Anniston, AL?
Percentage of Blackfeet Population in Anniston is 0.079%.
What is the Percentage of Blackfeet Population in Alabama?
Percentage of Blackfeet Population in Alabama is 0.040%.
What is the Percentage of Blackfeet Population in the United States?
Percentage of Blackfeet Population in the United States is 0.062%.