Zip Codes with the Highest Percentage of Population with a Degree in Visual and Performing Arts in Anniston, AL
RELATED REPORTS & OPTIONS
Visual and Performing Arts
Anniston
Compare Zip Codes
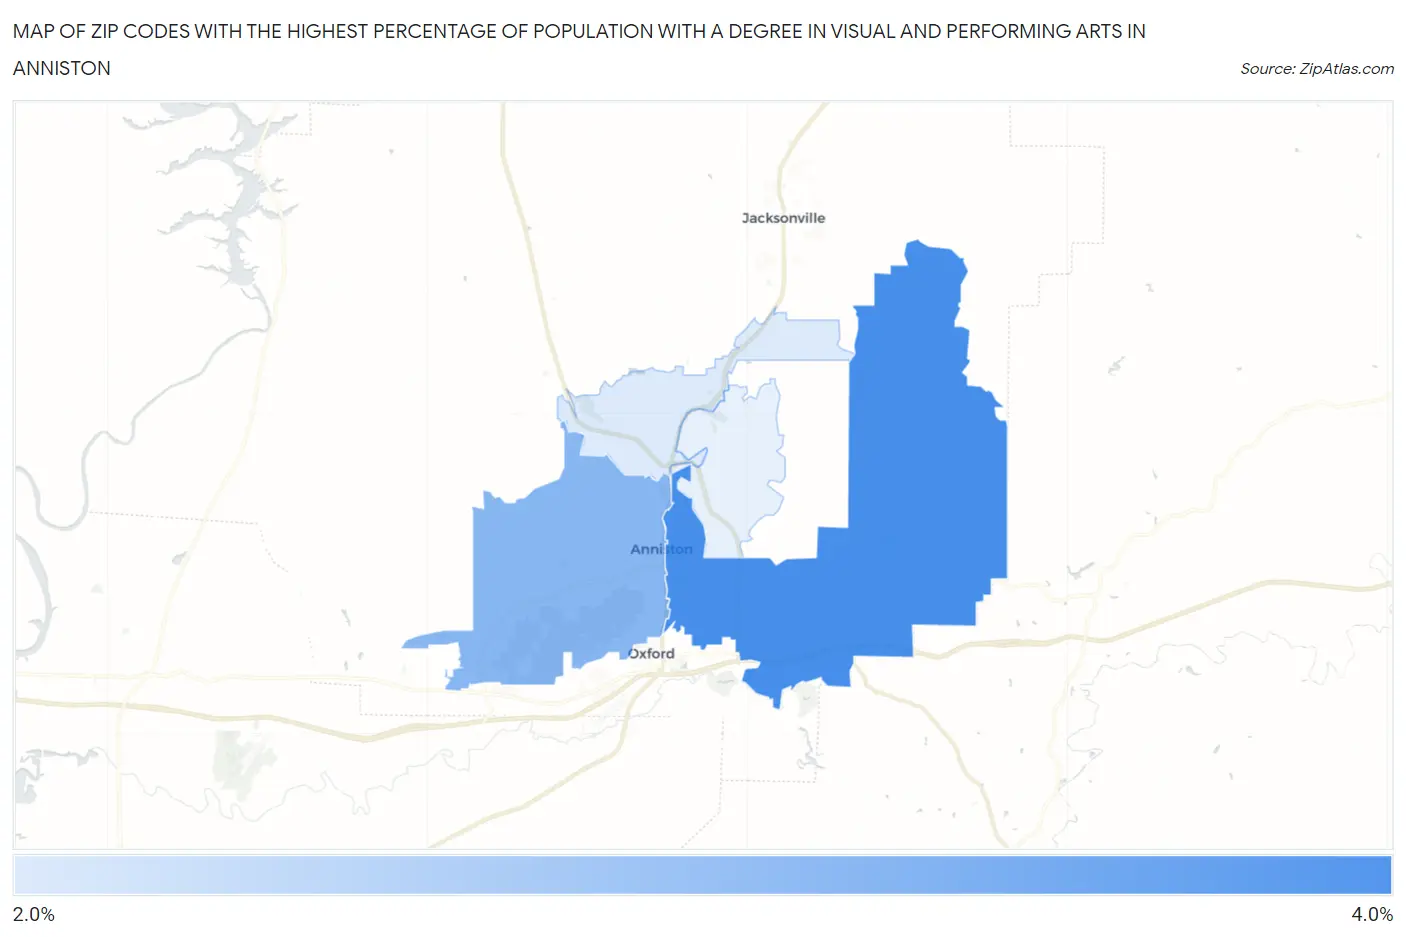
Map of Zip Codes with the Highest Percentage of Population with a Degree in Visual and Performing Arts in Anniston
2.0%
3.2%
Zip Codes with the Highest Percentage of Population with a Degree in Visual and Performing Arts in Anniston, AL
| Zip Code | % Graduates | vs State | vs National | |
| 1. | 36207 | 3.2% | 2.9%(+0.317)#137 | 4.3%(-1.04)#11,928 |
| 2. | 36201 | 2.7% | 2.9%(-0.199)#175 | 4.3%(-1.55)#13,913 |
| 3. | 36206 | 2.0% | 2.9%(-0.882)#227 | 4.3%(-2.24)#16,402 |
1
Common Questions
What are the Top 3 Zip Codes with the Highest Percentage of Population with a Degree in Visual and Performing Arts in Anniston, AL?
Top 3 Zip Codes with the Highest Percentage of Population with a Degree in Visual and Performing Arts in Anniston, AL are:
What zip code has the Highest Percentage of Population with a Degree in Visual and Performing Arts in Anniston, AL?
36207 has the Highest Percentage of Population with a Degree in Visual and Performing Arts in Anniston, AL with 3.2%.
What is the Percentage of Population with a Degree in Visual and Performing Arts in Anniston, AL?
Percentage of Population with a Degree in Visual and Performing Arts in Anniston is 3.1%.
What is the Percentage of Population with a Degree in Visual and Performing Arts in Alabama?
Percentage of Population with a Degree in Visual and Performing Arts in Alabama is 2.9%.
What is the Percentage of Population with a Degree in Visual and Performing Arts in the United States?
Percentage of Population with a Degree in Visual and Performing Arts in the United States is 4.3%.