Zip Codes with the Highest Percentage of Population Employed in Health Diagnosing & Treating in Anniston, AL
RELATED REPORTS & OPTIONS
Health Diagnosing & Treating
Anniston
Compare Zip Codes
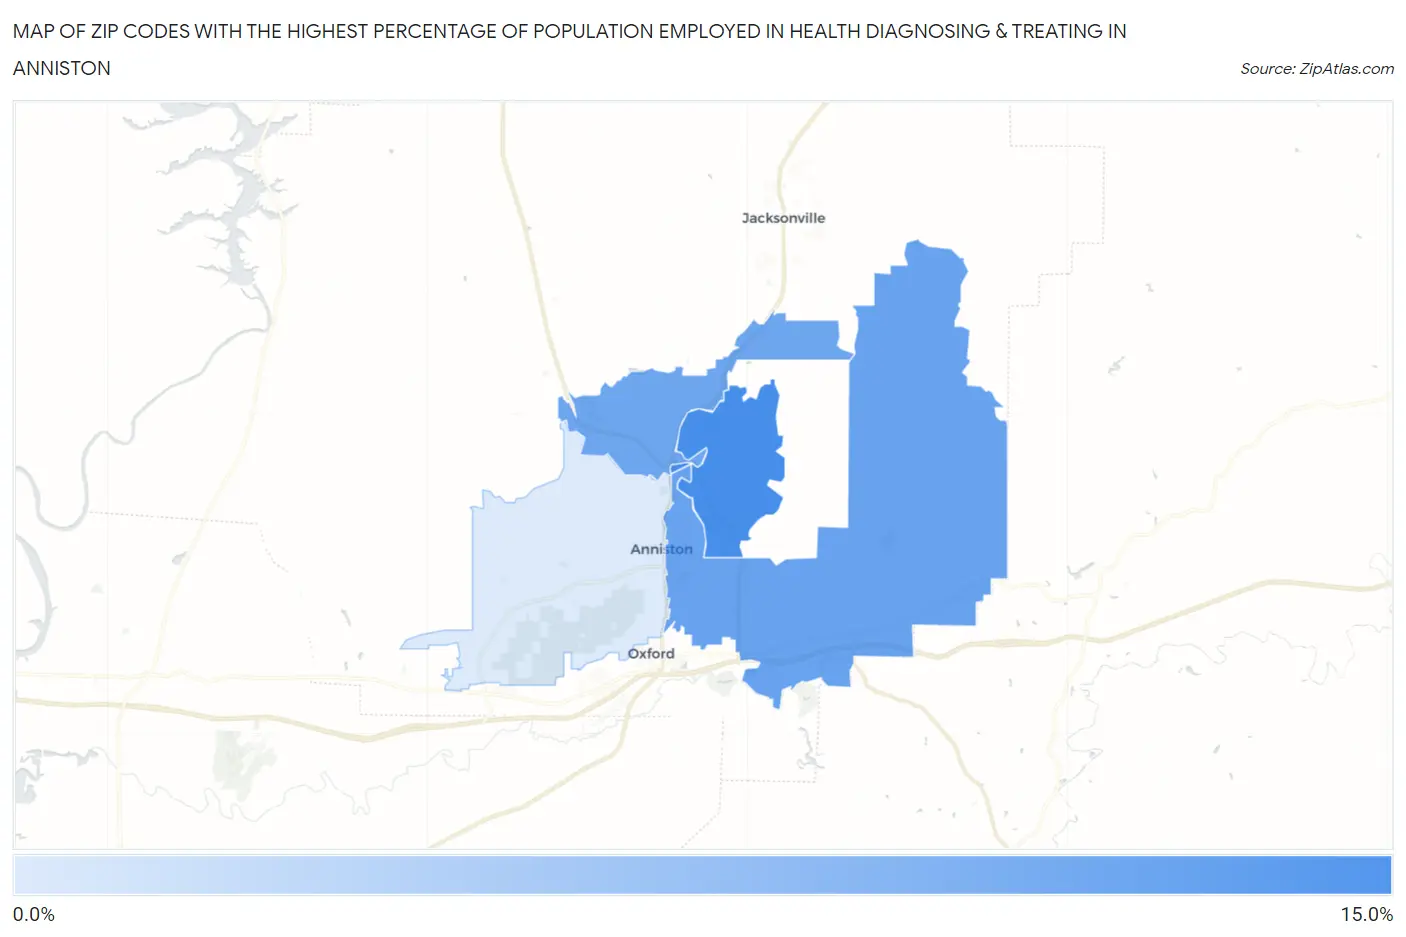
Map of Zip Codes with the Highest Percentage of Population Employed in Health Diagnosing & Treating in Anniston
2.1%
11.0%
Zip Codes with the Highest Percentage of Population Employed in Health Diagnosing & Treating in Anniston, AL
| Zip Code | % Employed | vs State | vs National | |
| 1. | 36205 | 11.0% | 7.0%(+4.00)#68 | 6.2%(+4.78)#2,872 |
| 2. | 36207 | 9.1% | 7.0%(+2.07)#124 | 6.2%(+2.85)#5,188 |
| 3. | 36206 | 8.6% | 7.0%(+1.57)#149 | 6.2%(+2.35)#6,149 |
| 4. | 36201 | 2.1% | 7.0%(-4.95)#508 | 6.2%(-4.17)#26,342 |
1
Common Questions
What are the Top 3 Zip Codes with the Highest Percentage of Population Employed in Health Diagnosing & Treating in Anniston, AL?
Top 3 Zip Codes with the Highest Percentage of Population Employed in Health Diagnosing & Treating in Anniston, AL are:
What zip code has the Highest Percentage of Population Employed in Health Diagnosing & Treating in Anniston, AL?
36205 has the Highest Percentage of Population Employed in Health Diagnosing & Treating in Anniston, AL with 11.0%.
What is the Percentage of Population Employed in Health Diagnosing & Treating in Anniston, AL?
Percentage of Population Employed in Health Diagnosing & Treating in Anniston is 6.3%.
What is the Percentage of Population Employed in Health Diagnosing & Treating in Alabama?
Percentage of Population Employed in Health Diagnosing & Treating in Alabama is 7.0%.
What is the Percentage of Population Employed in Health Diagnosing & Treating in the United States?
Percentage of Population Employed in Health Diagnosing & Treating in the United States is 6.2%.