Anniston, AL Map & Demographics
Anniston Map
Anniston Overview
$30,564
PER CAPITA INCOME
$64,070
AVG FAMILY INCOME
$45,642
AVG HOUSEHOLD INCOME
25.8%
WAGE / INCOME GAP [ % ]
74.2¢/ $1
WAGE / INCOME GAP [ $ ]
$10,670
FAMILY INCOME DEFICIT
0.52
INEQUALITY / GINI INDEX
21,502
TOTAL POPULATION
10,142
MALE POPULATION
11,360
FEMALE POPULATION
89.28
MALES / 100 FEMALES
112.01
FEMALES / 100 MALES
42.1
MEDIAN AGE
2.9
AVG FAMILY SIZE
2.2
AVG HOUSEHOLD SIZE
9,171
LABOR FORCE [ PEOPLE ]
51.5%
PERCENT IN LABOR FORCE
5.5%
UNEMPLOYMENT RATE
Anniston Area Codes
Income in Anniston
Income Overview in Anniston
Per Capita Income in Anniston is $30,564, while median incomes of families and households are $64,070 and $45,642 respectively.
| Characteristic | Number | Measure |
| Per Capita Income | 21,502 | $30,564 |
| Median Family Income | 5,235 | $64,070 |
| Mean Family Income | 5,235 | $88,819 |
| Median Household Income | 9,473 | $45,642 |
| Mean Household Income | 9,473 | $66,400 |
| Income Deficit | 5,235 | $10,670 |
| Wage / Income Gap (%) | 21,502 | 25.75% |
| Wage / Income Gap ($) | 21,502 | 74.25¢ per $1 |
| Gini / Inequality Index | 21,502 | 0.52 |
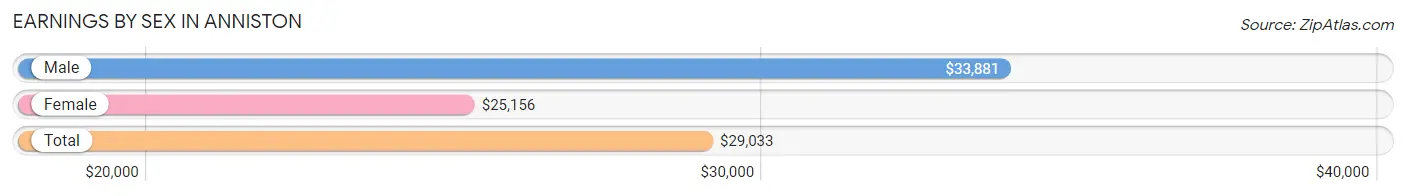
Earnings by Sex in Anniston
Average Earnings in Anniston are $29,033, $33,881 for men and $25,156 for women, a difference of 25.8%.
| Sex | Number | Average Earnings |
| Male | 5,073 (51.7%) | $33,881 |
| Female | 4,739 (48.3%) | $25,156 |
| Total | 9,812 (100.0%) | $29,033 |
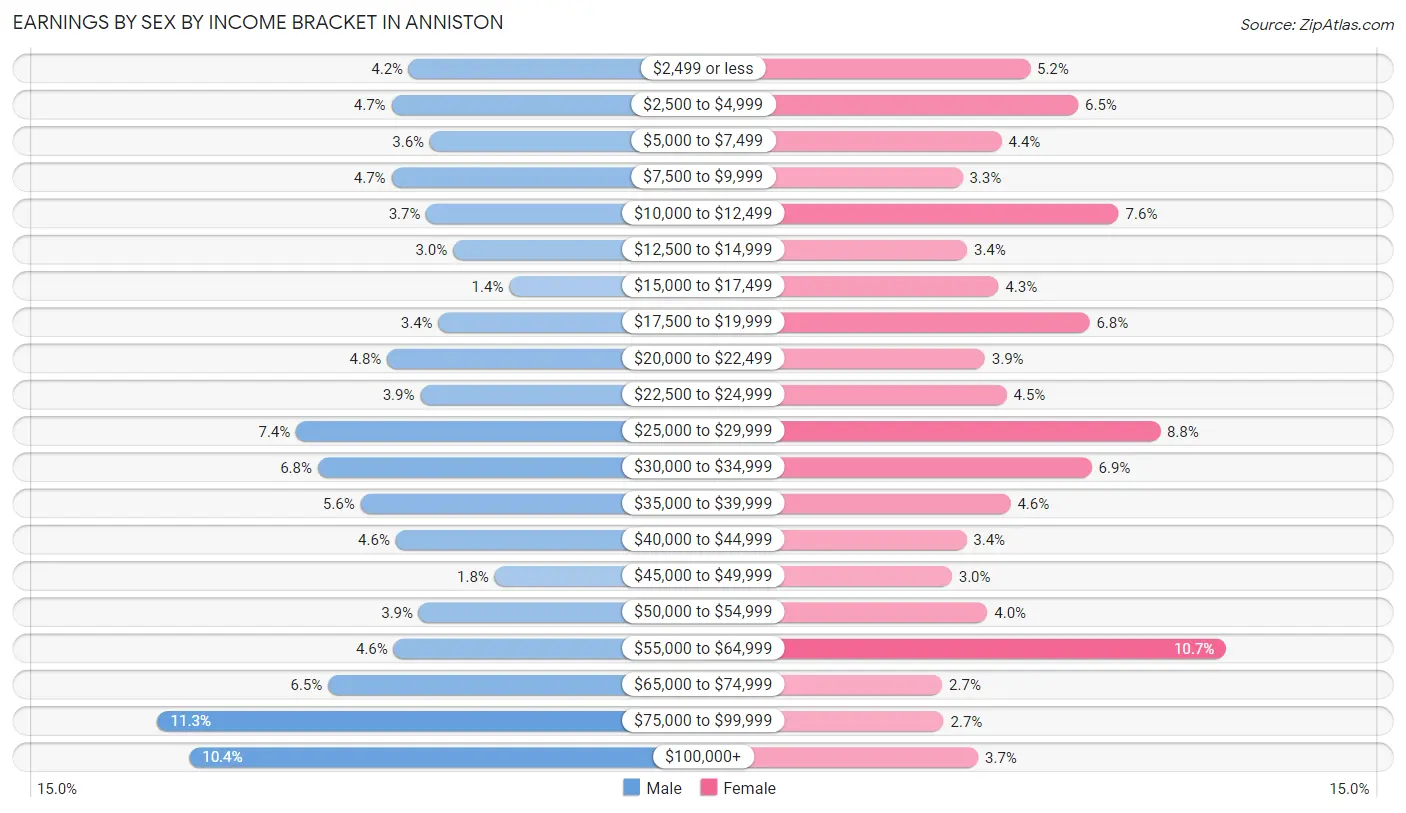
Earnings by Sex by Income Bracket in Anniston
The most common earnings brackets in Anniston are $75,000 to $99,999 for men (571 | 11.3%) and $55,000 to $64,999 for women (505 | 10.7%).
| Income | Male | Female |
| $2,499 or less | 213 (4.2%) | 244 (5.1%) |
| $2,500 to $4,999 | 238 (4.7%) | 308 (6.5%) |
| $5,000 to $7,499 | 183 (3.6%) | 206 (4.3%) |
| $7,500 to $9,999 | 238 (4.7%) | 154 (3.3%) |
| $10,000 to $12,499 | 188 (3.7%) | 362 (7.6%) |
| $12,500 to $14,999 | 150 (3.0%) | 160 (3.4%) |
| $15,000 to $17,499 | 70 (1.4%) | 202 (4.3%) |
| $17,500 to $19,999 | 171 (3.4%) | 323 (6.8%) |
| $20,000 to $22,499 | 244 (4.8%) | 184 (3.9%) |
| $22,500 to $24,999 | 197 (3.9%) | 213 (4.5%) |
| $25,000 to $29,999 | 374 (7.4%) | 417 (8.8%) |
| $30,000 to $34,999 | 343 (6.8%) | 326 (6.9%) |
| $35,000 to $39,999 | 282 (5.6%) | 218 (4.6%) |
| $40,000 to $44,999 | 232 (4.6%) | 159 (3.4%) |
| $45,000 to $49,999 | 91 (1.8%) | 140 (2.9%) |
| $50,000 to $54,999 | 199 (3.9%) | 187 (4.0%) |
| $55,000 to $64,999 | 235 (4.6%) | 505 (10.7%) |
| $65,000 to $74,999 | 328 (6.5%) | 127 (2.7%) |
| $75,000 to $99,999 | 571 (11.3%) | 129 (2.7%) |
| $100,000+ | 526 (10.4%) | 175 (3.7%) |
| Total | 5,073 (100.0%) | 4,739 (100.0%) |
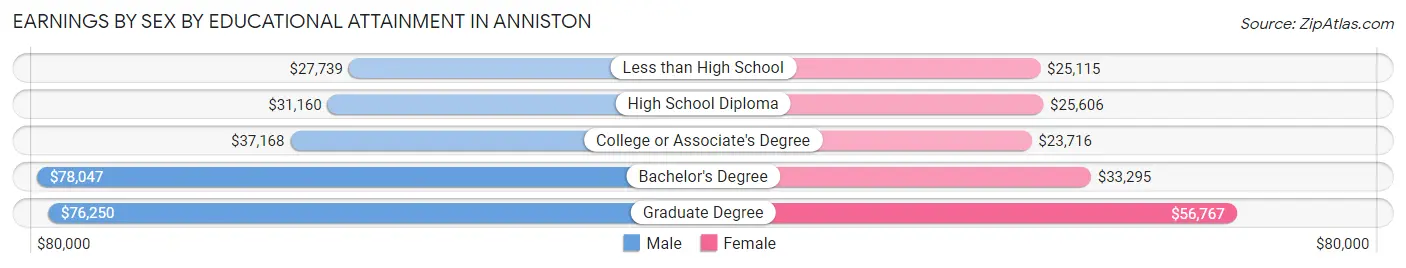
Earnings by Sex by Educational Attainment in Anniston
Average earnings in Anniston are $37,578 for men and $28,419 for women, a difference of 24.4%. Men with an educational attainment of bachelor's degree enjoy the highest average annual earnings of $78,047, while those with less than high school education earn the least with $27,739. Women with an educational attainment of graduate degree earn the most with the average annual earnings of $56,767, while those with college or associate's degree education have the smallest earnings of $23,716.
| Educational Attainment | Male Income | Female Income |
| Less than High School | $27,739 | $25,115 |
| High School Diploma | $31,160 | $25,606 |
| College or Associate's Degree | $37,168 | $23,716 |
| Bachelor's Degree | $78,047 | $33,295 |
| Graduate Degree | $76,250 | $56,767 |
| Total | $37,578 | $28,419 |
Family Income in Anniston
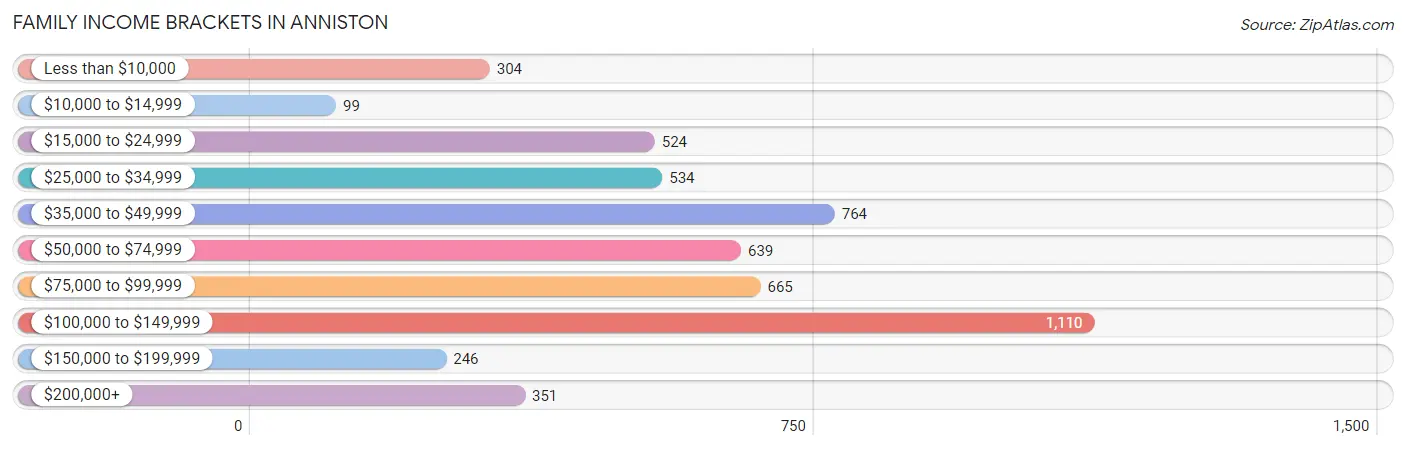
Family Income Brackets in Anniston
According to the Anniston family income data, there are 1,110 families falling into the $100,000 to $149,999 income range, which is the most common income bracket and makes up 21.2% of all families. Conversely, the $10,000 to $14,999 income bracket is the least frequent group with only 99 families (1.9%) belonging to this category.
| Income Bracket | # Families | % Families |
| Less than $10,000 | 304 | 5.8% |
| $10,000 to $14,999 | 99 | 1.9% |
| $15,000 to $24,999 | 524 | 10.0% |
| $25,000 to $34,999 | 534 | 10.2% |
| $35,000 to $49,999 | 764 | 14.6% |
| $50,000 to $74,999 | 639 | 12.2% |
| $75,000 to $99,999 | 665 | 12.7% |
| $100,000 to $149,999 | 1,110 | 21.2% |
| $150,000 to $199,999 | 246 | 4.7% |
| $200,000+ | 351 | 6.7% |
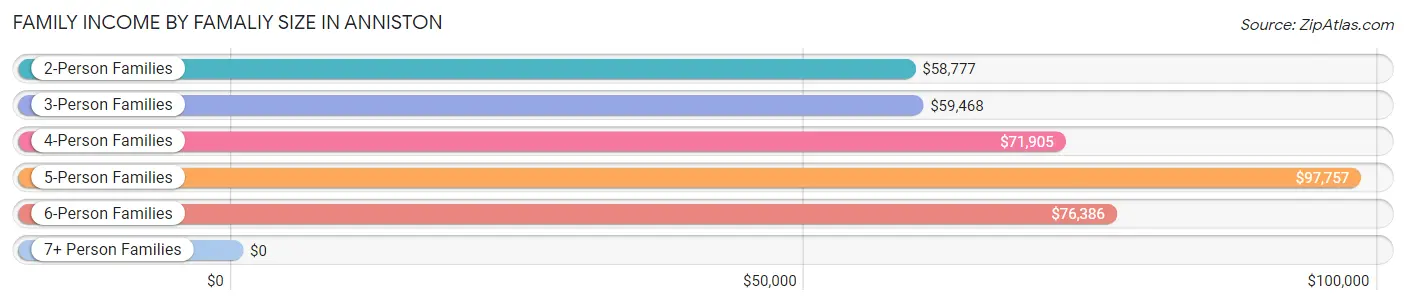
Family Income by Famaliy Size in Anniston
5-person families (183 | 3.5%) account for the highest median family income in Anniston with $97,757 per family, while 2-person families (3,160 | 60.4%) have the highest median income of $29,388 per family member.
| Income Bracket | # Families | Median Income |
| 2-Person Families | 3,160 (60.4%) | $58,777 |
| 3-Person Families | 954 (18.2%) | $59,468 |
| 4-Person Families | 786 (15.0%) | $71,905 |
| 5-Person Families | 183 (3.5%) | $97,757 |
| 6-Person Families | 109 (2.1%) | $76,386 |
| 7+ Person Families | 43 (0.8%) | $0 |
| Total | 5,235 (100.0%) | $64,070 |
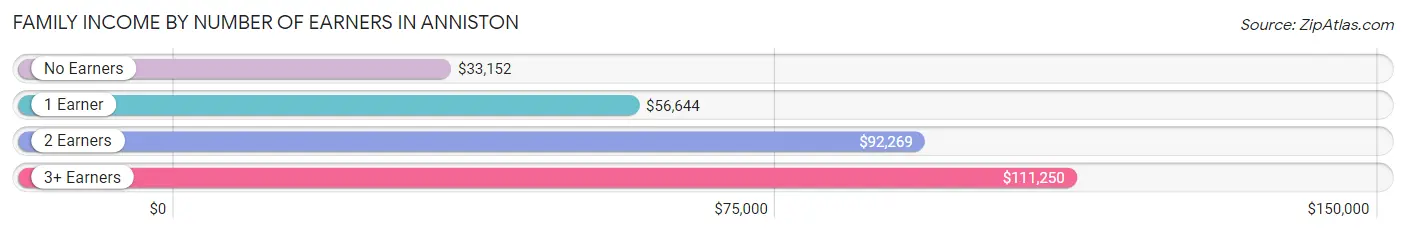
Family Income by Number of Earners in Anniston
The median family income in Anniston is $64,070, with families comprising 3+ earners (327) having the highest median family income of $111,250, while families with no earners (1,198) have the lowest median family income of $33,152, accounting for 6.2% and 22.9% of families, respectively.
| Number of Earners | # Families | Median Income |
| No Earners | 1,198 (22.9%) | $33,152 |
| 1 Earner | 1,937 (37.0%) | $56,644 |
| 2 Earners | 1,773 (33.9%) | $92,269 |
| 3+ Earners | 327 (6.2%) | $111,250 |
| Total | 5,235 (100.0%) | $64,070 |
Household Income in Anniston
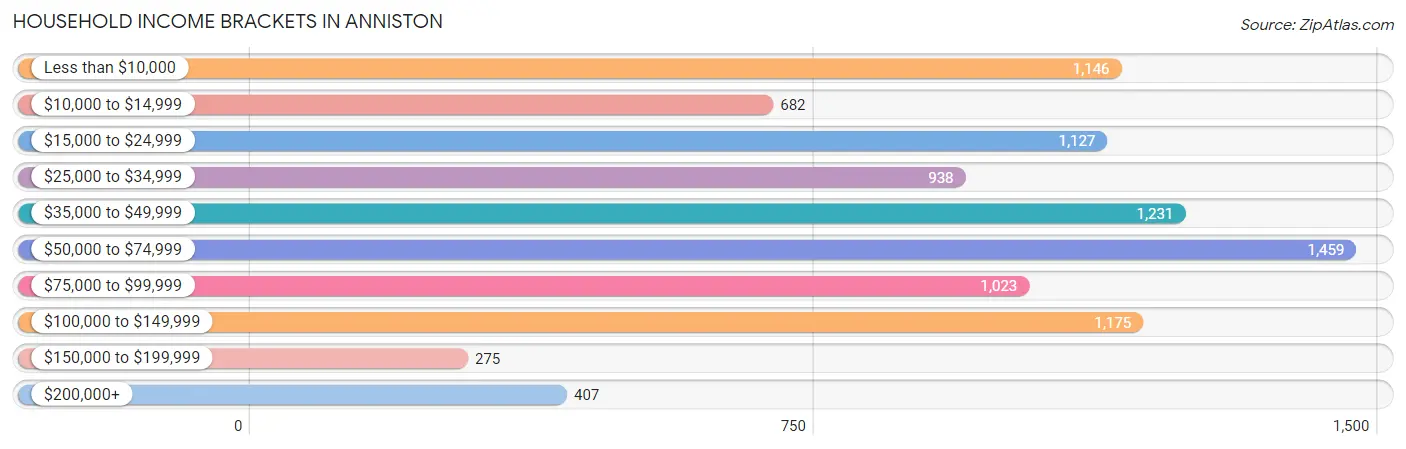
Household Income Brackets in Anniston
With 1,459 households falling in the category, the $50,000 to $74,999 income range is the most frequent in Anniston, accounting for 15.4% of all households. In contrast, only 275 households (2.9%) fall into the $150,000 to $199,999 income bracket, making it the least populous group.
| Income Bracket | # Households | % Households |
| Less than $10,000 | 1,146 | 12.1% |
| $10,000 to $14,999 | 682 | 7.2% |
| $15,000 to $24,999 | 1,127 | 11.9% |
| $25,000 to $34,999 | 938 | 9.9% |
| $35,000 to $49,999 | 1,231 | 13.0% |
| $50,000 to $74,999 | 1,459 | 15.4% |
| $75,000 to $99,999 | 1,023 | 10.8% |
| $100,000 to $149,999 | 1,175 | 12.4% |
| $150,000 to $199,999 | 275 | 2.9% |
| $200,000+ | 407 | 4.3% |
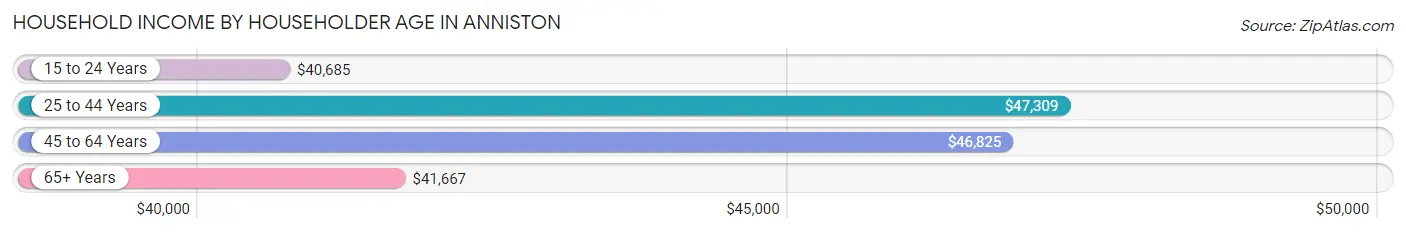
Household Income by Householder Age in Anniston
The median household income in Anniston is $45,642, with the highest median household income of $47,309 found in the 25 to 44 years age bracket for the primary householder. A total of 2,829 households (29.9%) fall into this category. Meanwhile, the 15 to 24 years age bracket for the primary householder has the lowest median household income of $40,685, with 223 households (2.4%) in this group.
| Income Bracket | # Households | Median Income |
| 15 to 24 Years | 223 (2.4%) | $40,685 |
| 25 to 44 Years | 2,829 (29.9%) | $47,309 |
| 45 to 64 Years | 3,235 (34.2%) | $46,825 |
| 65+ Years | 3,186 (33.6%) | $41,667 |
| Total | 9,473 (100.0%) | $45,642 |
Poverty in Anniston
Income Below Poverty by Sex and Age in Anniston
With 19.8% poverty level for males and 24.2% for females among the residents of Anniston, 15 year old males and 5 year old females are the most vulnerable to poverty, with 16 males (51.6%) and 74 females (57.4%) in their respective age groups living below the poverty level.
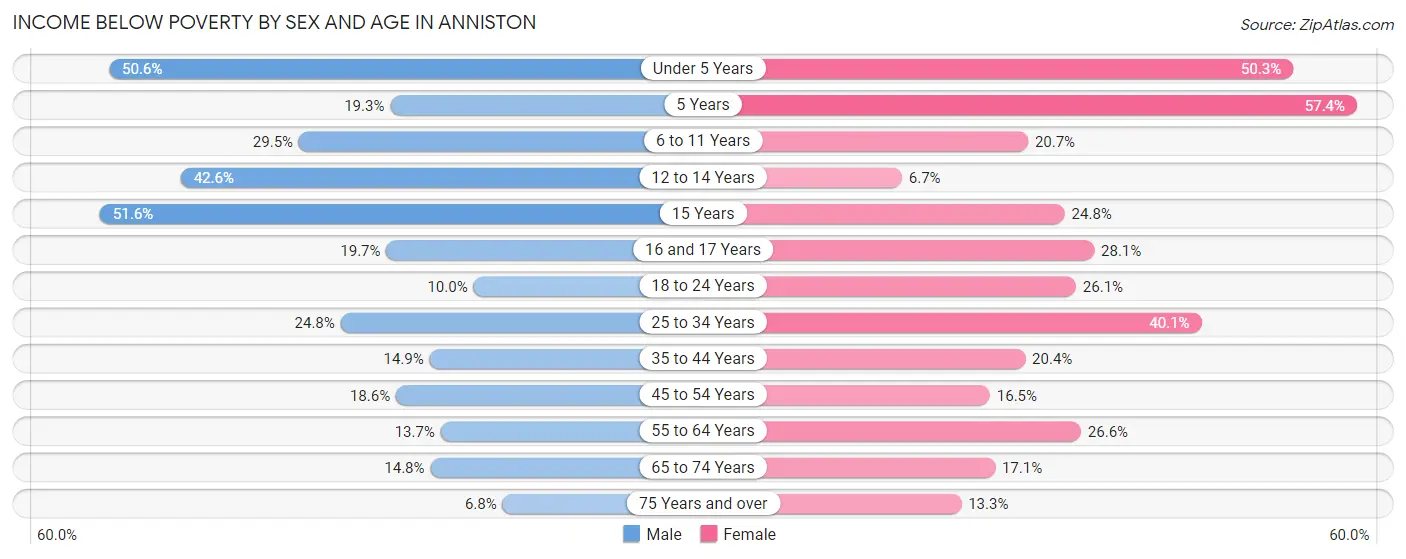
| Age Bracket | Male | Female |
| Under 5 Years | 341 (50.6%) | 290 (50.3%) |
| 5 Years | 16 (19.3%) | 74 (57.4%) |
| 6 to 11 Years | 162 (29.4%) | 160 (20.7%) |
| 12 to 14 Years | 150 (42.6%) | 24 (6.7%) |
| 15 Years | 16 (51.6%) | 35 (24.8%) |
| 16 and 17 Years | 54 (19.7%) | 77 (28.1%) |
| 18 to 24 Years | 98 (10.0%) | 231 (26.1%) |
| 25 to 34 Years | 291 (24.8%) | 459 (40.1%) |
| 35 to 44 Years | 173 (14.9%) | 271 (20.4%) |
| 45 to 54 Years | 183 (18.6%) | 207 (16.5%) |
| 55 to 64 Years | 187 (13.7%) | 428 (26.6%) |
| 65 to 74 Years | 213 (14.8%) | 274 (17.1%) |
| 75 Years and over | 46 (6.8%) | 116 (13.3%) |
| Total | 1,930 (19.8%) | 2,646 (24.2%) |
Income Above Poverty by Sex and Age in Anniston
According to the poverty statistics in Anniston, males aged 75 years and over and females aged 12 to 14 years are the age groups that are most secure financially, with 93.2% of males and 93.3% of females in these age groups living above the poverty line.
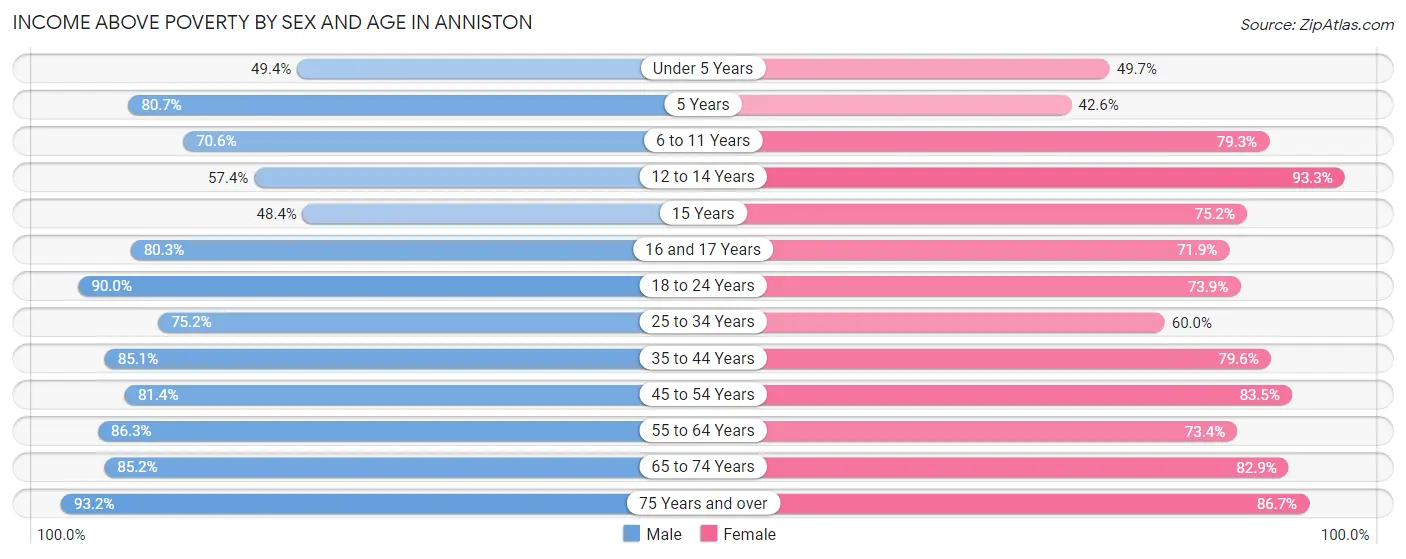
| Age Bracket | Male | Female |
| Under 5 Years | 333 (49.4%) | 287 (49.7%) |
| 5 Years | 67 (80.7%) | 55 (42.6%) |
| 6 to 11 Years | 388 (70.6%) | 612 (79.3%) |
| 12 to 14 Years | 202 (57.4%) | 335 (93.3%) |
| 15 Years | 15 (48.4%) | 106 (75.2%) |
| 16 and 17 Years | 220 (80.3%) | 197 (71.9%) |
| 18 to 24 Years | 881 (90.0%) | 655 (73.9%) |
| 25 to 34 Years | 882 (75.2%) | 687 (60.0%) |
| 35 to 44 Years | 988 (85.1%) | 1,056 (79.6%) |
| 45 to 54 Years | 799 (81.4%) | 1,048 (83.5%) |
| 55 to 64 Years | 1,182 (86.3%) | 1,179 (73.4%) |
| 65 to 74 Years | 1,225 (85.2%) | 1,332 (82.9%) |
| 75 Years and over | 633 (93.2%) | 756 (86.7%) |
| Total | 7,815 (80.2%) | 8,305 (75.8%) |
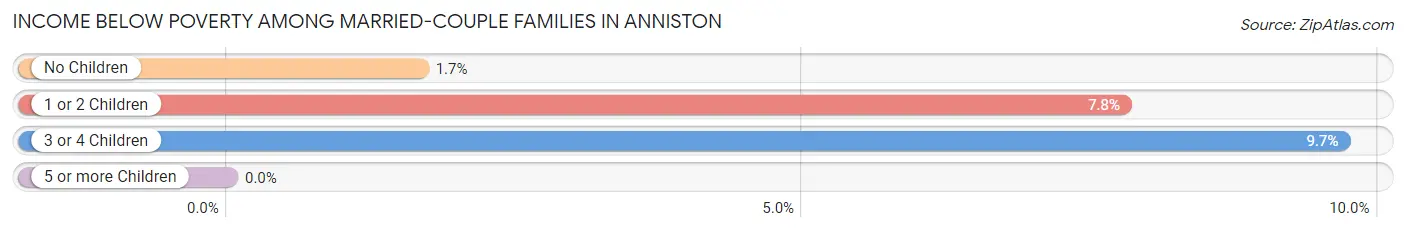
Income Below Poverty Among Married-Couple Families in Anniston
The poverty statistics for married-couple families in Anniston show that 3.4% or 109 of the total 3,190 families live below the poverty line. Families with 3 or 4 children have the highest poverty rate of 9.7%, comprising of 24 families. On the other hand, families with no children have the lowest poverty rate of 1.7%, which includes 39 families.
| Children | Above Poverty | Below Poverty |
| No Children | 2,312 (98.3%) | 39 (1.7%) |
| 1 or 2 Children | 545 (92.2%) | 46 (7.8%) |
| 3 or 4 Children | 224 (90.3%) | 24 (9.7%) |
| 5 or more Children | 0 (0.0%) | 0 (0.0%) |
| Total | 3,081 (96.6%) | 109 (3.4%) |
Income Below Poverty Among Single-Parent Households in Anniston
According to the poverty data in Anniston, 21.1% or 129 single-father households and 34.0% or 488 single-mother households are living below the poverty line. Among single-father households, those with 1 or 2 children have the highest poverty rate, with 117 households (35.4%) experiencing poverty. Likewise, among single-mother households, those with 3 or 4 children have the highest poverty rate, with 89 households (48.6%) falling below the poverty line.
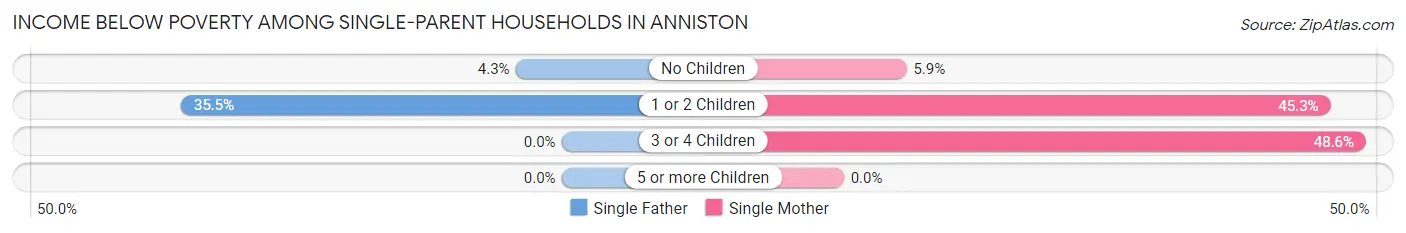
| Children | Single Father | Single Mother |
| No Children | 12 (4.3%) | 25 (5.9%) |
| 1 or 2 Children | 117 (35.4%) | 374 (45.3%) |
| 3 or 4 Children | 0 (0.0%) | 89 (48.6%) |
| 5 or more Children | 0 (0.0%) | 0 (0.0%) |
| Total | 129 (21.1%) | 488 (34.0%) |
Income Below Poverty Among Married-Couple vs Single-Parent Households in Anniston
The poverty data for Anniston shows that 109 of the married-couple family households (3.4%) and 617 of the single-parent households (30.2%) are living below the poverty level. Within the married-couple family households, those with 3 or 4 children have the highest poverty rate, with 24 households (9.7%) falling below the poverty line. Among the single-parent households, those with 3 or 4 children have the highest poverty rate, with 89 household (48.6%) living below poverty.
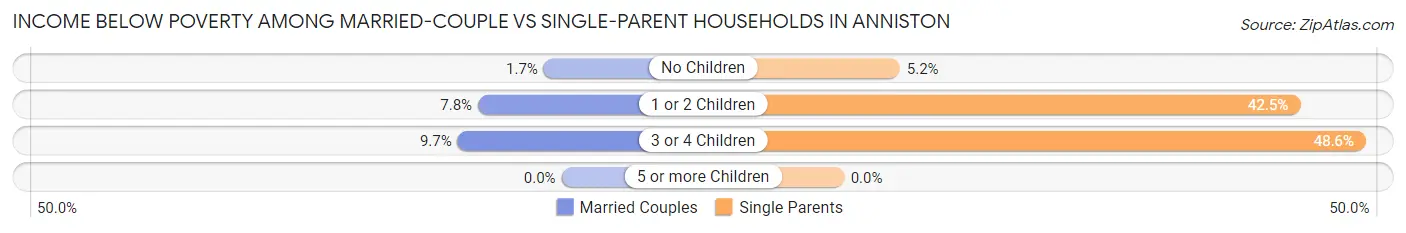
| Children | Married-Couple Families | Single-Parent Households |
| No Children | 39 (1.7%) | 37 (5.2%) |
| 1 or 2 Children | 46 (7.8%) | 491 (42.5%) |
| 3 or 4 Children | 24 (9.7%) | 89 (48.6%) |
| 5 or more Children | 0 (0.0%) | 0 (0.0%) |
| Total | 109 (3.4%) | 617 (30.2%) |
Race in Anniston
The most populous races in Anniston are Black / African American (10,844 | 50.4%), White / Caucasian (9,528 | 44.3%), and Hispanic or Latino (797 | 3.7%).
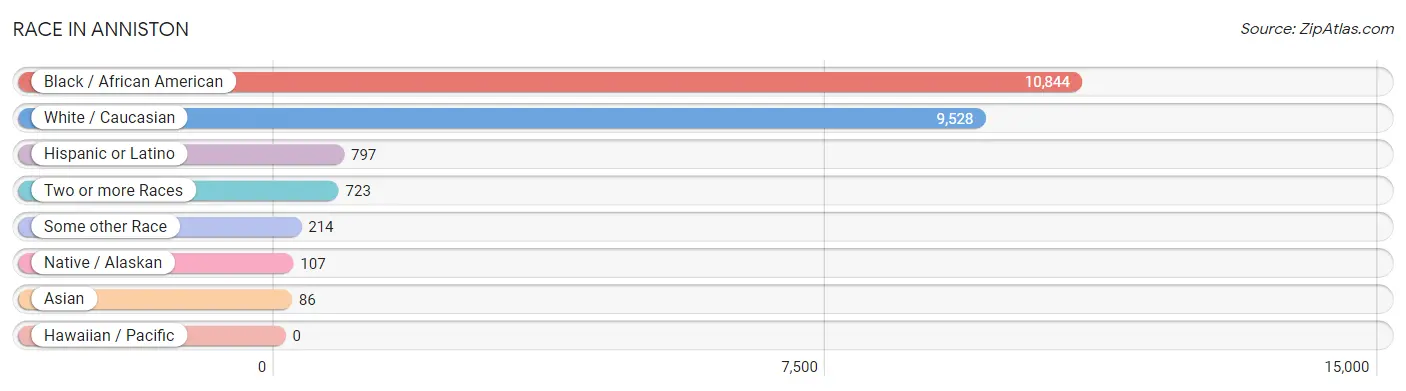
| Race | # Population | % Population |
| Asian | 86 | 0.4% |
| Black / African American | 10,844 | 50.4% |
| Hawaiian / Pacific | 0 | 0.0% |
| Hispanic or Latino | 797 | 3.7% |
| Native / Alaskan | 107 | 0.5% |
| White / Caucasian | 9,528 | 44.3% |
| Two or more Races | 723 | 3.4% |
| Some other Race | 214 | 1.0% |
| Total | 21,502 | 100.0% |
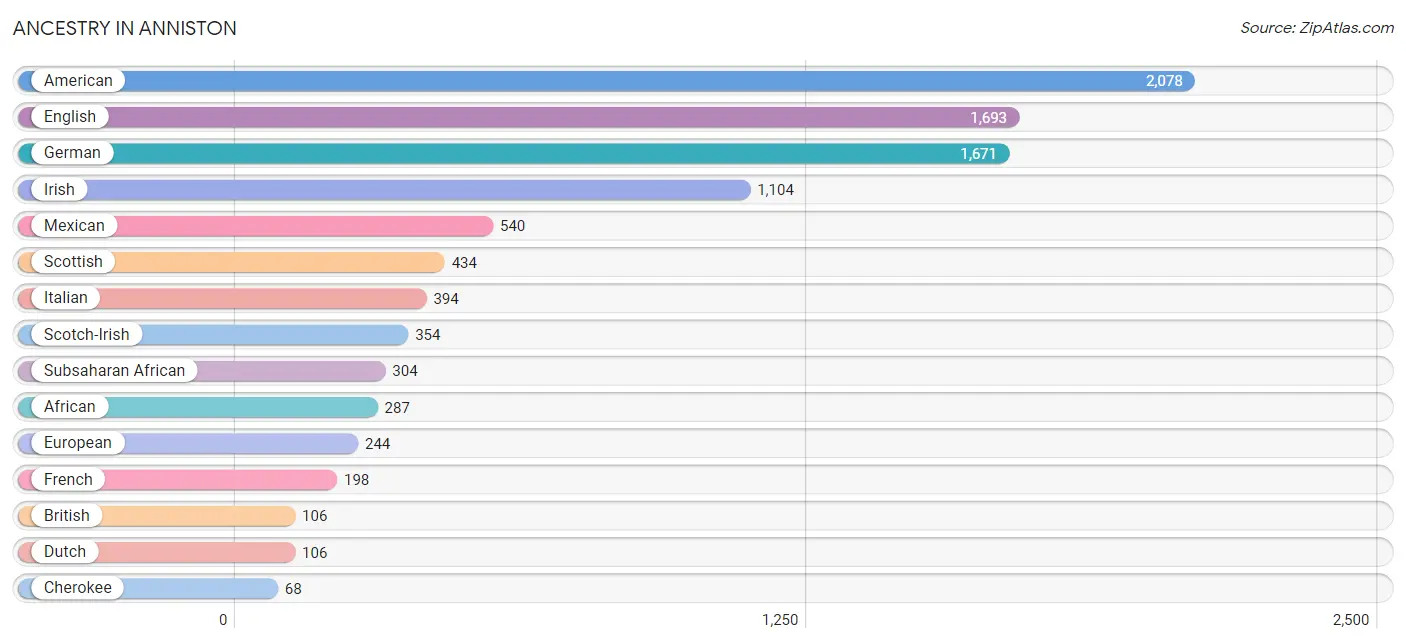
Ancestry in Anniston
The most populous ancestries reported in Anniston are American (2,078 | 9.7%), English (1,693 | 7.9%), German (1,671 | 7.8%), Irish (1,104 | 5.1%), and Mexican (540 | 2.5%), together accounting for 32.9% of all Anniston residents.
| Ancestry | # Population | % Population |
| African | 287 | 1.3% |
| American | 2,078 | 9.7% |
| Australian | 40 | 0.2% |
| Barbadian | 8 | 0.0% |
| Bhutanese | 50 | 0.2% |
| Blackfeet | 17 | 0.1% |
| British | 106 | 0.5% |
| Burmese | 19 | 0.1% |
| Canadian | 24 | 0.1% |
| Central American | 22 | 0.1% |
| Cherokee | 68 | 0.3% |
| Chickasaw | 3 | 0.0% |
| Choctaw | 8 | 0.0% |
| Colombian | 36 | 0.2% |
| Cuban | 67 | 0.3% |
| Dominican | 25 | 0.1% |
| Dutch | 106 | 0.5% |
| English | 1,693 | 7.9% |
| European | 244 | 1.1% |
| French | 198 | 0.9% |
| French Canadian | 28 | 0.1% |
| German | 1,671 | 7.8% |
| Hungarian | 11 | 0.1% |
| Irish | 1,104 | 5.1% |
| Iroquois | 4 | 0.0% |
| Italian | 394 | 1.8% |
| Jamaican | 24 | 0.1% |
| Kenyan | 13 | 0.1% |
| Korean | 25 | 0.1% |
| Macedonian | 55 | 0.3% |
| Mexican | 540 | 2.5% |
| Mexican American Indian | 35 | 0.2% |
| Navajo | 8 | 0.0% |
| Nigerian | 4 | 0.0% |
| Norwegian | 41 | 0.2% |
| Pakistani | 11 | 0.1% |
| Polish | 37 | 0.2% |
| Portuguese | 8 | 0.0% |
| Puerto Rican | 61 | 0.3% |
| Salvadoran | 22 | 0.1% |
| Scandinavian | 42 | 0.2% |
| Scotch-Irish | 354 | 1.7% |
| Scottish | 434 | 2.0% |
| Seminole | 26 | 0.1% |
| Slovak | 37 | 0.2% |
| Slovene | 31 | 0.1% |
| South American | 45 | 0.2% |
| Spaniard | 8 | 0.0% |
| Spanish | 29 | 0.1% |
| Sri Lankan | 14 | 0.1% |
| Subsaharan African | 304 | 1.4% |
| Swedish | 41 | 0.2% |
| Venezuelan | 9 | 0.0% |
| Welsh | 33 | 0.2% |
| Yugoslavian | 4 | 0.0% | View All 55 Rows |
Immigrants in Anniston
The most numerous immigrant groups reported in Anniston came from Latin America (171 | 0.8%), Europe (110 | 0.5%), South America (65 | 0.3%), Central America (59 | 0.3%), and Eastern Europe (55 | 0.3%), together accounting for 2.1% of all Anniston residents.
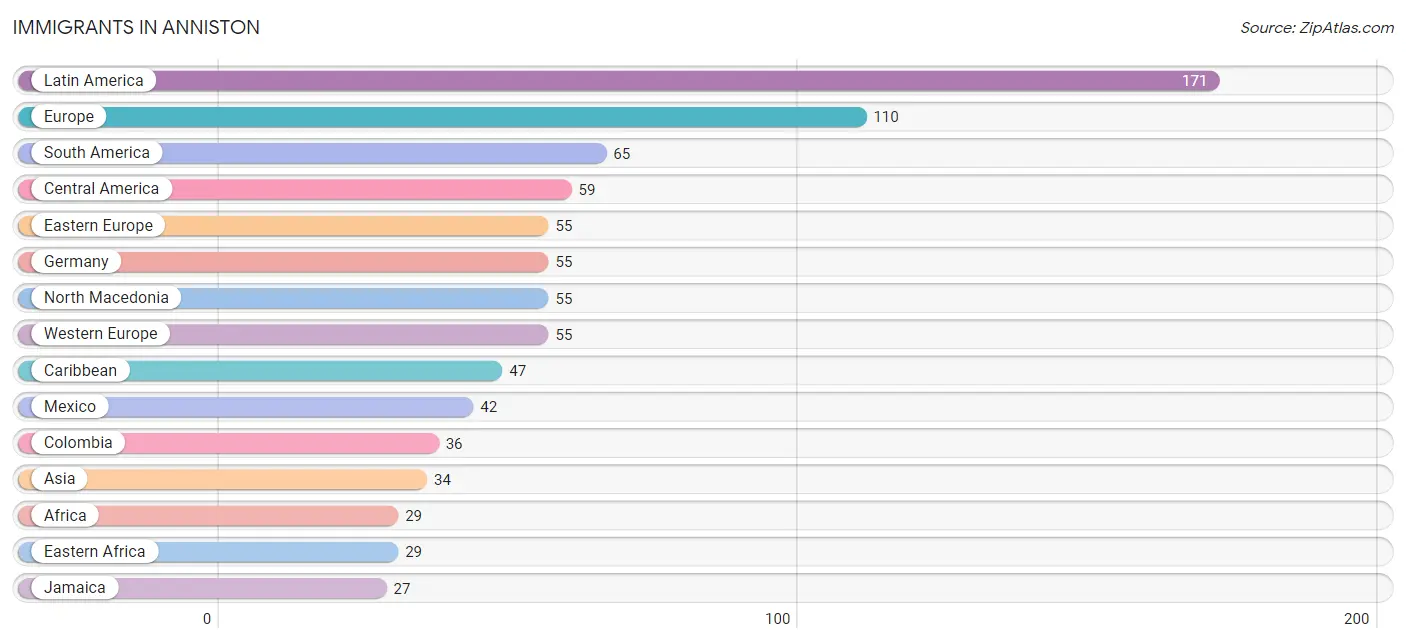
| Immigration Origin | # Population | % Population |
| Africa | 29 | 0.1% |
| Asia | 34 | 0.2% |
| Canada | 12 | 0.1% |
| Caribbean | 47 | 0.2% |
| Central America | 59 | 0.3% |
| Colombia | 36 | 0.2% |
| Cuba | 20 | 0.1% |
| Eastern Africa | 29 | 0.1% |
| Eastern Asia | 19 | 0.1% |
| Eastern Europe | 55 | 0.3% |
| El Salvador | 17 | 0.1% |
| Europe | 110 | 0.5% |
| Germany | 55 | 0.3% |
| Jamaica | 27 | 0.1% |
| Kenya | 13 | 0.1% |
| Korea | 19 | 0.1% |
| Latin America | 171 | 0.8% |
| Mexico | 42 | 0.2% |
| North Macedonia | 55 | 0.3% |
| Peru | 20 | 0.1% |
| South America | 65 | 0.3% |
| South Eastern Asia | 15 | 0.1% |
| Thailand | 11 | 0.1% |
| Venezuela | 9 | 0.0% |
| Vietnam | 4 | 0.0% |
| Western Europe | 55 | 0.3% |
| Zimbabwe | 16 | 0.1% | View All 27 Rows |
Sex and Age in Anniston
Sex and Age in Anniston
The most populous age groups in Anniston are 65 to 69 Years (802 | 7.9%) for men and 60 to 64 Years (961 | 8.5%) for women.
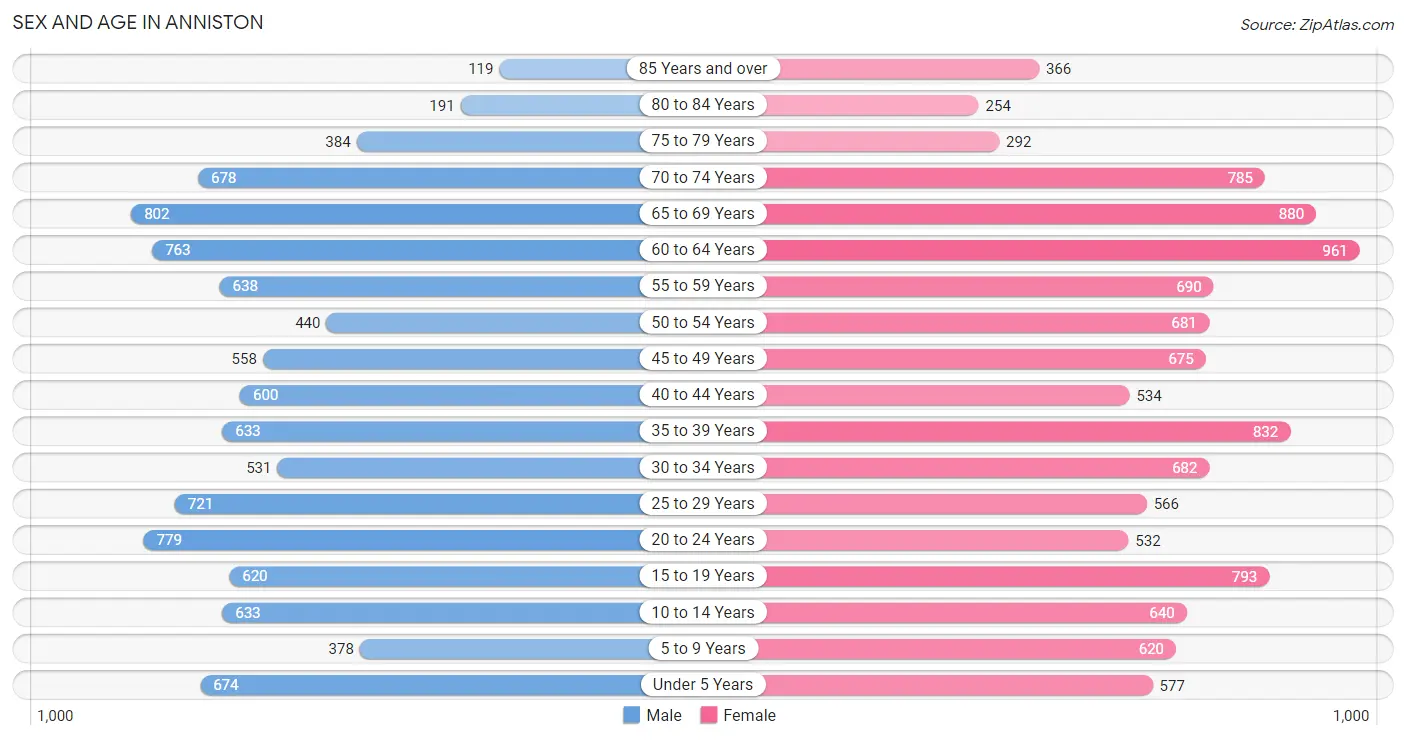
| Age Bracket | Male | Female |
| Under 5 Years | 674 (6.7%) | 577 (5.1%) |
| 5 to 9 Years | 378 (3.7%) | 620 (5.5%) |
| 10 to 14 Years | 633 (6.2%) | 640 (5.6%) |
| 15 to 19 Years | 620 (6.1%) | 793 (7.0%) |
| 20 to 24 Years | 779 (7.7%) | 532 (4.7%) |
| 25 to 29 Years | 721 (7.1%) | 566 (5.0%) |
| 30 to 34 Years | 531 (5.2%) | 682 (6.0%) |
| 35 to 39 Years | 633 (6.2%) | 832 (7.3%) |
| 40 to 44 Years | 600 (5.9%) | 534 (4.7%) |
| 45 to 49 Years | 558 (5.5%) | 675 (5.9%) |
| 50 to 54 Years | 440 (4.3%) | 681 (6.0%) |
| 55 to 59 Years | 638 (6.3%) | 690 (6.1%) |
| 60 to 64 Years | 763 (7.5%) | 961 (8.5%) |
| 65 to 69 Years | 802 (7.9%) | 880 (7.7%) |
| 70 to 74 Years | 678 (6.7%) | 785 (6.9%) |
| 75 to 79 Years | 384 (3.8%) | 292 (2.6%) |
| 80 to 84 Years | 191 (1.9%) | 254 (2.2%) |
| 85 Years and over | 119 (1.2%) | 366 (3.2%) |
| Total | 10,142 (100.0%) | 11,360 (100.0%) |
Families and Households in Anniston
Median Family Size in Anniston
The median family size in Anniston is 2.93 persons per family, with single female/mother families (1,435 | 27.4%) accounting for the largest median family size of 3.41 persons per family. On the other hand, married-couple families (3,190 | 60.9%) represent the smallest median family size with 2.71 persons per family.
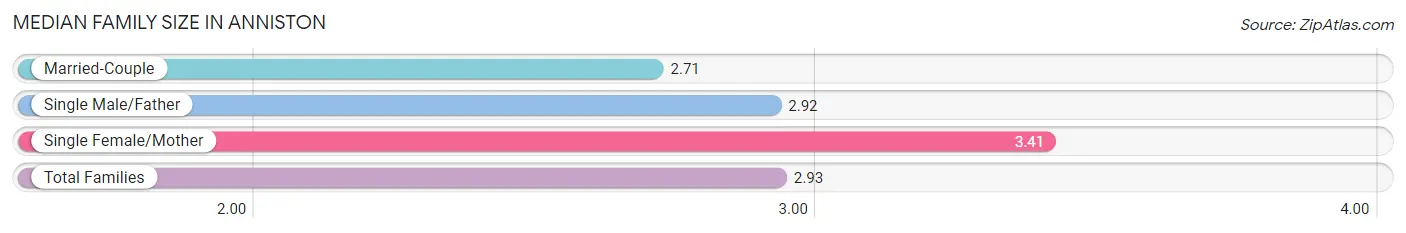
| Family Type | # Families | Family Size |
| Married-Couple | 3,190 (60.9%) | 2.71 |
| Single Male/Father | 610 (11.7%) | 2.92 |
| Single Female/Mother | 1,435 (27.4%) | 3.41 |
| Total Families | 5,235 (100.0%) | 2.93 |
Median Household Size in Anniston
The median household size in Anniston is 2.16 persons per household, with single female/mother households (1,435 | 15.1%) accounting for the largest median household size of 3.56 persons per household. non-family households (4,238 | 44.7%) represent the smallest median household size with 1.12 persons per household.
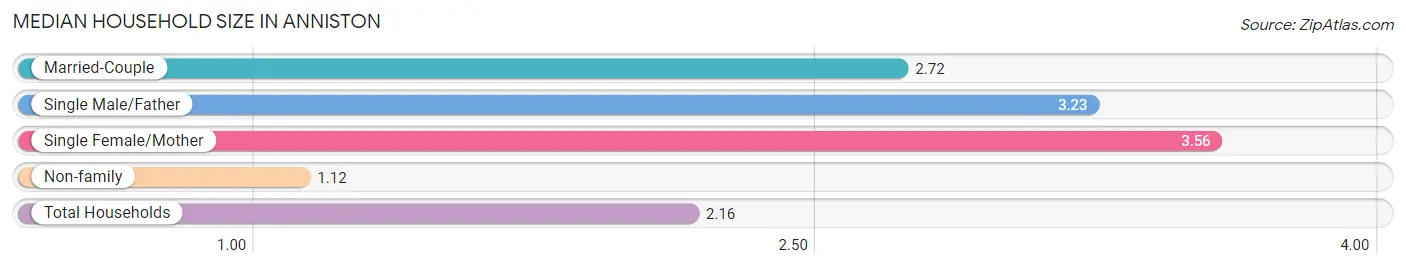
| Household Type | # Households | Household Size |
| Married-Couple | 3,190 (33.7%) | 2.72 |
| Single Male/Father | 610 (6.4%) | 3.23 |
| Single Female/Mother | 1,435 (15.1%) | 3.56 |
| Non-family | 4,238 (44.7%) | 1.12 |
| Total Households | 9,473 (100.0%) | 2.16 |
Household Size by Marriage Status in Anniston
Out of a total of 9,473 households in Anniston, 5,235 (55.3%) are family households, while 4,238 (44.7%) are nonfamily households. The most numerous type of family households are 2-person households, comprising 2,976, and the most common type of nonfamily households are 1-person households, comprising 3,846.
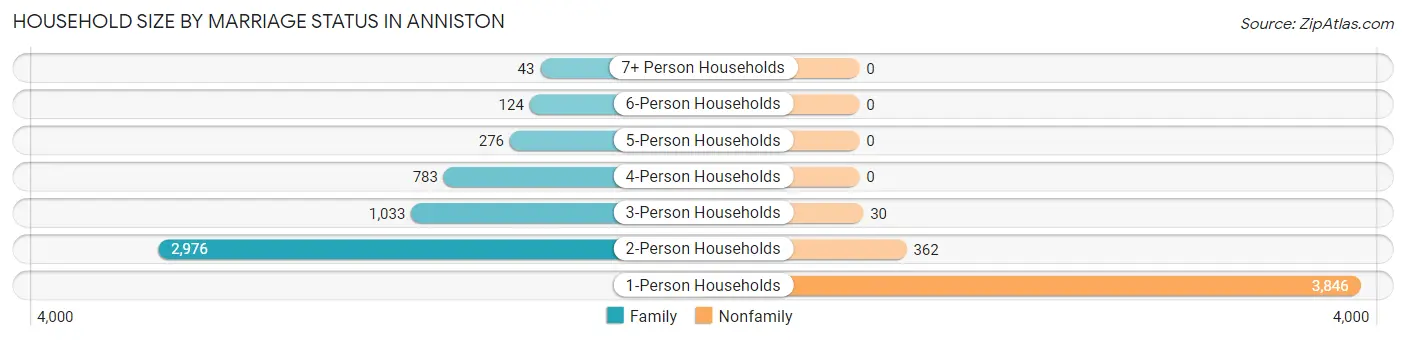
| Household Size | Family Households | Nonfamily Households |
| 1-Person Households | - | 3,846 (40.6%) |
| 2-Person Households | 2,976 (31.4%) | 362 (3.8%) |
| 3-Person Households | 1,033 (10.9%) | 30 (0.3%) |
| 4-Person Households | 783 (8.3%) | 0 (0.0%) |
| 5-Person Households | 276 (2.9%) | 0 (0.0%) |
| 6-Person Households | 124 (1.3%) | 0 (0.0%) |
| 7+ Person Households | 43 (0.4%) | 0 (0.0%) |
| Total | 5,235 (55.3%) | 4,238 (44.7%) |
Female Fertility in Anniston
Fertility by Age in Anniston
Average fertility rate in Anniston is 61.0 births per 1,000 women. Women in the age bracket of 20 to 34 years have the highest fertility rate with 143.0 births per 1,000 women. Women in the age bracket of 20 to 34 years acount for 87.0% of all women with births.
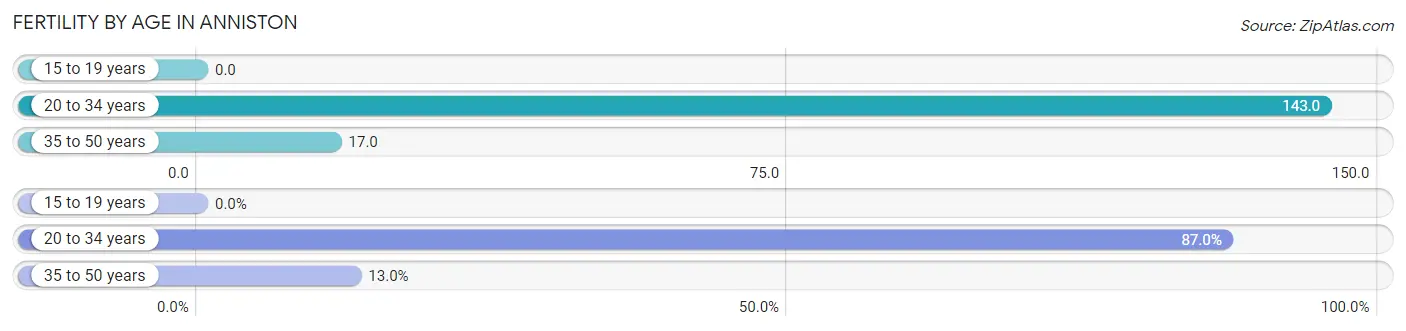
| Age Bracket | Women with Births | Births / 1,000 Women |
| 15 to 19 years | 0 (0.0%) | 0.0 |
| 20 to 34 years | 254 (87.0%) | 143.0 |
| 35 to 50 years | 38 (13.0%) | 17.0 |
| Total | 292 (100.0%) | 61.0 |
Fertility by Age by Marriage Status in Anniston
6.8% of women with births (292) in Anniston are married. The highest percentage of unmarried women with births falls into 35 to 50 years age bracket with 100.0% of them unmarried at the time of birth, while the lowest percentage of unmarried women with births belong to 20 to 34 years age bracket with 92.1% of them unmarried.
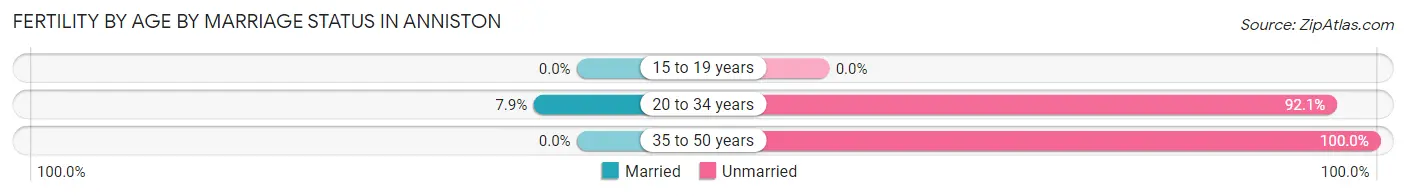
| Age Bracket | Married | Unmarried |
| 15 to 19 years | 0 (0.0%) | 0 (0.0%) |
| 20 to 34 years | 20 (7.9%) | 234 (92.1%) |
| 35 to 50 years | 0 (0.0%) | 38 (100.0%) |
| Total | 20 (6.9%) | 272 (93.1%) |
Fertility by Education in Anniston
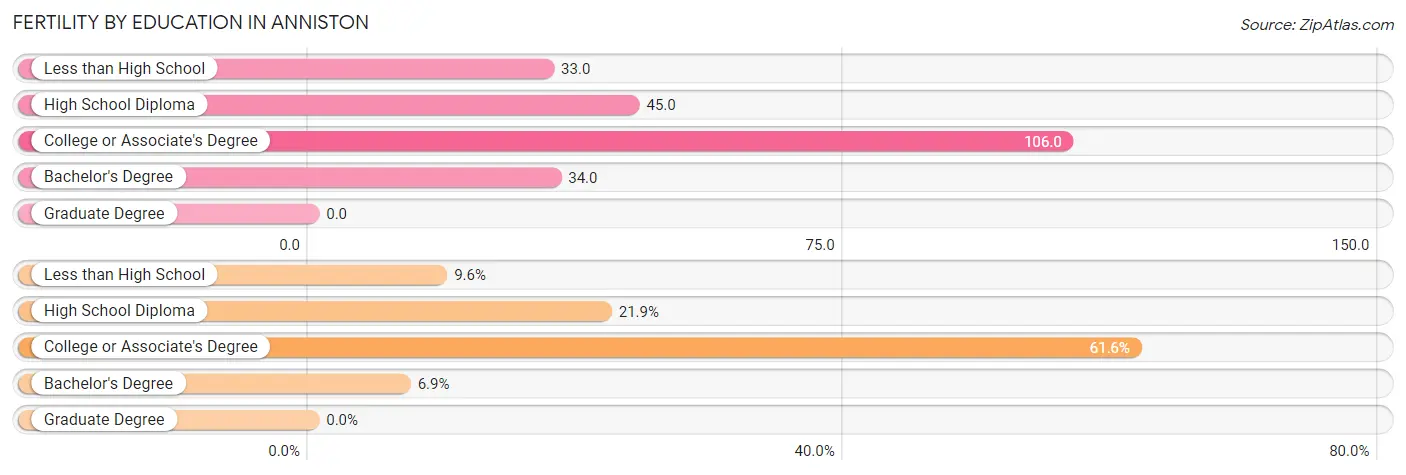
| Educational Attainment | Women with Births | Births / 1,000 Women |
| Less than High School | 28 (9.6%) | 33.0 |
| High School Diploma | 64 (21.9%) | 45.0 |
| College or Associate's Degree | 180 (61.6%) | 106.0 |
| Bachelor's Degree | 20 (6.9%) | 34.0 |
| Graduate Degree | 0 (0.0%) | 0.0 |
| Total | 292 (100.0%) | 61.0 |
Fertility by Education by Marriage Status in Anniston
93.1% of women with births in Anniston are unmarried. Women with the educational attainment of bachelor's degree are most likely to be married with 100.0% of them married at childbirth, while women with the educational attainment of less than high school are least likely to be married with 100.0% of them unmarried at childbirth.
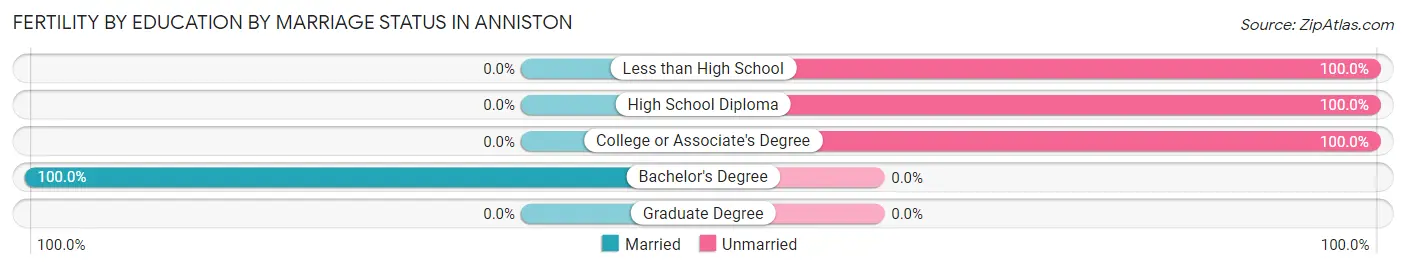
| Educational Attainment | Married | Unmarried |
| Less than High School | 0 (0.0%) | 28 (100.0%) |
| High School Diploma | 0 (0.0%) | 64 (100.0%) |
| College or Associate's Degree | 0 (0.0%) | 180 (100.0%) |
| Bachelor's Degree | 20 (100.0%) | 0 (0.0%) |
| Graduate Degree | 0 (0.0%) | 0 (0.0%) |
| Total | 20 (6.9%) | 272 (93.1%) |
Employment Characteristics in Anniston
Employment by Class of Employer in Anniston
Among the 8,514 employed individuals in Anniston, private company employees (5,945 | 69.8%), not-for-profit organizations (615 | 7.2%), and local government employees (551 | 6.5%) make up the most common classes of employment.
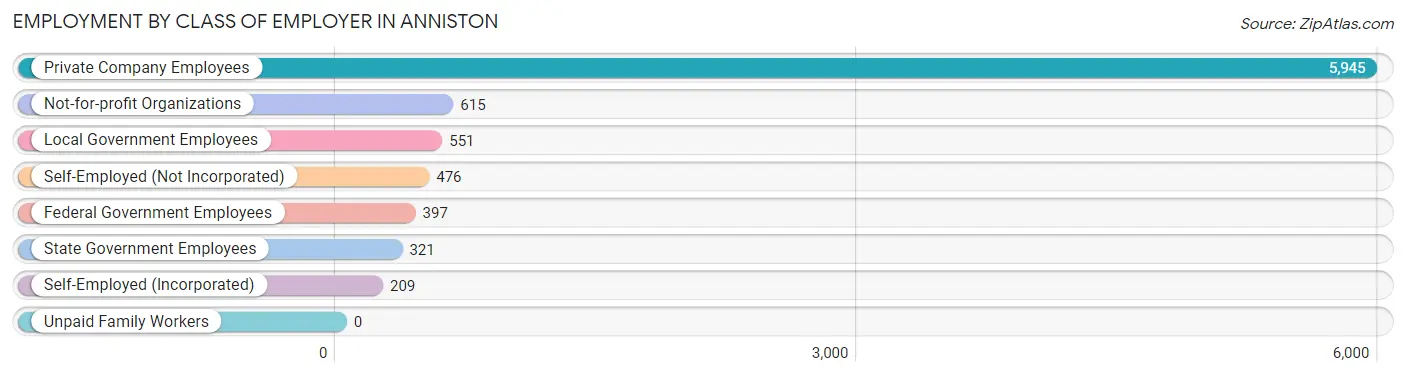
| Employer Class | # Employees | % Employees |
| Private Company Employees | 5,945 | 69.8% |
| Self-Employed (Incorporated) | 209 | 2.5% |
| Self-Employed (Not Incorporated) | 476 | 5.6% |
| Not-for-profit Organizations | 615 | 7.2% |
| Local Government Employees | 551 | 6.5% |
| State Government Employees | 321 | 3.8% |
| Federal Government Employees | 397 | 4.7% |
| Unpaid Family Workers | 0 | 0.0% |
| Total | 8,514 | 100.0% |
Employment Status by Age in Anniston
According to the labor force statistics for Anniston, out of the total population over 16 years of age (17,808), 51.5% or 9,171 individuals are in the labor force, with 5.5% or 504 of them unemployed. The age group with the highest labor force participation rate is 20 to 24 years, with 80.4% or 1,054 individuals in the labor force. Within the labor force, the 30 to 34 years age range has the highest percentage of unemployed individuals, with 10.5% or 100 of them being unemployed.
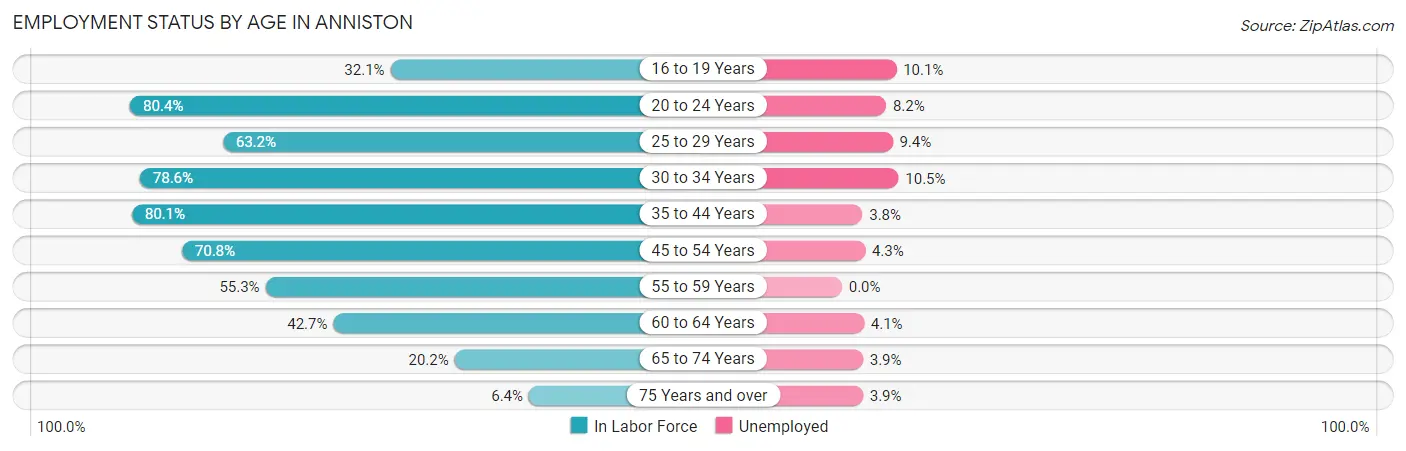
| Age Bracket | In Labor Force | Unemployed |
| 16 to 19 Years | 398 (32.1%) | 40 (10.1%) |
| 20 to 24 Years | 1,054 (80.4%) | 86 (8.2%) |
| 25 to 29 Years | 813 (63.2%) | 76 (9.4%) |
| 30 to 34 Years | 953 (78.6%) | 100 (10.5%) |
| 35 to 44 Years | 2,082 (80.1%) | 79 (3.8%) |
| 45 to 54 Years | 1,667 (70.8%) | 72 (4.3%) |
| 55 to 59 Years | 734 (55.3%) | 0 (0.0%) |
| 60 to 64 Years | 736 (42.7%) | 30 (4.1%) |
| 65 to 74 Years | 635 (20.2%) | 25 (3.9%) |
| 75 Years and over | 103 (6.4%) | 4 (3.9%) |
| Total | 9,171 (51.5%) | 504 (5.5%) |
Employment Status by Educational Attainment in Anniston
According to labor force statistics for Anniston, 66.5% of individuals (6,986) out of the total population between 25 and 64 years of age (10,505) are in the labor force, with 5.1% or 356 of them being unemployed. The group with the highest labor force participation rate are those with the educational attainment of bachelor's degree or higher, with 88.2% or 1,767 individuals in the labor force. Within the labor force, individuals with less than high school education have the highest percentage of unemployment, with 13.9% or 83 of them being unemployed.
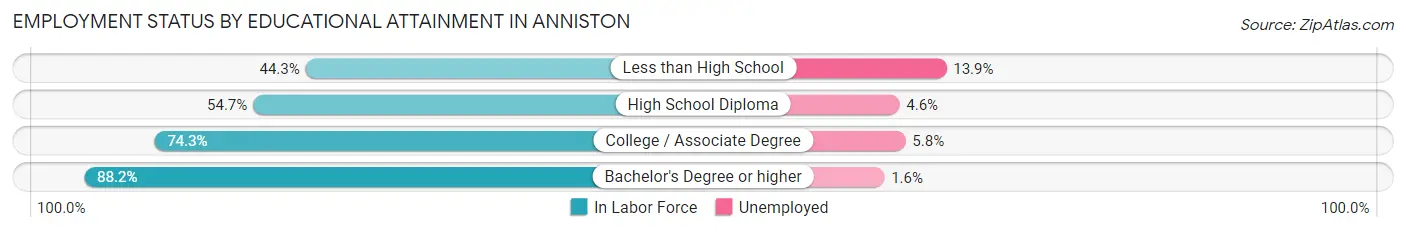
| Educational Attainment | In Labor Force | Unemployed |
| Less than High School | 595 (44.3%) | 187 (13.9%) |
| High School Diploma | 1,936 (54.7%) | 163 (4.6%) |
| College / Associate Degree | 2,688 (74.3%) | 210 (5.8%) |
| Bachelor's Degree or higher | 1,767 (88.2%) | 32 (1.6%) |
| Total | 6,986 (66.5%) | 536 (5.1%) |
Employment Occupations by Sex in Anniston
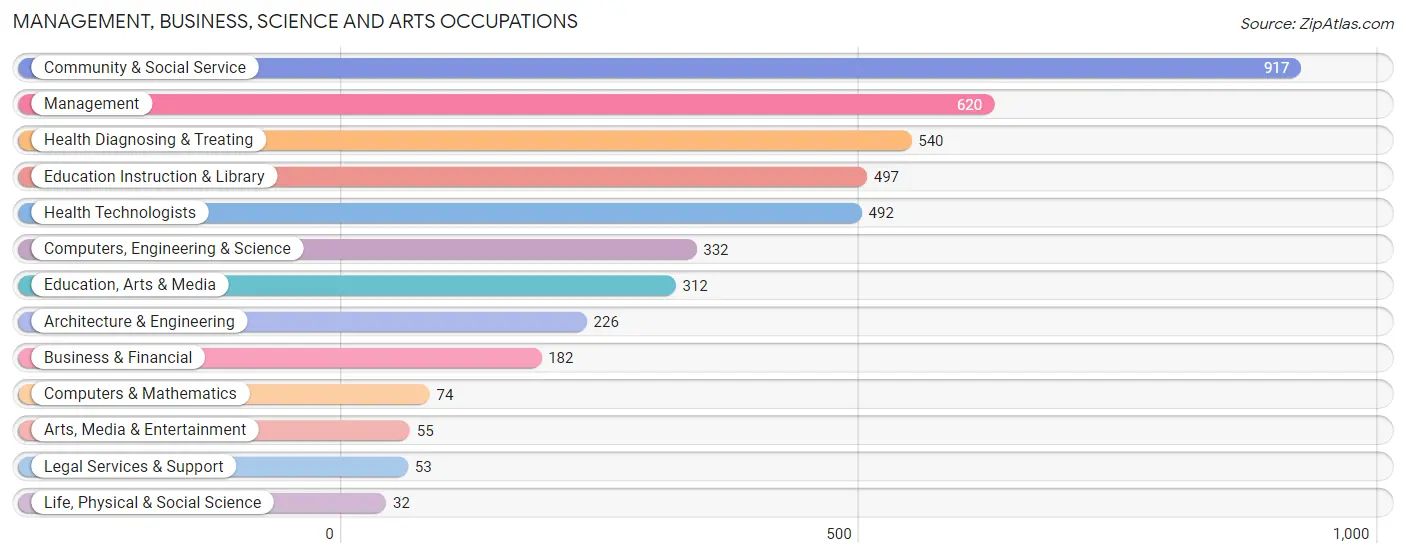
Management, Business, Science and Arts Occupations
The most common Management, Business, Science and Arts occupations in Anniston are Community & Social Service (917 | 10.8%), Management (620 | 7.3%), Health Diagnosing & Treating (540 | 6.3%), Education Instruction & Library (497 | 5.8%), and Health Technologists (492 | 5.8%).
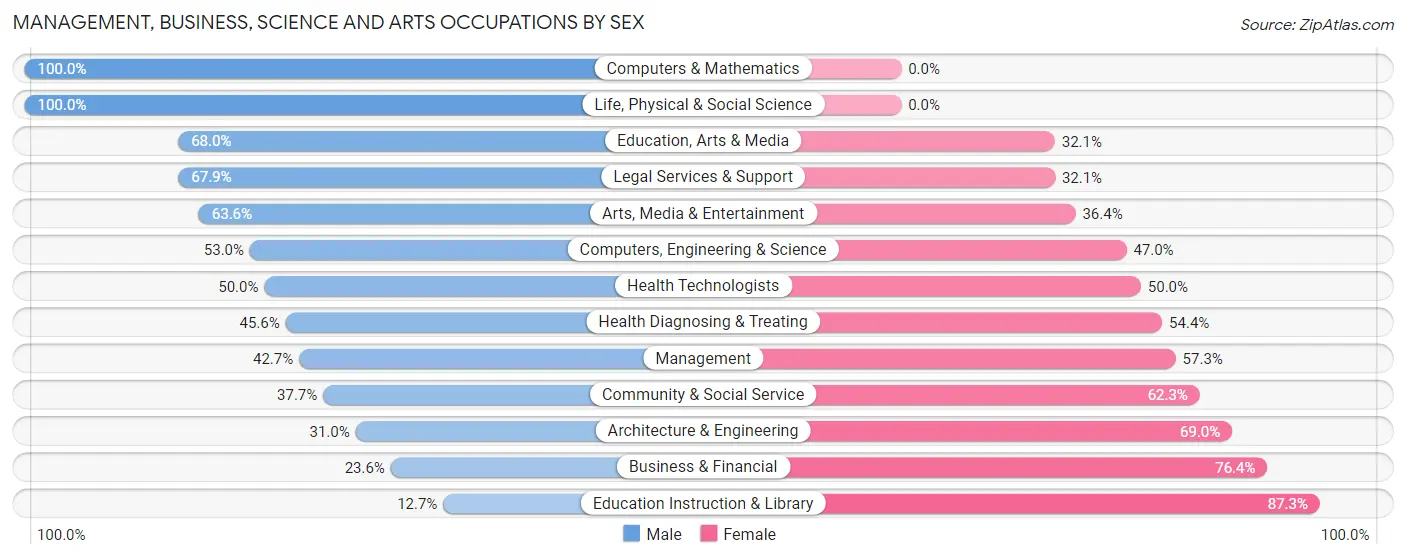
Management, Business, Science and Arts Occupations by Sex
Within the Management, Business, Science and Arts occupations in Anniston, the most male-oriented occupations are Computers & Mathematics (100.0%), Life, Physical & Social Science (100.0%), and Education, Arts & Media (67.9%), while the most female-oriented occupations are Education Instruction & Library (87.3%), Business & Financial (76.4%), and Architecture & Engineering (69.0%).
| Occupation | Male | Female |
| Management | 265 (42.7%) | 355 (57.3%) |
| Business & Financial | 43 (23.6%) | 139 (76.4%) |
| Computers, Engineering & Science | 176 (53.0%) | 156 (47.0%) |
| Computers & Mathematics | 74 (100.0%) | 0 (0.0%) |
| Architecture & Engineering | 70 (31.0%) | 156 (69.0%) |
| Life, Physical & Social Science | 32 (100.0%) | 0 (0.0%) |
| Community & Social Service | 346 (37.7%) | 571 (62.3%) |
| Education, Arts & Media | 212 (67.9%) | 100 (32.1%) |
| Legal Services & Support | 36 (67.9%) | 17 (32.1%) |
| Education Instruction & Library | 63 (12.7%) | 434 (87.3%) |
| Arts, Media & Entertainment | 35 (63.6%) | 20 (36.4%) |
| Health Diagnosing & Treating | 246 (45.6%) | 294 (54.4%) |
| Health Technologists | 246 (50.0%) | 246 (50.0%) |
| Total (Category) | 1,076 (41.5%) | 1,515 (58.5%) |
| Total (Overall) | 4,500 (52.8%) | 4,015 (47.1%) |
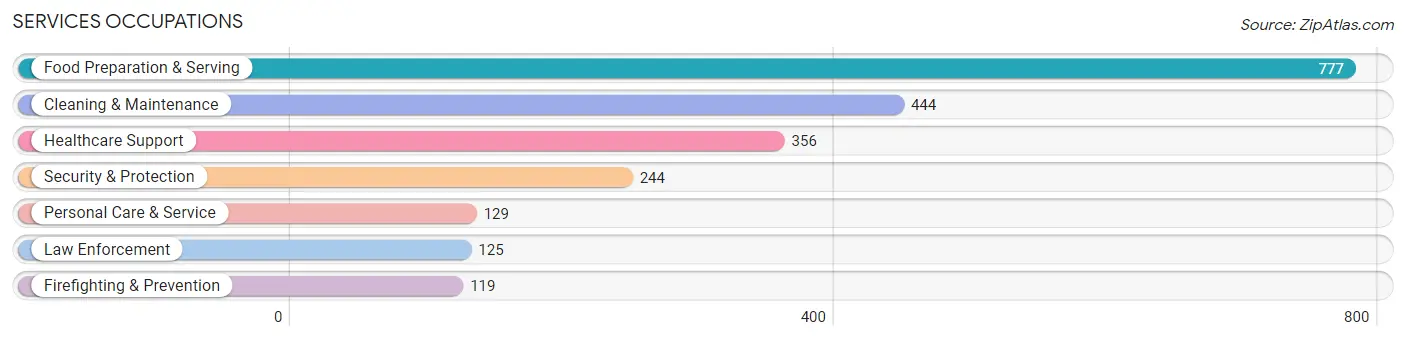
Services Occupations
The most common Services occupations in Anniston are Food Preparation & Serving (777 | 9.1%), Cleaning & Maintenance (444 | 5.2%), Healthcare Support (356 | 4.2%), Security & Protection (244 | 2.9%), and Personal Care & Service (129 | 1.5%).
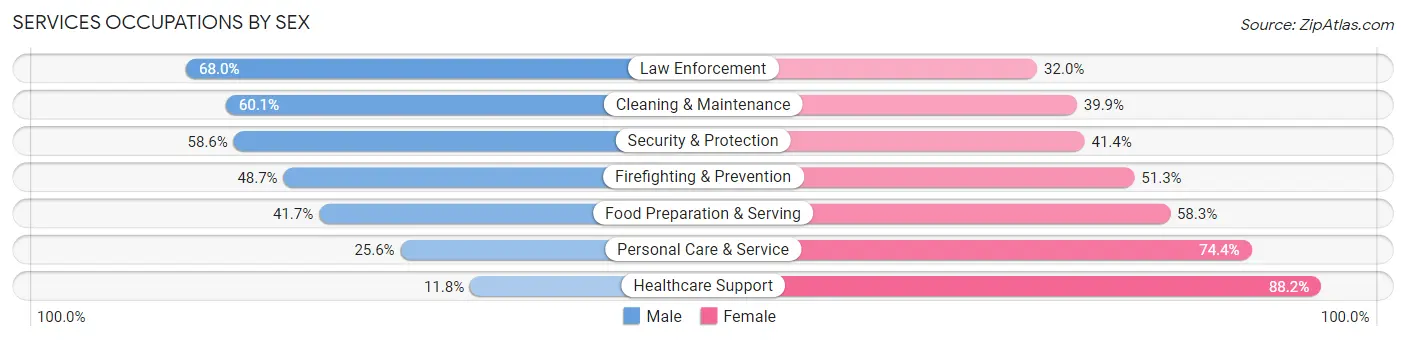
Services Occupations by Sex
Within the Services occupations in Anniston, the most male-oriented occupations are Law Enforcement (68.0%), Cleaning & Maintenance (60.1%), and Security & Protection (58.6%), while the most female-oriented occupations are Healthcare Support (88.2%), Personal Care & Service (74.4%), and Food Preparation & Serving (58.3%).
| Occupation | Male | Female |
| Healthcare Support | 42 (11.8%) | 314 (88.2%) |
| Security & Protection | 143 (58.6%) | 101 (41.4%) |
| Firefighting & Prevention | 58 (48.7%) | 61 (51.3%) |
| Law Enforcement | 85 (68.0%) | 40 (32.0%) |
| Food Preparation & Serving | 324 (41.7%) | 453 (58.3%) |
| Cleaning & Maintenance | 267 (60.1%) | 177 (39.9%) |
| Personal Care & Service | 33 (25.6%) | 96 (74.4%) |
| Total (Category) | 809 (41.5%) | 1,141 (58.5%) |
| Total (Overall) | 4,500 (52.8%) | 4,015 (47.1%) |
Sales and Office Occupations
The most common Sales and Office occupations in Anniston are Sales & Related (672 | 7.9%), and Office & Administration (606 | 7.1%).
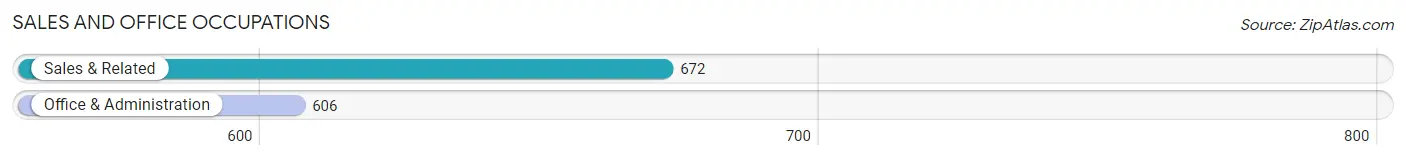
Sales and Office Occupations by Sex
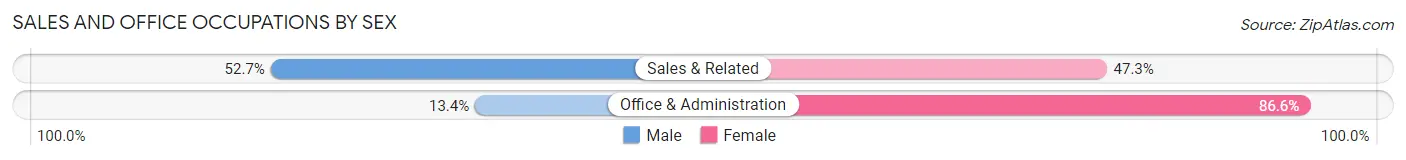
| Occupation | Male | Female |
| Sales & Related | 354 (52.7%) | 318 (47.3%) |
| Office & Administration | 81 (13.4%) | 525 (86.6%) |
| Total (Category) | 435 (34.0%) | 843 (66.0%) |
| Total (Overall) | 4,500 (52.8%) | 4,015 (47.1%) |
Natural Resources, Construction and Maintenance Occupations
The most common Natural Resources, Construction and Maintenance occupations in Anniston are Construction & Extraction (386 | 4.5%), Installation, Maintenance & Repair (258 | 3.0%), and Farming, Fishing & Forestry (31 | 0.4%).
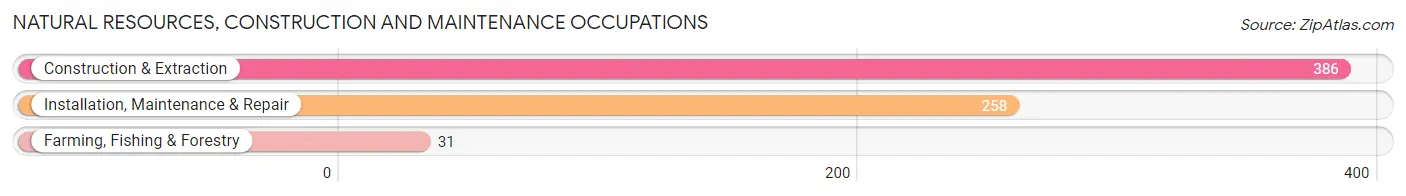
Natural Resources, Construction and Maintenance Occupations by Sex
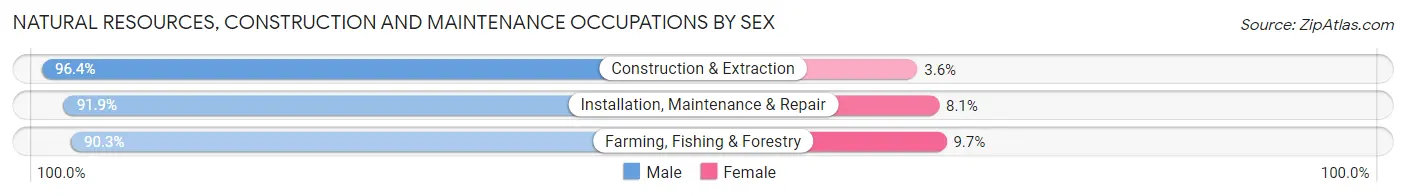
| Occupation | Male | Female |
| Farming, Fishing & Forestry | 28 (90.3%) | 3 (9.7%) |
| Construction & Extraction | 372 (96.4%) | 14 (3.6%) |
| Installation, Maintenance & Repair | 237 (91.9%) | 21 (8.1%) |
| Total (Category) | 637 (94.4%) | 38 (5.6%) |
| Total (Overall) | 4,500 (52.8%) | 4,015 (47.1%) |
Production, Transportation and Moving Occupations
The most common Production, Transportation and Moving occupations in Anniston are Production (1,136 | 13.3%), Material Moving (512 | 6.0%), and Transportation (373 | 4.4%).
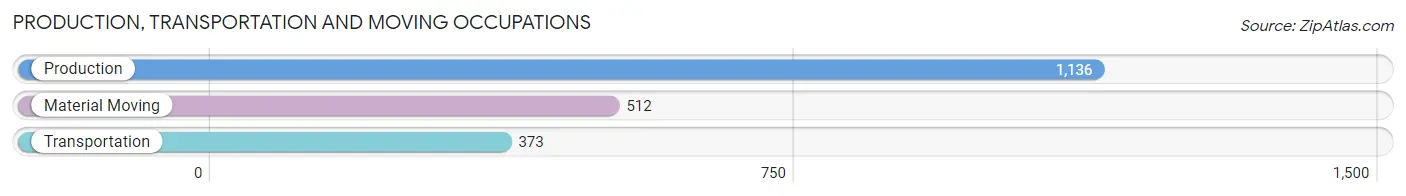
Production, Transportation and Moving Occupations by Sex
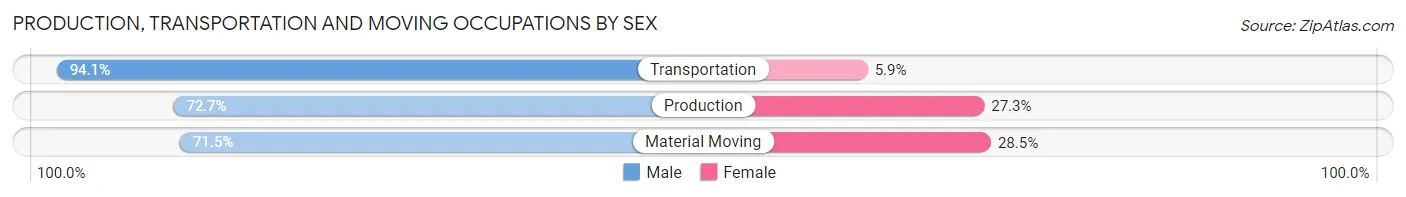
| Occupation | Male | Female |
| Production | 826 (72.7%) | 310 (27.3%) |
| Transportation | 351 (94.1%) | 22 (5.9%) |
| Material Moving | 366 (71.5%) | 146 (28.5%) |
| Total (Category) | 1,543 (76.3%) | 478 (23.6%) |
| Total (Overall) | 4,500 (52.8%) | 4,015 (47.1%) |
Employment Industries by Sex in Anniston
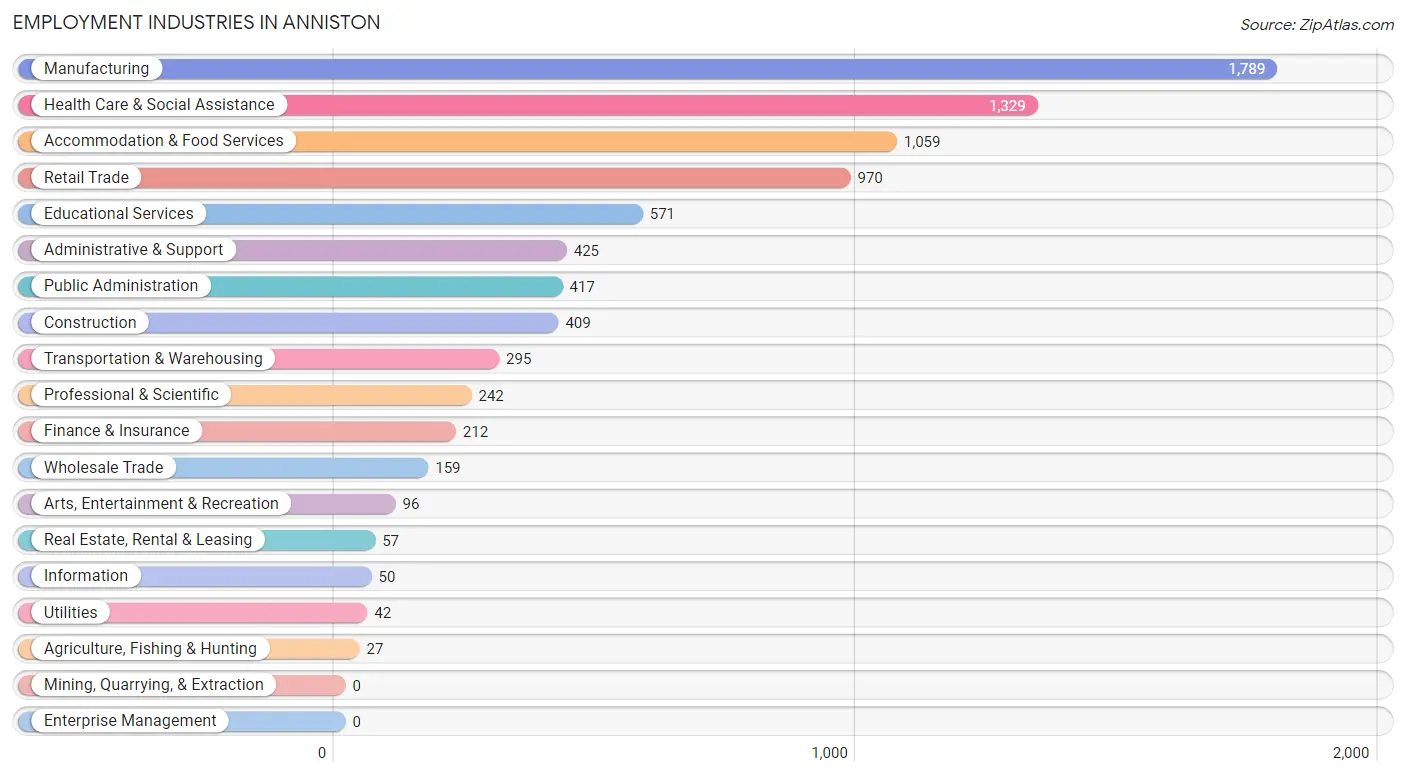
Employment Industries in Anniston
The major employment industries in Anniston include Manufacturing (1,789 | 21.0%), Health Care & Social Assistance (1,329 | 15.6%), Accommodation & Food Services (1,059 | 12.4%), Retail Trade (970 | 11.4%), and Educational Services (571 | 6.7%).
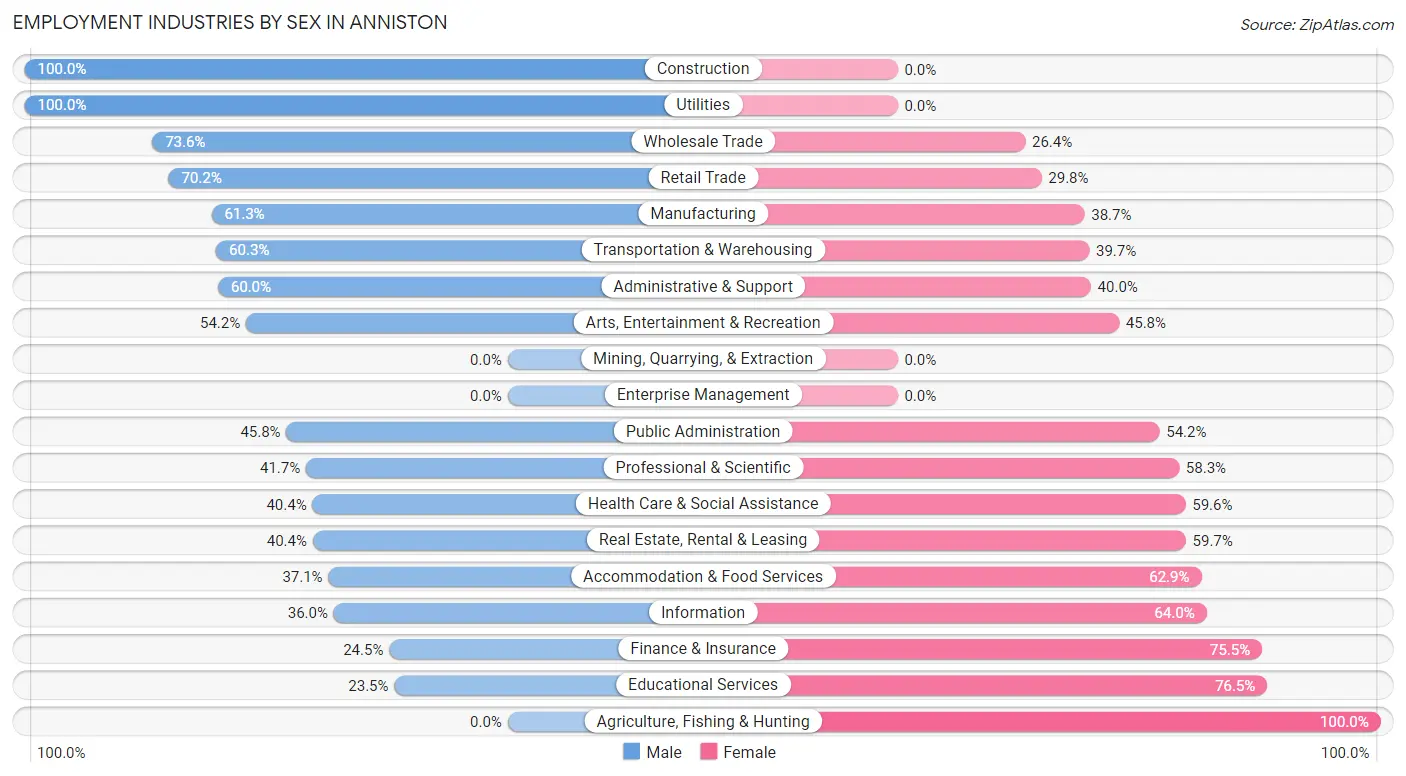
Employment Industries by Sex in Anniston
The Anniston industries that see more men than women are Construction (100.0%), Utilities (100.0%), and Wholesale Trade (73.6%), whereas the industries that tend to have a higher number of women are Agriculture, Fishing & Hunting (100.0%), Educational Services (76.5%), and Finance & Insurance (75.5%).
| Industry | Male | Female |
| Agriculture, Fishing & Hunting | 0 (0.0%) | 27 (100.0%) |
| Mining, Quarrying, & Extraction | 0 (0.0%) | 0 (0.0%) |
| Construction | 409 (100.0%) | 0 (0.0%) |
| Manufacturing | 1,097 (61.3%) | 692 (38.7%) |
| Wholesale Trade | 117 (73.6%) | 42 (26.4%) |
| Retail Trade | 681 (70.2%) | 289 (29.8%) |
| Transportation & Warehousing | 178 (60.3%) | 117 (39.7%) |
| Utilities | 42 (100.0%) | 0 (0.0%) |
| Information | 18 (36.0%) | 32 (64.0%) |
| Finance & Insurance | 52 (24.5%) | 160 (75.5%) |
| Real Estate, Rental & Leasing | 23 (40.4%) | 34 (59.7%) |
| Professional & Scientific | 101 (41.7%) | 141 (58.3%) |
| Enterprise Management | 0 (0.0%) | 0 (0.0%) |
| Administrative & Support | 255 (60.0%) | 170 (40.0%) |
| Educational Services | 134 (23.5%) | 437 (76.5%) |
| Health Care & Social Assistance | 537 (40.4%) | 792 (59.6%) |
| Arts, Entertainment & Recreation | 52 (54.2%) | 44 (45.8%) |
| Accommodation & Food Services | 393 (37.1%) | 666 (62.9%) |
| Public Administration | 191 (45.8%) | 226 (54.2%) |
| Total | 4,500 (52.8%) | 4,015 (47.1%) |
Education in Anniston
School Enrollment in Anniston
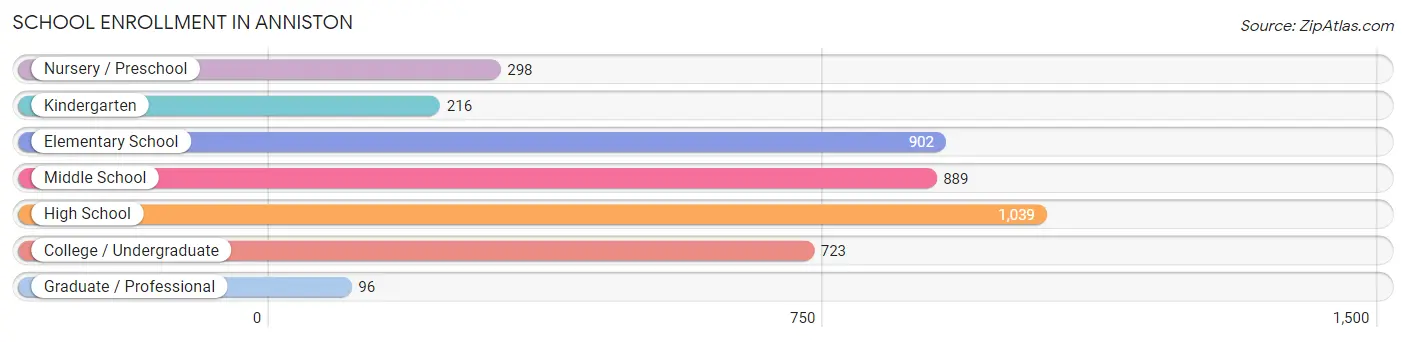
The most common levels of schooling among the 4,163 students in Anniston are high school (1,039 | 25.0%), elementary school (902 | 21.7%), and middle school (889 | 21.3%).
| School Level | # Students | % Students |
| Nursery / Preschool | 298 | 7.2% |
| Kindergarten | 216 | 5.2% |
| Elementary School | 902 | 21.7% |
| Middle School | 889 | 21.3% |
| High School | 1,039 | 25.0% |
| College / Undergraduate | 723 | 17.4% |
| Graduate / Professional | 96 | 2.3% |
| Total | 4,163 | 100.0% |
School Enrollment by Age by Funding Source in Anniston
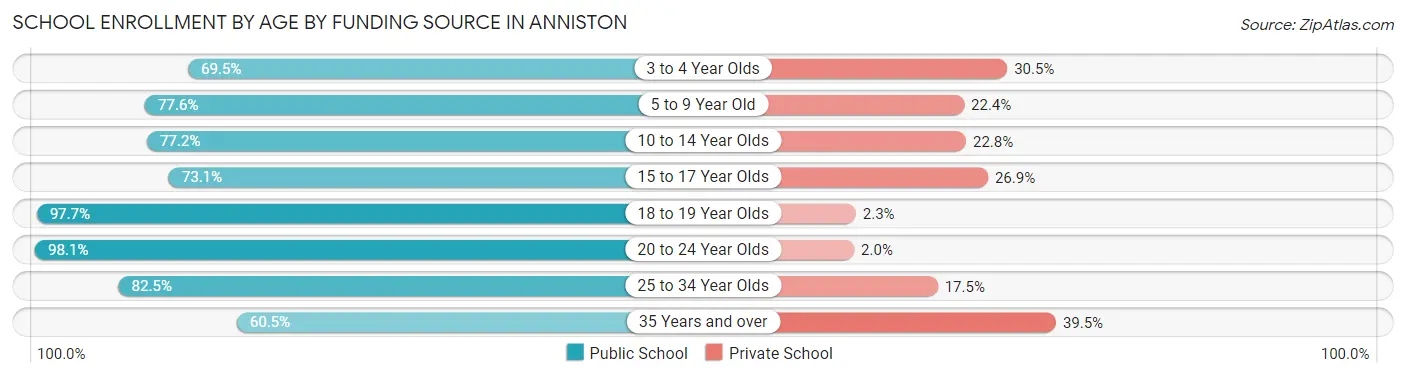
Out of a total of 4,163 students who are enrolled in schools in Anniston, 916 (22.0%) attend a private institution, while the remaining 3,247 (78.0%) are enrolled in public schools. The age group of 35 years and over has the highest likelihood of being enrolled in private schools, with 121 (39.5% in the age bracket) enrolled. Conversely, the age group of 20 to 24 year olds has the lowest likelihood of being enrolled in a private school, with 302 (98.1% in the age bracket) attending a public institution.
| Age Bracket | Public School | Private School |
| 3 to 4 Year Olds | 226 (69.5%) | 99 (30.5%) |
| 5 to 9 Year Old | 678 (77.6%) | 196 (22.4%) |
| 10 to 14 Year Olds | 948 (77.2%) | 280 (22.8%) |
| 15 to 17 Year Olds | 495 (73.1%) | 182 (26.9%) |
| 18 to 19 Year Olds | 301 (97.7%) | 7 (2.3%) |
| 20 to 24 Year Olds | 302 (98.1%) | 6 (1.9%) |
| 25 to 34 Year Olds | 113 (82.5%) | 24 (17.5%) |
| 35 Years and over | 185 (60.5%) | 121 (39.5%) |
| Total | 3,247 (78.0%) | 916 (22.0%) |
Educational Attainment by Field of Study in Anniston
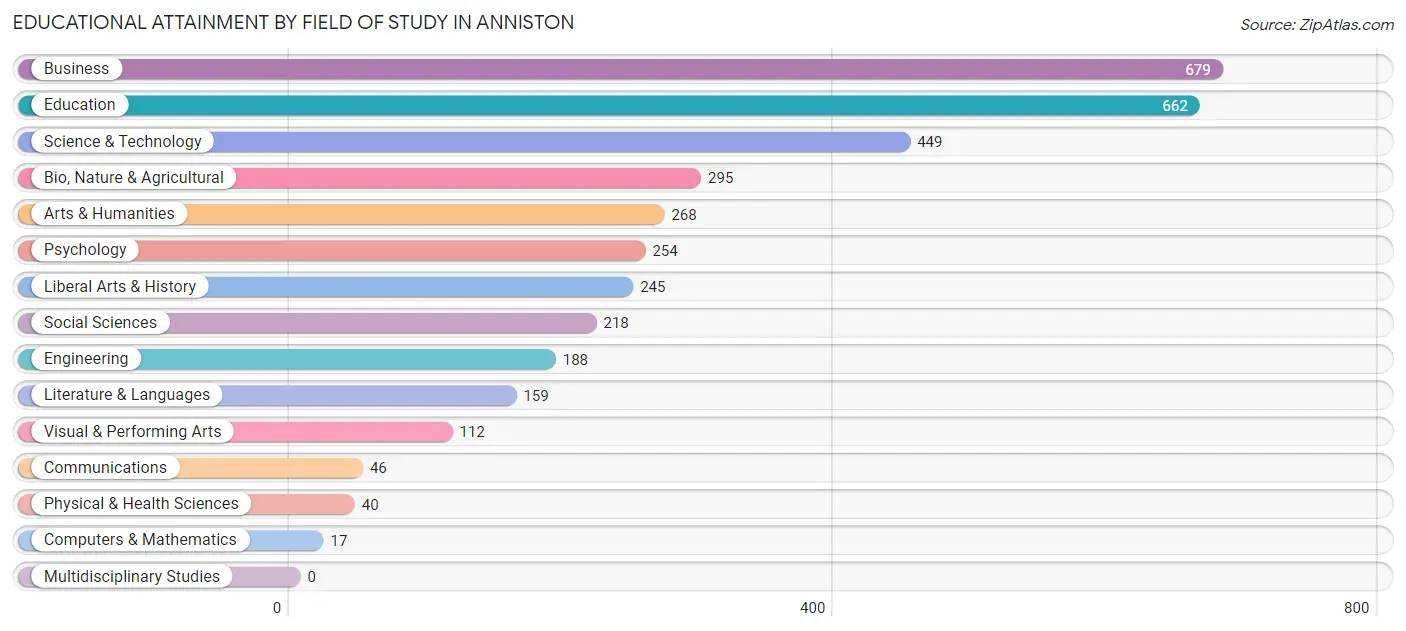
Business (679 | 18.7%), education (662 | 18.2%), science & technology (449 | 12.4%), bio, nature & agricultural (295 | 8.1%), and arts & humanities (268 | 7.4%) are the most common fields of study among 3,632 individuals in Anniston who have obtained a bachelor's degree or higher.
| Field of Study | # Graduates | % Graduates |
| Computers & Mathematics | 17 | 0.5% |
| Bio, Nature & Agricultural | 295 | 8.1% |
| Physical & Health Sciences | 40 | 1.1% |
| Psychology | 254 | 7.0% |
| Social Sciences | 218 | 6.0% |
| Engineering | 188 | 5.2% |
| Multidisciplinary Studies | 0 | 0.0% |
| Science & Technology | 449 | 12.4% |
| Business | 679 | 18.7% |
| Education | 662 | 18.2% |
| Literature & Languages | 159 | 4.4% |
| Liberal Arts & History | 245 | 6.8% |
| Visual & Performing Arts | 112 | 3.1% |
| Communications | 46 | 1.3% |
| Arts & Humanities | 268 | 7.4% |
| Total | 3,632 | 100.0% |
Transportation & Commute in Anniston
Vehicle Availability by Sex in Anniston
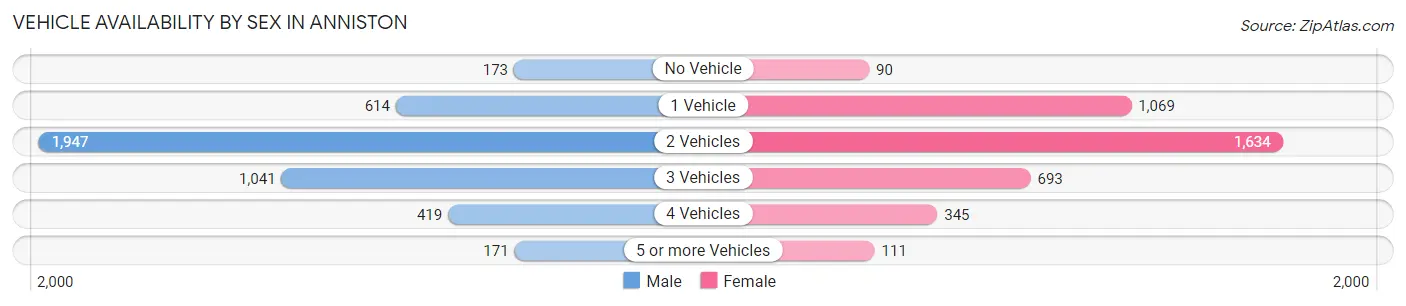
The most prevalent vehicle ownership categories in Anniston are males with 2 vehicles (1,947, accounting for 44.6%) and females with 2 vehicles (1,634, making up 49.4%).
| Vehicles Available | Male | Female |
| No Vehicle | 173 (4.0%) | 90 (2.3%) |
| 1 Vehicle | 614 (14.1%) | 1,069 (27.1%) |
| 2 Vehicles | 1,947 (44.6%) | 1,634 (41.4%) |
| 3 Vehicles | 1,041 (23.8%) | 693 (17.6%) |
| 4 Vehicles | 419 (9.6%) | 345 (8.7%) |
| 5 or more Vehicles | 171 (3.9%) | 111 (2.8%) |
| Total | 4,365 (100.0%) | 3,942 (100.0%) |
Commute Time in Anniston
The most frequently occuring commute durations in Anniston are 10 to 14 minutes (1,667 commuters, 20.7%), 15 to 19 minutes (1,277 commuters, 15.9%), and 20 to 24 minutes (1,185 commuters, 14.7%).
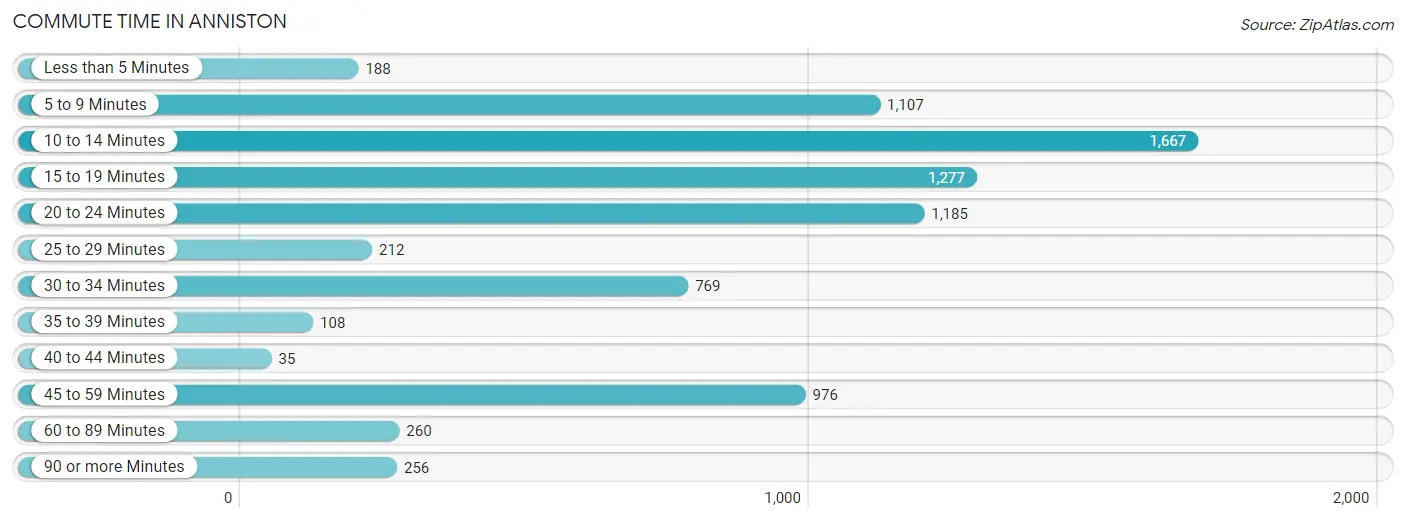
| Commute Time | # Commuters | % Commuters |
| Less than 5 Minutes | 188 | 2.3% |
| 5 to 9 Minutes | 1,107 | 13.8% |
| 10 to 14 Minutes | 1,667 | 20.7% |
| 15 to 19 Minutes | 1,277 | 15.9% |
| 20 to 24 Minutes | 1,185 | 14.7% |
| 25 to 29 Minutes | 212 | 2.6% |
| 30 to 34 Minutes | 769 | 9.6% |
| 35 to 39 Minutes | 108 | 1.3% |
| 40 to 44 Minutes | 35 | 0.4% |
| 45 to 59 Minutes | 976 | 12.1% |
| 60 to 89 Minutes | 260 | 3.2% |
| 90 or more Minutes | 256 | 3.2% |
Commute Time by Sex in Anniston
The most common commute times in Anniston are 10 to 14 minutes (838 commuters, 19.2%) for males and 10 to 14 minutes (829 commuters, 22.6%) for females.
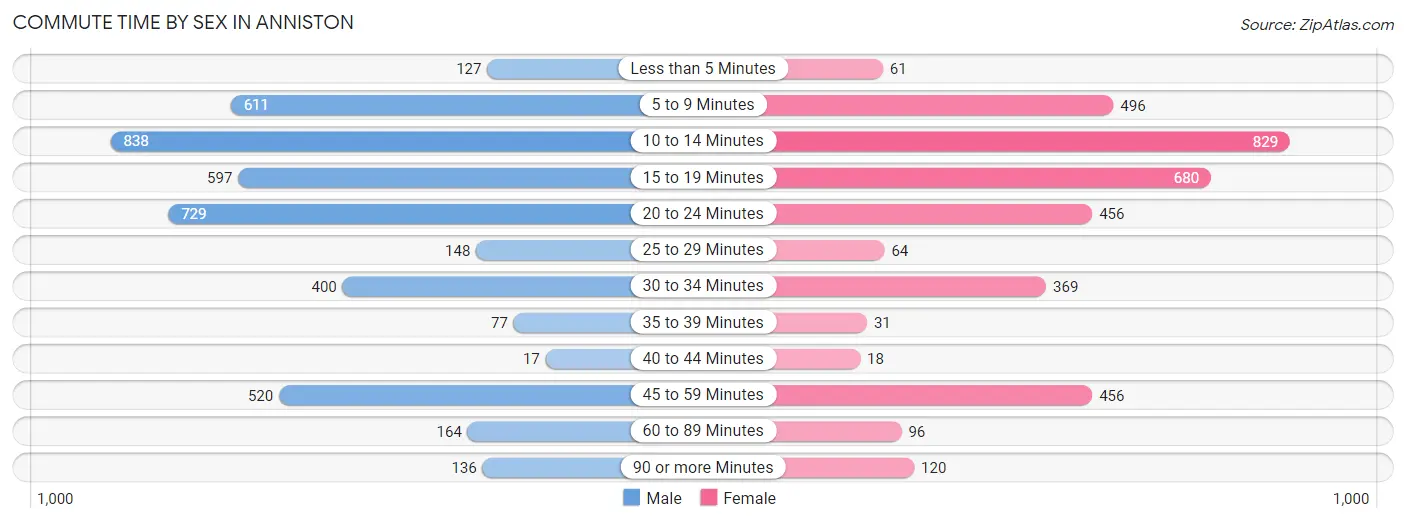
| Commute Time | Male | Female |
| Less than 5 Minutes | 127 (2.9%) | 61 (1.7%) |
| 5 to 9 Minutes | 611 (14.0%) | 496 (13.5%) |
| 10 to 14 Minutes | 838 (19.2%) | 829 (22.6%) |
| 15 to 19 Minutes | 597 (13.7%) | 680 (18.5%) |
| 20 to 24 Minutes | 729 (16.7%) | 456 (12.4%) |
| 25 to 29 Minutes | 148 (3.4%) | 64 (1.7%) |
| 30 to 34 Minutes | 400 (9.2%) | 369 (10.0%) |
| 35 to 39 Minutes | 77 (1.8%) | 31 (0.8%) |
| 40 to 44 Minutes | 17 (0.4%) | 18 (0.5%) |
| 45 to 59 Minutes | 520 (11.9%) | 456 (12.4%) |
| 60 to 89 Minutes | 164 (3.8%) | 96 (2.6%) |
| 90 or more Minutes | 136 (3.1%) | 120 (3.3%) |
Time of Departure to Work by Sex in Anniston
The most frequent times of departure to work in Anniston are 6:30 AM to 6:59 AM (644, 14.8%) for males and 6:30 AM to 6:59 AM (506, 13.8%) for females.
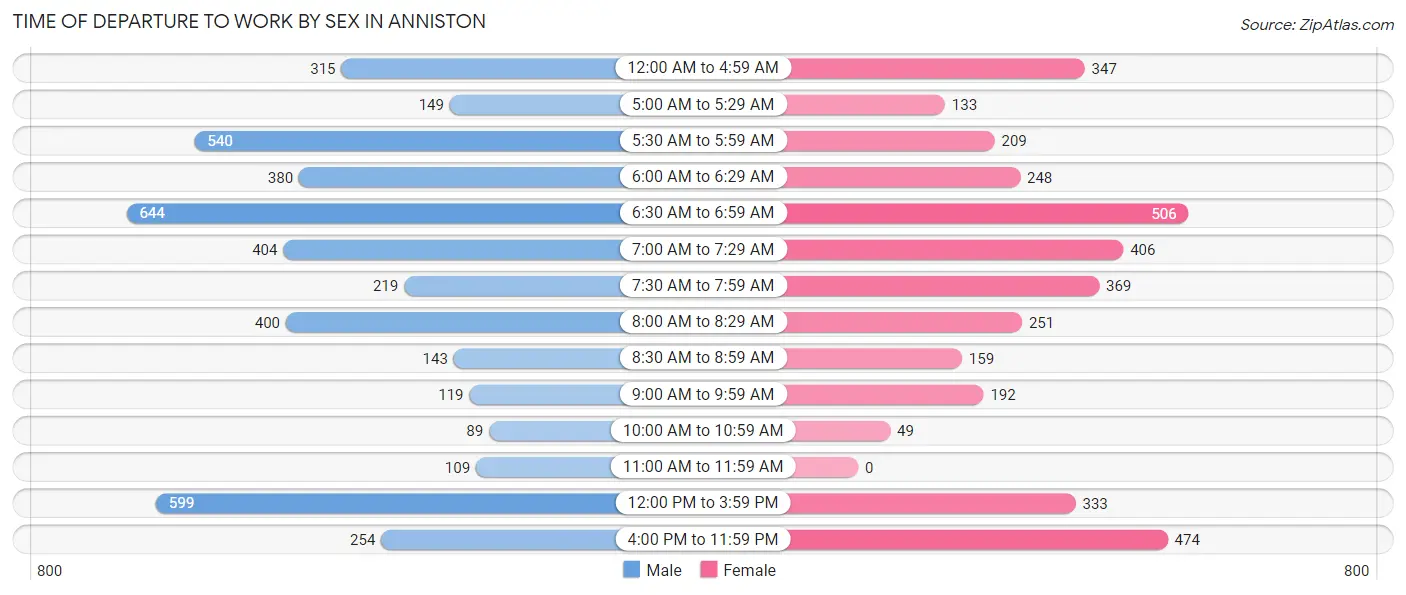
| Time of Departure | Male | Female |
| 12:00 AM to 4:59 AM | 315 (7.2%) | 347 (9.4%) |
| 5:00 AM to 5:29 AM | 149 (3.4%) | 133 (3.6%) |
| 5:30 AM to 5:59 AM | 540 (12.4%) | 209 (5.7%) |
| 6:00 AM to 6:29 AM | 380 (8.7%) | 248 (6.8%) |
| 6:30 AM to 6:59 AM | 644 (14.8%) | 506 (13.8%) |
| 7:00 AM to 7:29 AM | 404 (9.3%) | 406 (11.0%) |
| 7:30 AM to 7:59 AM | 219 (5.0%) | 369 (10.0%) |
| 8:00 AM to 8:29 AM | 400 (9.2%) | 251 (6.8%) |
| 8:30 AM to 8:59 AM | 143 (3.3%) | 159 (4.3%) |
| 9:00 AM to 9:59 AM | 119 (2.7%) | 192 (5.2%) |
| 10:00 AM to 10:59 AM | 89 (2.0%) | 49 (1.3%) |
| 11:00 AM to 11:59 AM | 109 (2.5%) | 0 (0.0%) |
| 12:00 PM to 3:59 PM | 599 (13.7%) | 333 (9.1%) |
| 4:00 PM to 11:59 PM | 254 (5.8%) | 474 (12.9%) |
| Total | 4,364 (100.0%) | 3,676 (100.0%) |
Housing Occupancy in Anniston
Occupancy by Ownership in Anniston
Of the total 9,473 dwellings in Anniston, owner-occupied units account for 5,810 (61.3%), while renter-occupied units make up 3,663 (38.7%).
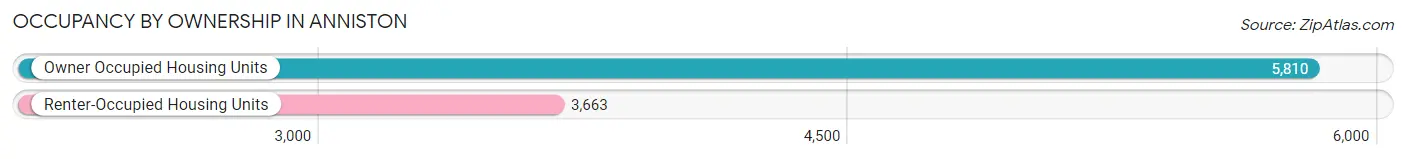
| Occupancy | # Housing Units | % Housing Units |
| Owner Occupied Housing Units | 5,810 | 61.3% |
| Renter-Occupied Housing Units | 3,663 | 38.7% |
| Total Occupied Housing Units | 9,473 | 100.0% |
Occupancy by Household Size in Anniston
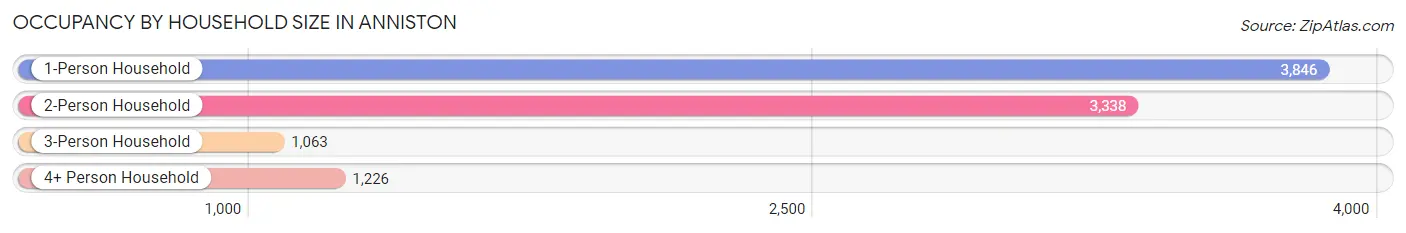
| Household Size | # Housing Units | % Housing Units |
| 1-Person Household | 3,846 | 40.6% |
| 2-Person Household | 3,338 | 35.2% |
| 3-Person Household | 1,063 | 11.2% |
| 4+ Person Household | 1,226 | 12.9% |
| Total Housing Units | 9,473 | 100.0% |
Occupancy by Ownership by Household Size in Anniston
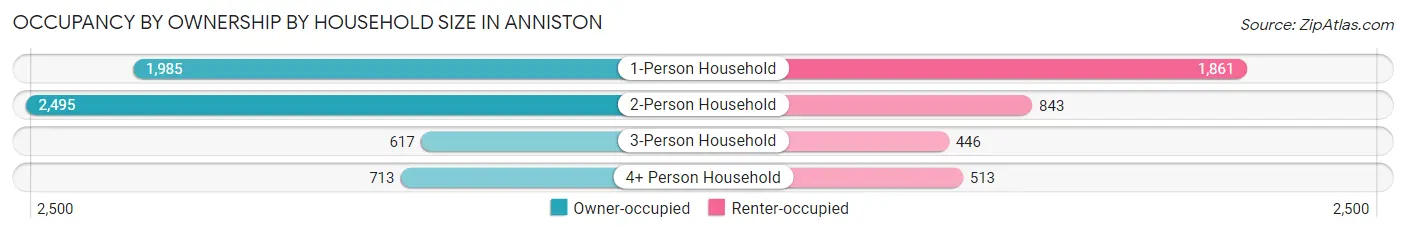
| Household Size | Owner-occupied | Renter-occupied |
| 1-Person Household | 1,985 (51.6%) | 1,861 (48.4%) |
| 2-Person Household | 2,495 (74.8%) | 843 (25.3%) |
| 3-Person Household | 617 (58.0%) | 446 (42.0%) |
| 4+ Person Household | 713 (58.2%) | 513 (41.8%) |
| Total Housing Units | 5,810 (61.3%) | 3,663 (38.7%) |
Occupancy by Educational Attainment in Anniston
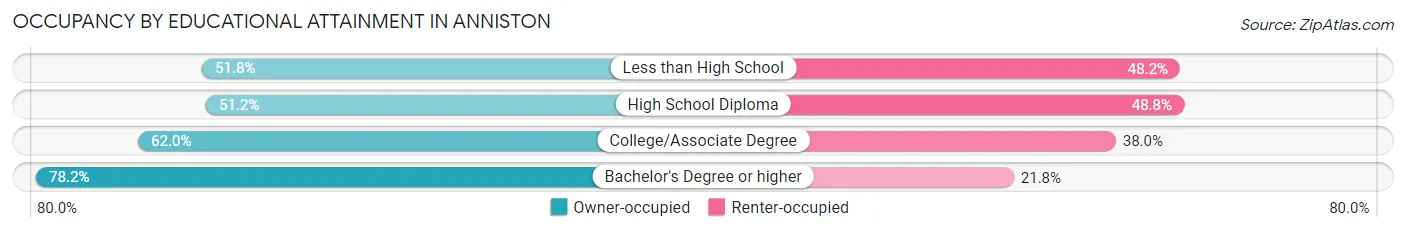
| Household Size | Owner-occupied | Renter-occupied |
| Less than High School | 565 (51.8%) | 525 (48.2%) |
| High School Diploma | 1,546 (51.2%) | 1,473 (48.8%) |
| College/Associate Degree | 1,892 (62.0%) | 1,160 (38.0%) |
| Bachelor's Degree or higher | 1,807 (78.2%) | 505 (21.8%) |
Occupancy by Age of Householder in Anniston
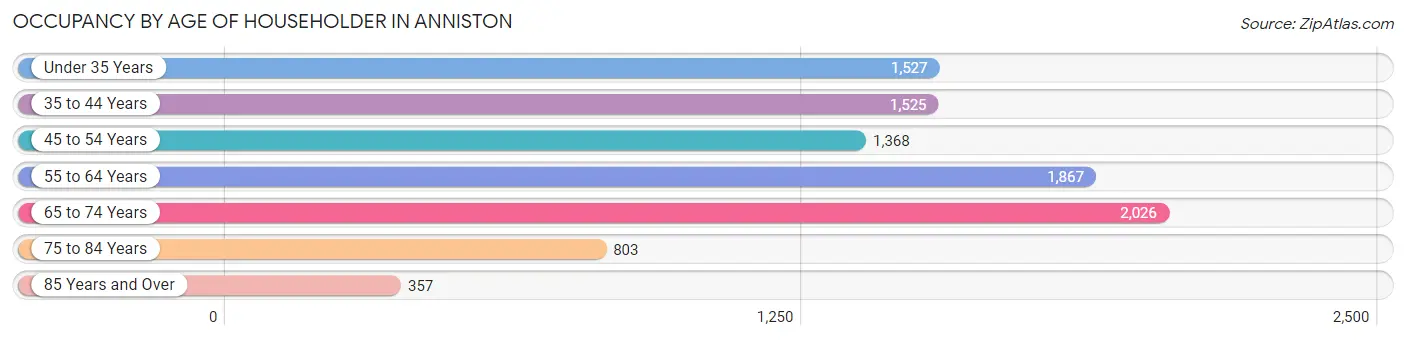
| Age Bracket | # Households | % Households |
| Under 35 Years | 1,527 | 16.1% |
| 35 to 44 Years | 1,525 | 16.1% |
| 45 to 54 Years | 1,368 | 14.4% |
| 55 to 64 Years | 1,867 | 19.7% |
| 65 to 74 Years | 2,026 | 21.4% |
| 75 to 84 Years | 803 | 8.5% |
| 85 Years and Over | 357 | 3.8% |
| Total | 9,473 | 100.0% |
Housing Finances in Anniston
Median Income by Occupancy in Anniston
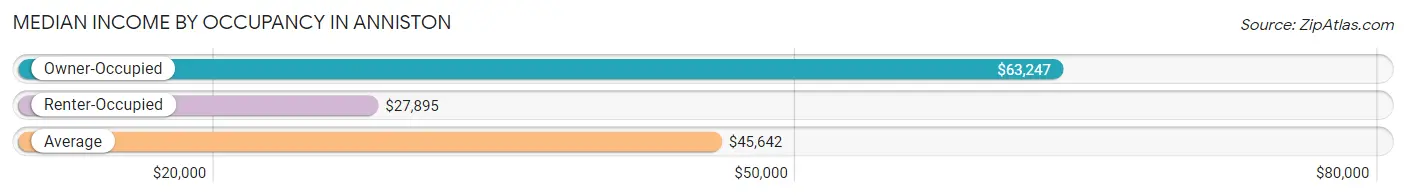
| Occupancy Type | # Households | Median Income |
| Owner-Occupied | 5,810 (61.3%) | $63,247 |
| Renter-Occupied | 3,663 (38.7%) | $27,895 |
| Average | 9,473 (100.0%) | $45,642 |
Occupancy by Householder Income Bracket in Anniston
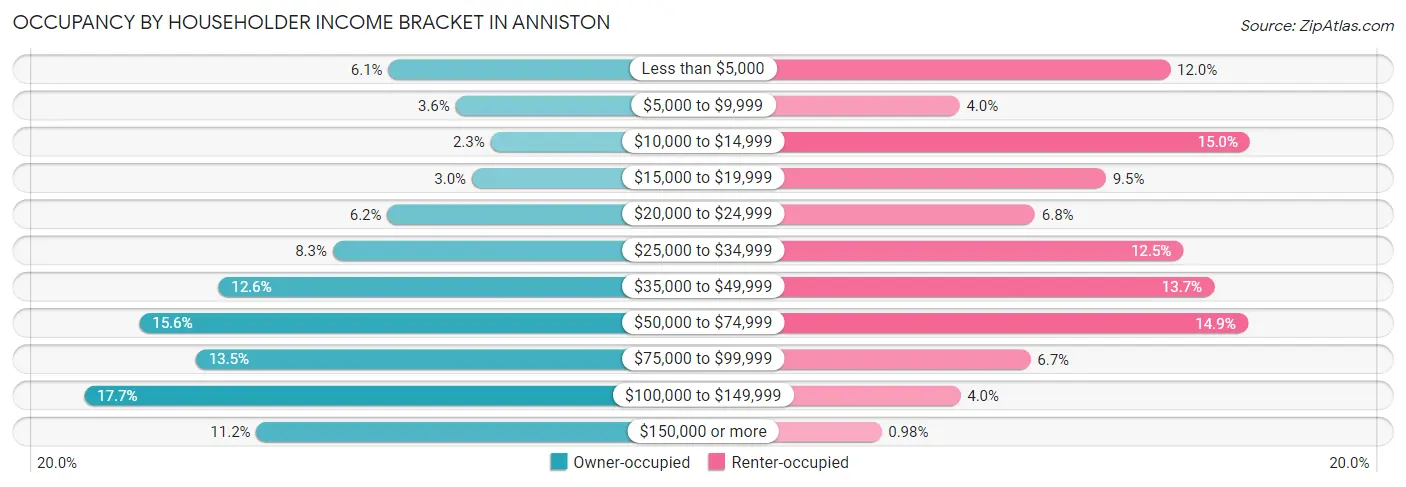
| Income Bracket | Owner-occupied | Renter-occupied |
| Less than $5,000 | 357 (6.1%) | 439 (12.0%) |
| $5,000 to $9,999 | 208 (3.6%) | 145 (4.0%) |
| $10,000 to $14,999 | 131 (2.2%) | 550 (15.0%) |
| $15,000 to $19,999 | 172 (3.0%) | 349 (9.5%) |
| $20,000 to $24,999 | 359 (6.2%) | 250 (6.8%) |
| $25,000 to $34,999 | 480 (8.3%) | 457 (12.5%) |
| $35,000 to $49,999 | 733 (12.6%) | 500 (13.7%) |
| $50,000 to $74,999 | 908 (15.6%) | 547 (14.9%) |
| $75,000 to $99,999 | 783 (13.5%) | 244 (6.7%) |
| $100,000 to $149,999 | 1,030 (17.7%) | 146 (4.0%) |
| $150,000 or more | 649 (11.2%) | 36 (1.0%) |
| Total | 5,810 (100.0%) | 3,663 (100.0%) |
Monthly Housing Cost Tiers in Anniston
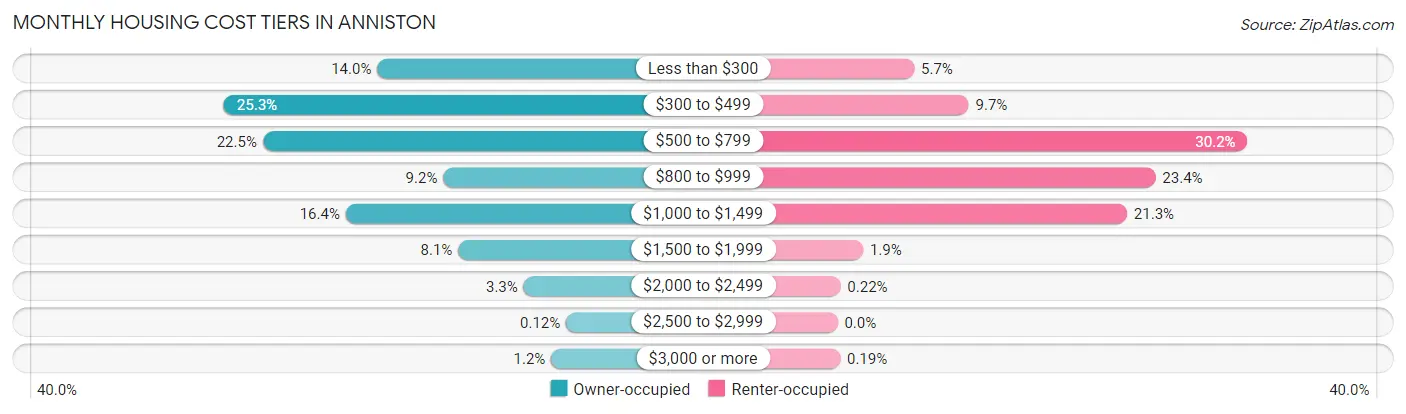
| Monthly Cost | Owner-occupied | Renter-occupied |
| Less than $300 | 815 (14.0%) | 207 (5.7%) |
| $300 to $499 | 1,471 (25.3%) | 354 (9.7%) |
| $500 to $799 | 1,305 (22.5%) | 1,106 (30.2%) |
| $800 to $999 | 533 (9.2%) | 858 (23.4%) |
| $1,000 to $1,499 | 950 (16.4%) | 781 (21.3%) |
| $1,500 to $1,999 | 469 (8.1%) | 69 (1.9%) |
| $2,000 to $2,499 | 189 (3.3%) | 8 (0.2%) |
| $2,500 to $2,999 | 7 (0.1%) | 0 (0.0%) |
| $3,000 or more | 71 (1.2%) | 7 (0.2%) |
| Total | 5,810 (100.0%) | 3,663 (100.0%) |
Physical Housing Characteristics in Anniston
Housing Structures in Anniston
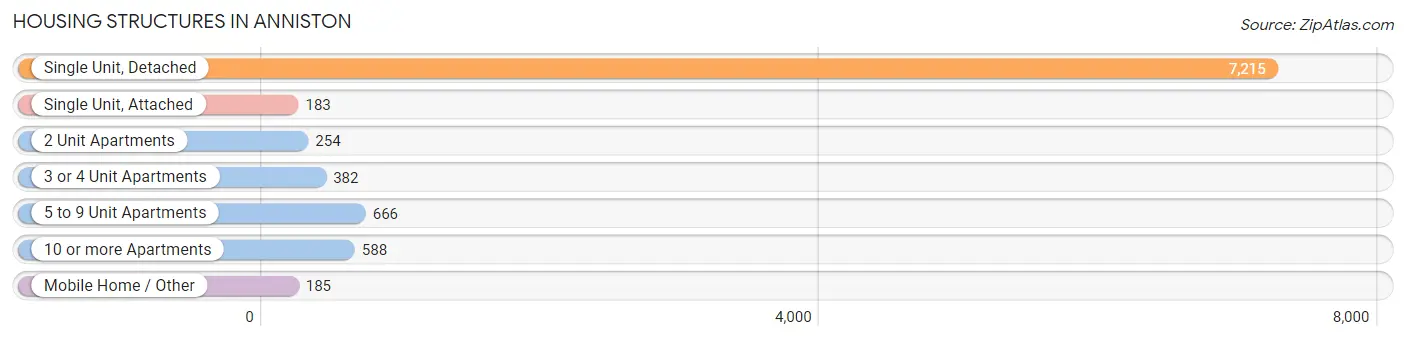
| Structure Type | # Housing Units | % Housing Units |
| Single Unit, Detached | 7,215 | 76.2% |
| Single Unit, Attached | 183 | 1.9% |
| 2 Unit Apartments | 254 | 2.7% |
| 3 or 4 Unit Apartments | 382 | 4.0% |
| 5 to 9 Unit Apartments | 666 | 7.0% |
| 10 or more Apartments | 588 | 6.2% |
| Mobile Home / Other | 185 | 1.9% |
| Total | 9,473 | 100.0% |
Housing Structures by Occupancy in Anniston
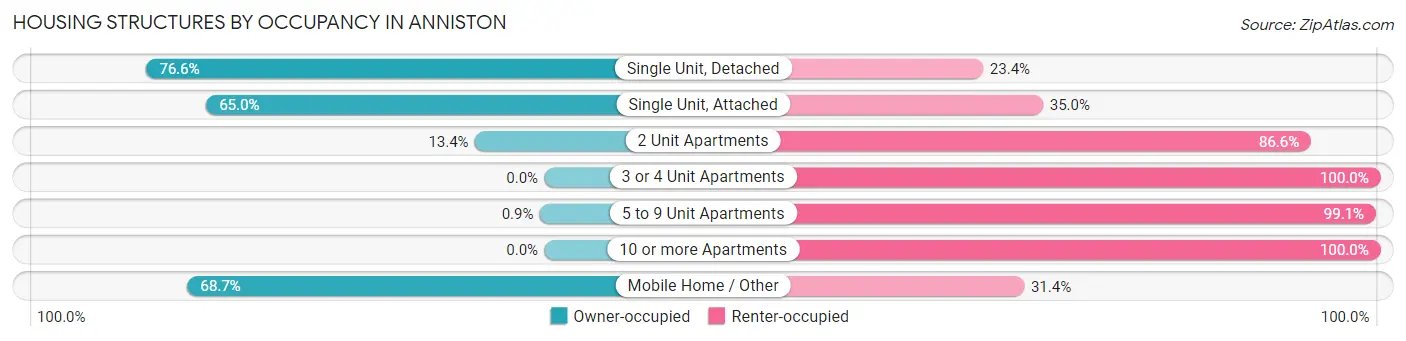
| Structure Type | Owner-occupied | Renter-occupied |
| Single Unit, Detached | 5,524 (76.6%) | 1,691 (23.4%) |
| Single Unit, Attached | 119 (65.0%) | 64 (35.0%) |
| 2 Unit Apartments | 34 (13.4%) | 220 (86.6%) |
| 3 or 4 Unit Apartments | 0 (0.0%) | 382 (100.0%) |
| 5 to 9 Unit Apartments | 6 (0.9%) | 660 (99.1%) |
| 10 or more Apartments | 0 (0.0%) | 588 (100.0%) |
| Mobile Home / Other | 127 (68.6%) | 58 (31.4%) |
| Total | 5,810 (61.3%) | 3,663 (38.7%) |
Housing Structures by Number of Rooms in Anniston
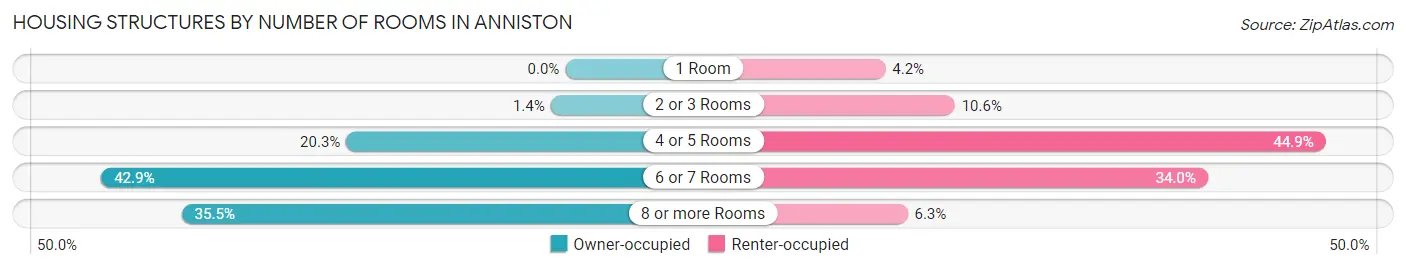
| Number of Rooms | Owner-occupied | Renter-occupied |
| 1 Room | 0 (0.0%) | 154 (4.2%) |
| 2 or 3 Rooms | 79 (1.4%) | 389 (10.6%) |
| 4 or 5 Rooms | 1,177 (20.3%) | 1,645 (44.9%) |
| 6 or 7 Rooms | 2,493 (42.9%) | 1,246 (34.0%) |
| 8 or more Rooms | 2,061 (35.5%) | 229 (6.2%) |
| Total | 5,810 (100.0%) | 3,663 (100.0%) |
Housing Structure by Heating Type in Anniston

| Heating Type | Owner-occupied | Renter-occupied |
| Utility Gas | 3,624 (62.4%) | 1,187 (32.4%) |
| Bottled, Tank, or LP Gas | 138 (2.4%) | 6 (0.2%) |
| Electricity | 1,973 (34.0%) | 2,345 (64.0%) |
| Fuel Oil or Kerosene | 0 (0.0%) | 0 (0.0%) |
| Coal or Coke | 0 (0.0%) | 0 (0.0%) |
| All other Fuels | 18 (0.3%) | 0 (0.0%) |
| No Fuel Used | 57 (1.0%) | 125 (3.4%) |
| Total | 5,810 (100.0%) | 3,663 (100.0%) |
Household Vehicle Usage in Anniston
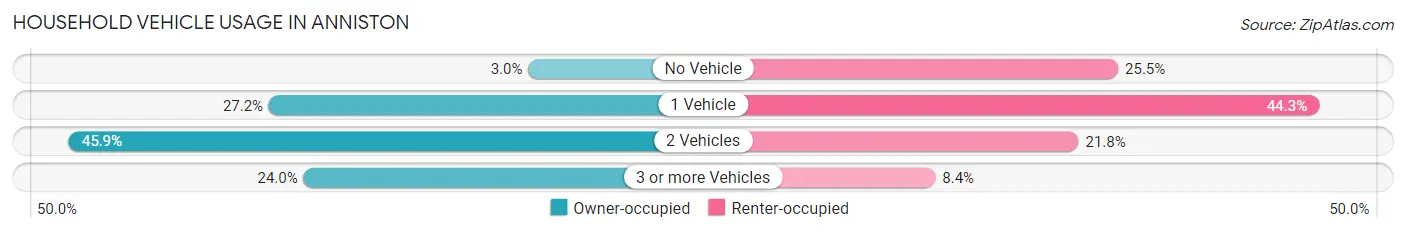
| Vehicles per Household | Owner-occupied | Renter-occupied |
| No Vehicle | 173 (3.0%) | 934 (25.5%) |
| 1 Vehicle | 1,580 (27.2%) | 1,621 (44.3%) |
| 2 Vehicles | 2,665 (45.9%) | 799 (21.8%) |
| 3 or more Vehicles | 1,392 (24.0%) | 309 (8.4%) |
| Total | 5,810 (100.0%) | 3,663 (100.0%) |
Real Estate & Mortgages in Anniston
Real Estate and Mortgage Overview in Anniston
| Characteristic | Without Mortgage | With Mortgage |
| Housing Units | 3,248 | 2,562 |
| Median Property Value | $103,000 | $153,300 |
| Median Household Income | $55,694 | $296 |
| Monthly Housing Costs | $403 | $71 |
| Real Estate Taxes | $536 | $495 |
Property Value by Mortgage Status in Anniston
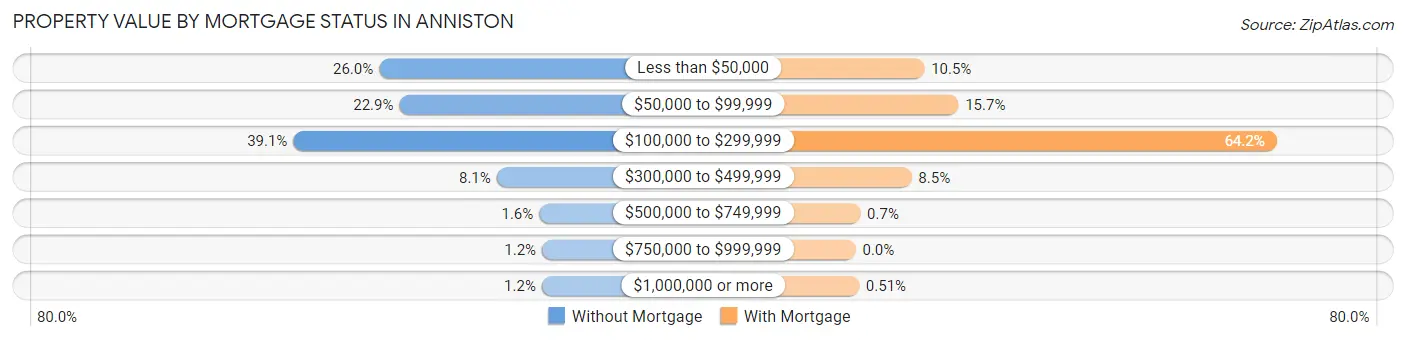
| Property Value | Without Mortgage | With Mortgage |
| Less than $50,000 | 844 (26.0%) | 268 (10.5%) |
| $50,000 to $99,999 | 744 (22.9%) | 401 (15.7%) |
| $100,000 to $299,999 | 1,269 (39.1%) | 1,644 (64.2%) |
| $300,000 to $499,999 | 262 (8.1%) | 218 (8.5%) |
| $500,000 to $749,999 | 52 (1.6%) | 18 (0.7%) |
| $750,000 to $999,999 | 38 (1.2%) | 0 (0.0%) |
| $1,000,000 or more | 39 (1.2%) | 13 (0.5%) |
| Total | 3,248 (100.0%) | 2,562 (100.0%) |
Household Income by Mortgage Status in Anniston
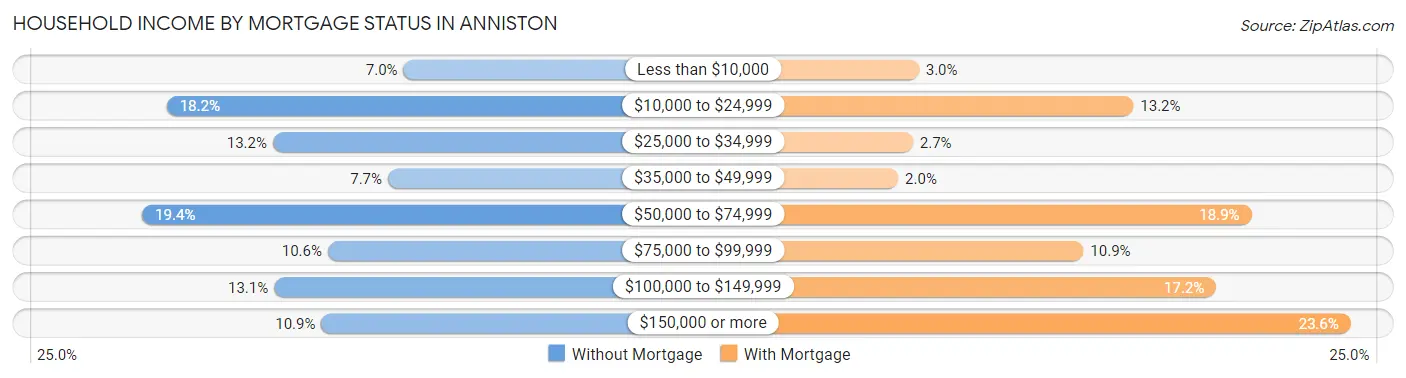
| Household Income | Without Mortgage | With Mortgage |
| Less than $10,000 | 226 (7.0%) | 77 (3.0%) |
| $10,000 to $24,999 | 592 (18.2%) | 339 (13.2%) |
| $25,000 to $34,999 | 428 (13.2%) | 70 (2.7%) |
| $35,000 to $49,999 | 250 (7.7%) | 52 (2.0%) |
| $50,000 to $74,999 | 630 (19.4%) | 483 (18.9%) |
| $75,000 to $99,999 | 343 (10.6%) | 278 (10.8%) |
| $100,000 to $149,999 | 426 (13.1%) | 440 (17.2%) |
| $150,000 or more | 353 (10.9%) | 604 (23.6%) |
| Total | 3,248 (100.0%) | 2,562 (100.0%) |
Property Value to Household Income Ratio in Anniston
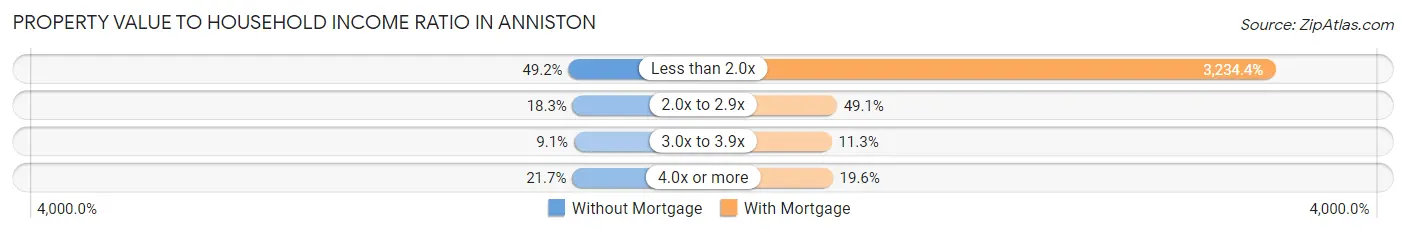
| Value-to-Income Ratio | Without Mortgage | With Mortgage |
| Less than 2.0x | 1,597 (49.2%) | 82,865 (3,234.4%) |
| 2.0x to 2.9x | 595 (18.3%) | 1,259 (49.1%) |
| 3.0x to 3.9x | 296 (9.1%) | 289 (11.3%) |
| 4.0x or more | 706 (21.7%) | 502 (19.6%) |
| Total | 3,248 (100.0%) | 2,562 (100.0%) |
Real Estate Taxes by Mortgage Status in Anniston
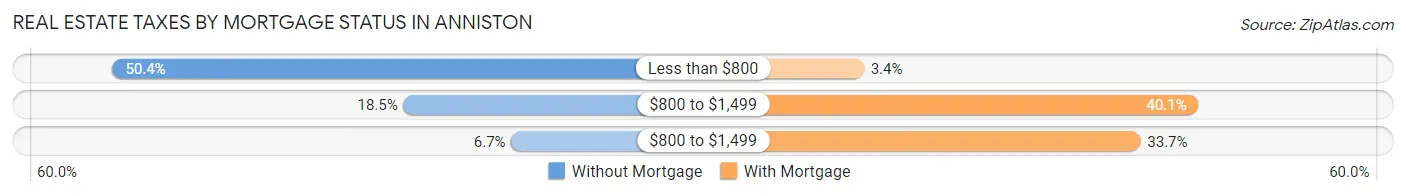
| Property Taxes | Without Mortgage | With Mortgage |
| Less than $800 | 1,636 (50.4%) | 86 (3.4%) |
| $800 to $1,499 | 600 (18.5%) | 1,026 (40.1%) |
| $800 to $1,499 | 216 (6.7%) | 863 (33.7%) |
| Total | 3,248 (100.0%) | 2,562 (100.0%) |
Health & Disability in Anniston
Health Insurance Coverage by Age in Anniston
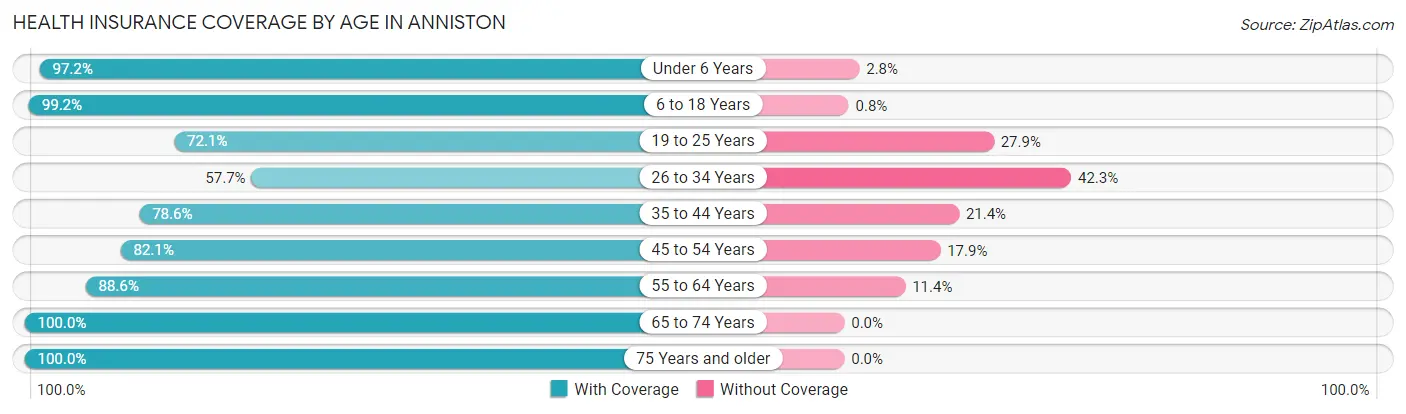
| Age Bracket | With Coverage | Without Coverage |
| Under 6 Years | 1,422 (97.2%) | 41 (2.8%) |
| 6 to 18 Years | 3,081 (99.2%) | 25 (0.8%) |
| 19 to 25 Years | 1,211 (72.1%) | 468 (27.9%) |
| 26 to 34 Years | 1,242 (57.7%) | 910 (42.3%) |
| 35 to 44 Years | 1,956 (78.6%) | 532 (21.4%) |
| 45 to 54 Years | 1,827 (82.1%) | 398 (17.9%) |
| 55 to 64 Years | 2,638 (88.6%) | 338 (11.4%) |
| 65 to 74 Years | 3,044 (100.0%) | 0 (0.0%) |
| 75 Years and older | 1,551 (100.0%) | 0 (0.0%) |
| Total | 17,972 (86.9%) | 2,712 (13.1%) |
Health Insurance Coverage by Citizenship Status in Anniston
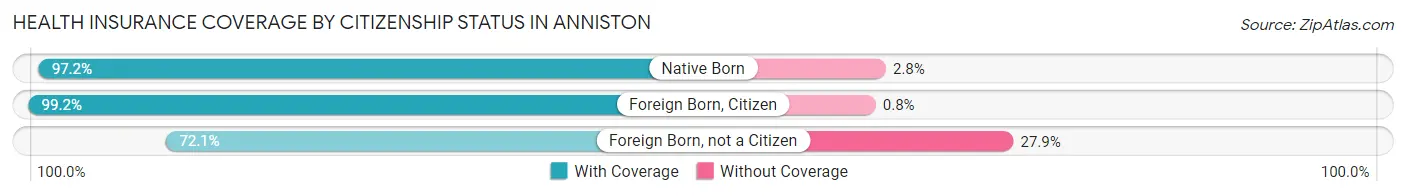
| Citizenship Status | With Coverage | Without Coverage |
| Native Born | 1,422 (97.2%) | 41 (2.8%) |
| Foreign Born, Citizen | 3,081 (99.2%) | 25 (0.8%) |
| Foreign Born, not a Citizen | 1,211 (72.1%) | 468 (27.9%) |
Health Insurance Coverage by Household Income in Anniston
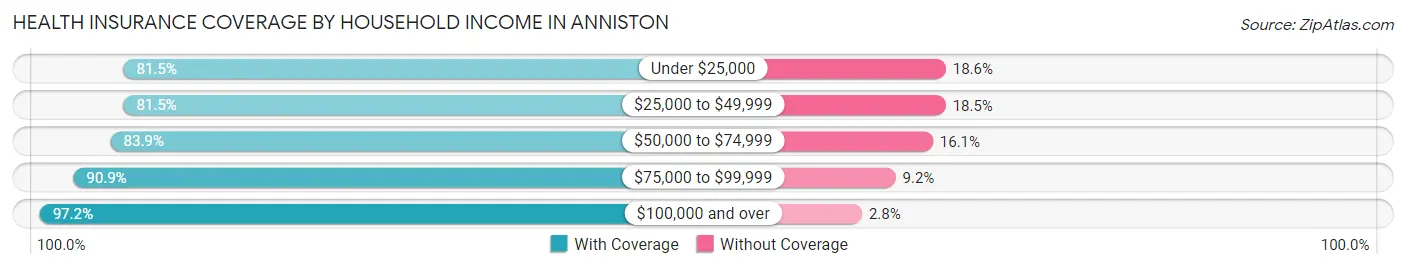
| Household Income | With Coverage | Without Coverage |
| Under $25,000 | 3,891 (81.5%) | 886 (18.5%) |
| $25,000 to $49,999 | 3,789 (81.5%) | 862 (18.5%) |
| $50,000 to $74,999 | 2,737 (83.9%) | 526 (16.1%) |
| $75,000 to $99,999 | 2,562 (90.8%) | 258 (9.1%) |
| $100,000 and over | 4,829 (97.2%) | 141 (2.8%) |
Public vs Private Health Insurance Coverage by Age in Anniston
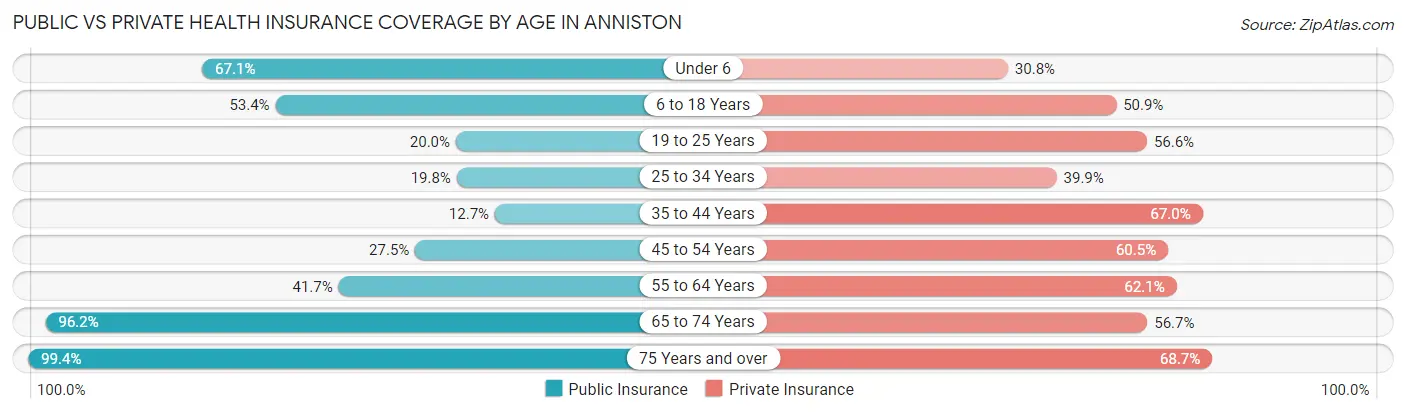
| Age Bracket | Public Insurance | Private Insurance |
| Under 6 | 981 (67.0%) | 451 (30.8%) |
| 6 to 18 Years | 1,660 (53.4%) | 1,582 (50.9%) |
| 19 to 25 Years | 335 (20.0%) | 951 (56.6%) |
| 25 to 34 Years | 426 (19.8%) | 858 (39.9%) |
| 35 to 44 Years | 316 (12.7%) | 1,666 (67.0%) |
| 45 to 54 Years | 612 (27.5%) | 1,347 (60.5%) |
| 55 to 64 Years | 1,242 (41.7%) | 1,849 (62.1%) |
| 65 to 74 Years | 2,927 (96.2%) | 1,726 (56.7%) |
| 75 Years and over | 1,541 (99.4%) | 1,066 (68.7%) |
| Total | 10,040 (48.5%) | 11,496 (55.6%) |
Disability Status by Sex by Age in Anniston
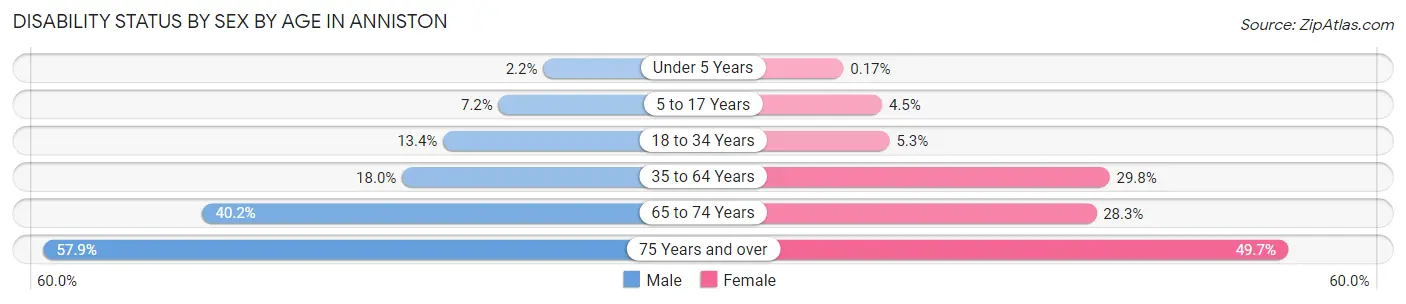
| Age Bracket | Male | Female |
| Under 5 Years | 15 (2.2%) | 1 (0.2%) |
| 5 to 17 Years | 93 (7.2%) | 75 (4.5%) |
| 18 to 34 Years | 288 (13.4%) | 108 (5.3%) |
| 35 to 64 Years | 629 (17.9%) | 1,248 (29.8%) |
| 65 to 74 Years | 578 (40.2%) | 455 (28.3%) |
| 75 Years and over | 393 (57.9%) | 433 (49.7%) |
Disability Class by Sex by Age in Anniston
Disability Class: Hearing Difficulty
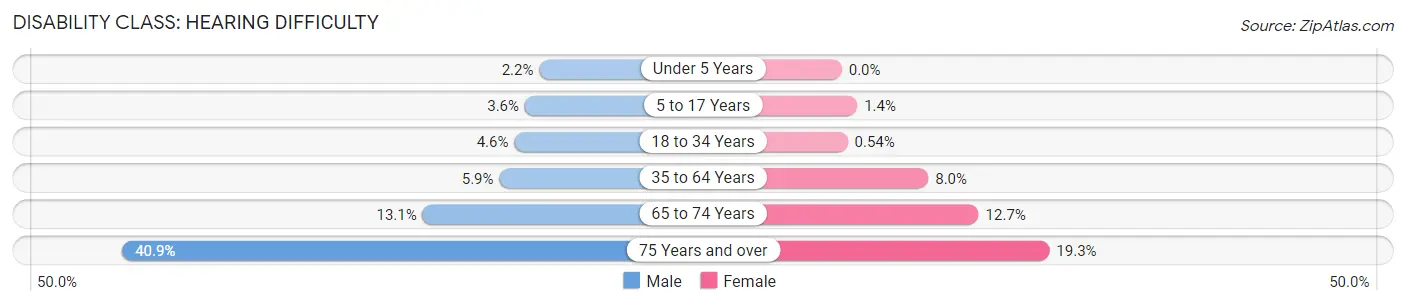
| Age Bracket | Male | Female |
| Under 5 Years | 15 (2.2%) | 0 (0.0%) |
| 5 to 17 Years | 46 (3.6%) | 24 (1.4%) |
| 18 to 34 Years | 98 (4.5%) | 11 (0.5%) |
| 35 to 64 Years | 208 (5.9%) | 336 (8.0%) |
| 65 to 74 Years | 188 (13.1%) | 204 (12.7%) |
| 75 Years and over | 278 (40.9%) | 168 (19.3%) |
Disability Class: Vision Difficulty
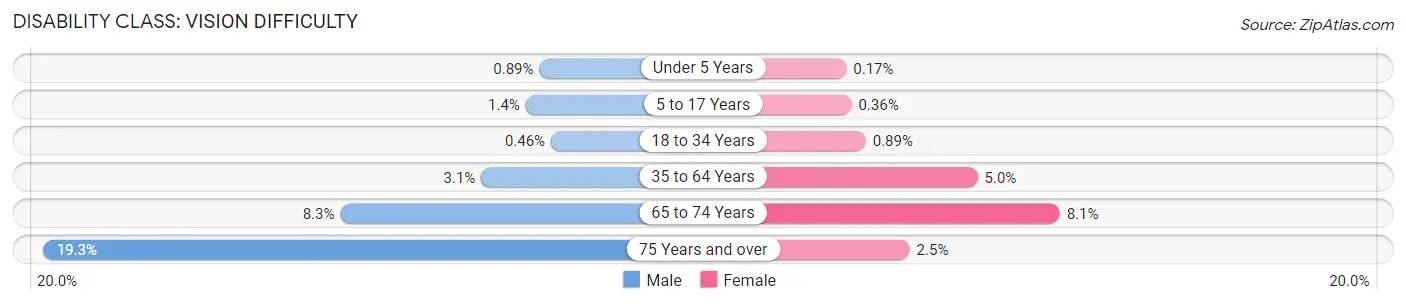
| Age Bracket | Male | Female |
| Under 5 Years | 6 (0.9%) | 1 (0.2%) |
| 5 to 17 Years | 18 (1.4%) | 6 (0.4%) |
| 18 to 34 Years | 10 (0.5%) | 18 (0.9%) |
| 35 to 64 Years | 107 (3.0%) | 211 (5.0%) |
| 65 to 74 Years | 119 (8.3%) | 130 (8.1%) |
| 75 Years and over | 131 (19.3%) | 22 (2.5%) |
Disability Class: Cognitive Difficulty
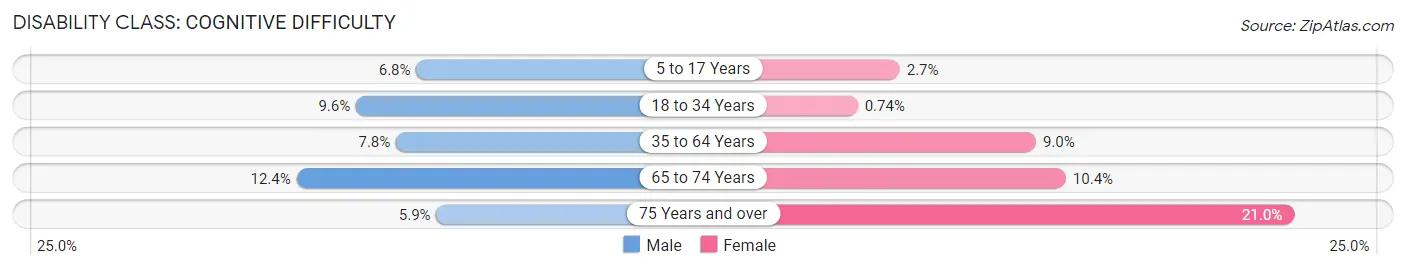
| Age Bracket | Male | Female |
| 5 to 17 Years | 88 (6.8%) | 45 (2.7%) |
| 18 to 34 Years | 207 (9.6%) | 15 (0.7%) |
| 35 to 64 Years | 272 (7.8%) | 377 (9.0%) |
| 65 to 74 Years | 178 (12.4%) | 167 (10.4%) |
| 75 Years and over | 40 (5.9%) | 183 (21.0%) |
Disability Class: Ambulatory Difficulty
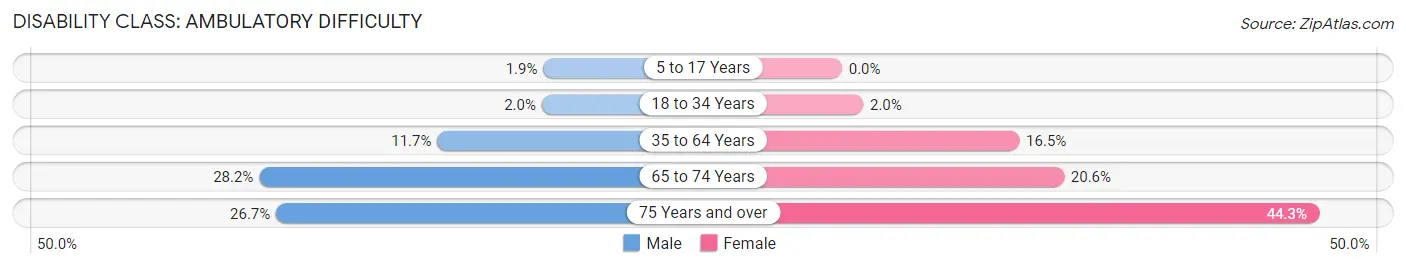
| Age Bracket | Male | Female |
| 5 to 17 Years | 24 (1.9%) | 0 (0.0%) |
| 18 to 34 Years | 43 (2.0%) | 40 (2.0%) |
| 35 to 64 Years | 410 (11.7%) | 689 (16.5%) |
| 65 to 74 Years | 406 (28.2%) | 331 (20.6%) |
| 75 Years and over | 181 (26.7%) | 386 (44.3%) |
Disability Class: Self-Care Difficulty
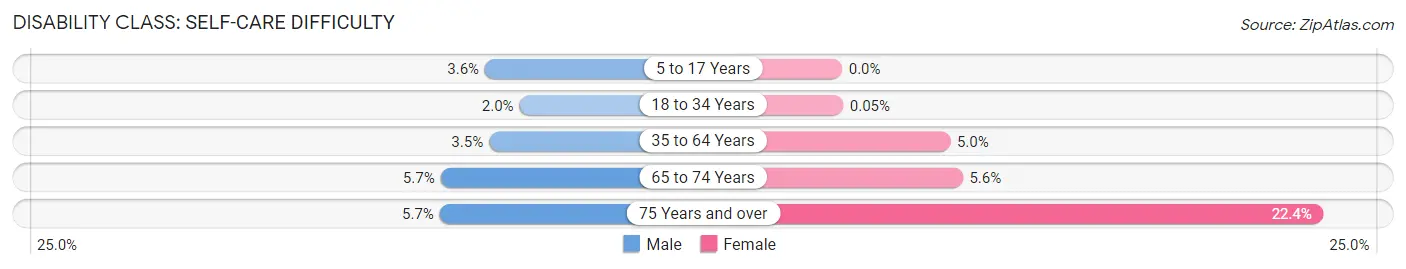
| Age Bracket | Male | Female |
| 5 to 17 Years | 47 (3.6%) | 0 (0.0%) |
| 18 to 34 Years | 44 (2.0%) | 1 (0.1%) |
| 35 to 64 Years | 121 (3.5%) | 210 (5.0%) |
| 65 to 74 Years | 82 (5.7%) | 90 (5.6%) |
| 75 Years and over | 39 (5.7%) | 195 (22.4%) |
Technology Access in Anniston
Computing Device Access in Anniston
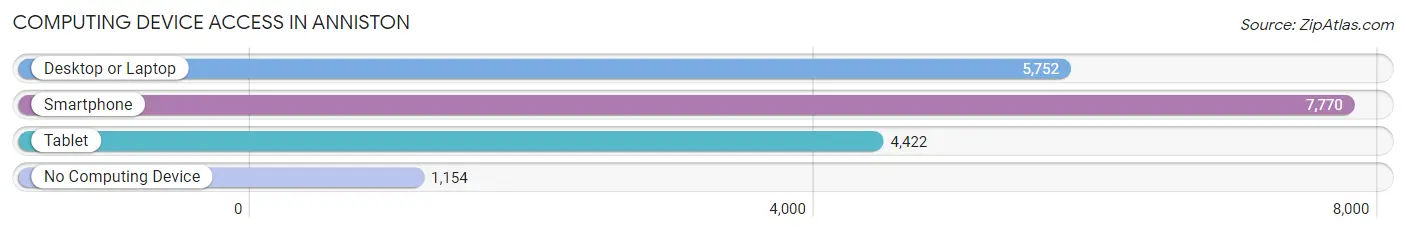
| Device Type | # Households | % Households |
| Desktop or Laptop | 5,752 | 60.7% |
| Smartphone | 7,770 | 82.0% |
| Tablet | 4,422 | 46.7% |
| No Computing Device | 1,154 | 12.2% |
| Total | 9,473 | 100.0% |
Internet Access in Anniston
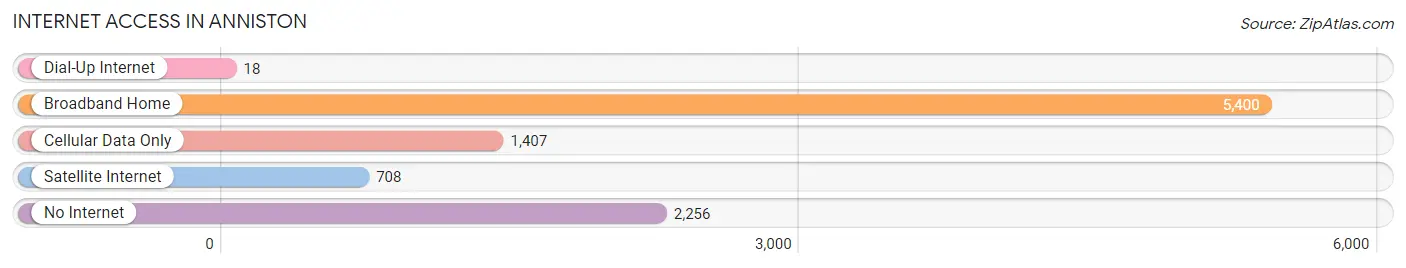
| Internet Type | # Households | % Households |
| Dial-Up Internet | 18 | 0.2% |
| Broadband Home | 5,400 | 57.0% |
| Cellular Data Only | 1,407 | 14.8% |
| Satellite Internet | 708 | 7.5% |
| No Internet | 2,256 | 23.8% |
| Total | 9,473 | 100.0% |
Anniston Summary
Anniston, Alabama is a city located in Calhoun County in the northeastern part of the state. It is the county seat and the largest city in the county. Anniston is located in the foothills of the Appalachian Mountains and is part of the Anniston-Oxford Metropolitan Statistical Area. The city has a population of 23,106 according to the 2010 census.
History
The area that is now Anniston was first settled in the early 1800s by settlers from Georgia and South Carolina. The city was founded in 1872 and was named after Annis, the daughter of one of the original settlers. The city was incorporated in 1879 and quickly became a major industrial center. The city was home to several large factories, including the Anniston Army Depot, which was established in 1940. The depot was a major employer in the area and was responsible for the production of military vehicles and equipment during World War II.
Geography
Anniston is located in the foothills of the Appalachian Mountains in northeastern Alabama. The city is situated at the intersection of Interstate 20 and US Highway 431. The city is located about 80 miles east of Birmingham and about 90 miles west of Atlanta. The city has a total area of 24.3 square miles, of which 24.2 square miles is land and 0.1 square miles is water.
Economy
Anniston’s economy is largely based on manufacturing and the military. The city is home to several large factories, including the Anniston Army Depot, which is the largest employer in the city. Other major employers in the city include the Anniston Star newspaper, the Anniston Foundry and Machine Company, and the Anniston Medical Center. The city also has a thriving retail sector, with several large shopping centers and malls.
Demographics
According to the 2010 census, Anniston has a population of 23,106. The racial makeup of the city is 63.2% White, 33.3% African American, 0.4% Native American, 0.7% Asian, 0.1% Pacific Islander, and 1.3% from other races. The median household income in the city is $31,945 and the median family income is $41,945. The per capita income in the city is $19,845. The city has a poverty rate of 24.3%.
Anniston is a diverse city with a rich history and a vibrant economy. The city is home to several large factories and military installations, as well as a thriving retail sector. The city has a population of 23,106 and a median household income of $31,945. Anniston is a great place to live and work and offers a variety of opportunities for its residents.
Common Questions
What is Per Capita Income in Anniston?
Per Capita income in Anniston is $30,564.
What is the Median Family Income in Anniston?
Median Family Income in Anniston is $64,070.
What is the Median Household income in Anniston?
Median Household Income in Anniston is $45,642.
What is Income or Wage Gap in Anniston?
Income or Wage Gap in Anniston is 25.8%.
Women in Anniston earn 74.2 cents for every dollar earned by a man.
What is Family Income Deficit in Anniston?
Family Income Deficit in Anniston is $10,670.
Families that are below poverty line in Anniston earn $10,670 less on average than the poverty threshold level.
What is Inequality or Gini Index in Anniston?
Inequality or Gini Index in Anniston is 0.52.
What is the Total Population of Anniston?
Total Population of Anniston is 21,502.
What is the Total Male Population of Anniston?
Total Male Population of Anniston is 10,142.
What is the Total Female Population of Anniston?
Total Female Population of Anniston is 11,360.
What is the Ratio of Males per 100 Females in Anniston?
There are 89.28 Males per 100 Females in Anniston.
What is the Ratio of Females per 100 Males in Anniston?
There are 112.01 Females per 100 Males in Anniston.
What is the Median Population Age in Anniston?
Median Population Age in Anniston is 42.1 Years.
What is the Average Family Size in Anniston
Average Family Size in Anniston is 2.9 People.
What is the Average Household Size in Anniston
Average Household Size in Anniston is 2.2 People.
How Large is the Labor Force in Anniston?
There are 9,171 People in the Labor Forcein in Anniston.
What is the Percentage of People in the Labor Force in Anniston?
51.5% of People are in the Labor Force in Anniston.
What is the Unemployment Rate in Anniston?
Unemployment Rate in Anniston is 5.5%.