Zip Codes with the Highest Percentage of Local Government Employees in Anniston, AL
RELATED REPORTS & OPTIONS
Local Government Employees
Anniston
Compare Zip Codes
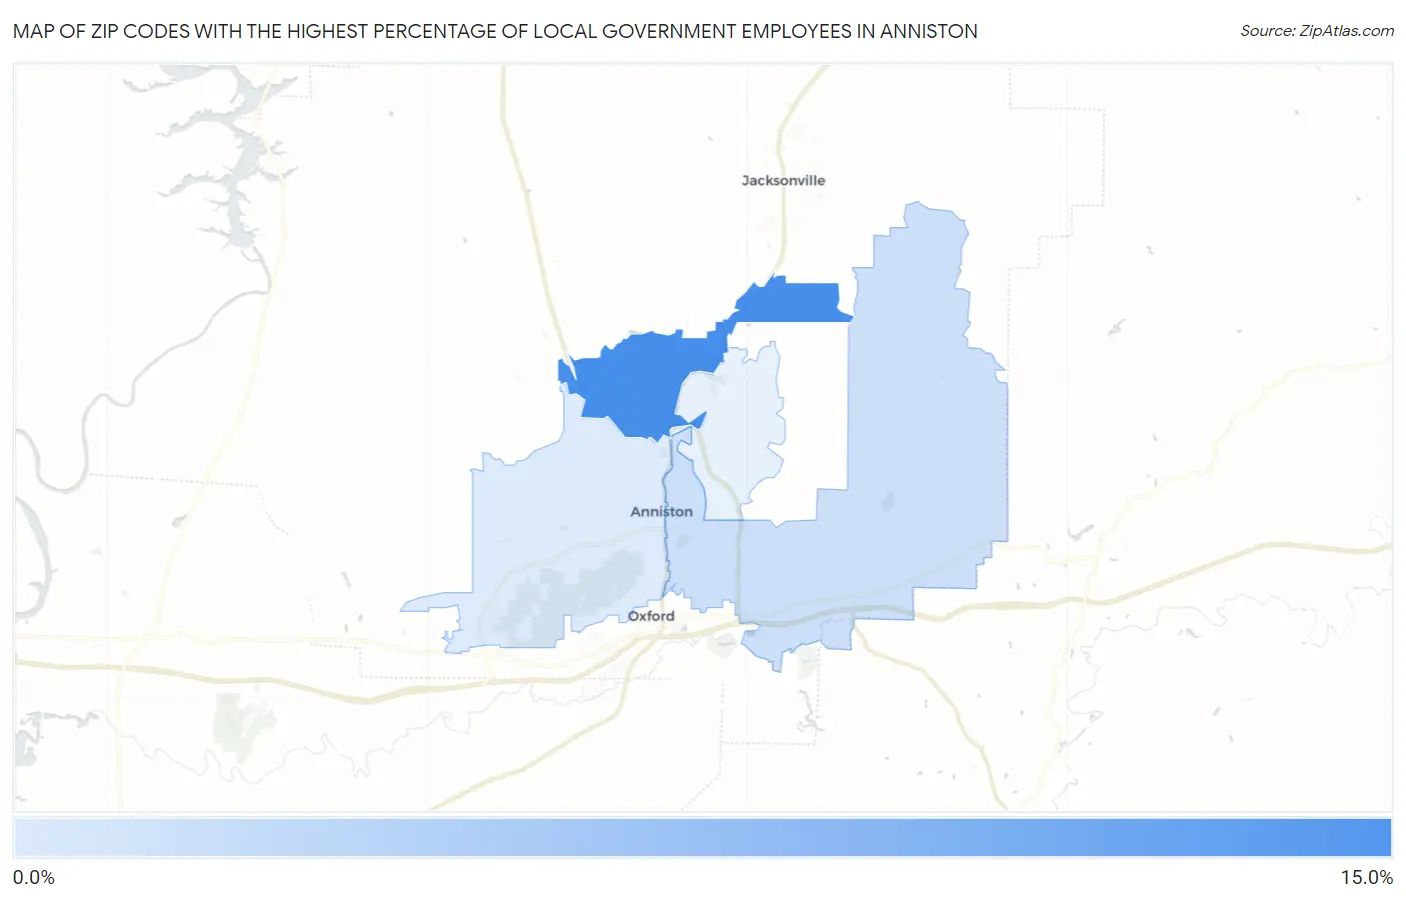
Map of Zip Codes with the Highest Percentage of Local Government Employees in Anniston
5.0%
10.9%
Zip Codes with the Highest Percentage of Local Government Employees in Anniston, AL
| Zip Code | % Local Government Employees | vs State | vs National | |
| 1. | 36206 | 10.9% | 6.8%(+4.09)#86 | 7.2%(+3.68)#6,741 |
| 2. | 36207 | 5.6% | 6.8%(-1.21)#380 | 7.2%(-1.62)#21,126 |
| 3. | 36201 | 5.0% | 6.8%(-1.85)#425 | 7.2%(-2.26)#23,160 |
1
Common Questions
What are the Top 3 Zip Codes with the Highest Percentage of Local Government Employees in Anniston, AL?
Top 3 Zip Codes with the Highest Percentage of Local Government Employees in Anniston, AL are:
What zip code has the Highest Percentage of Local Government Employees in Anniston, AL?
36206 has the Highest Percentage of Local Government Employees in Anniston, AL with 10.9%.
What is the Percentage of Local Government Employees in Anniston, AL?
Percentage of Local Government Employees in Anniston is 6.5%.
What is the Percentage of Local Government Employees in Alabama?
Percentage of Local Government Employees in Alabama is 6.8%.
What is the Percentage of Local Government Employees in the United States?
Percentage of Local Government Employees in the United States is 7.2%.