Fort Bridger, WY Map & Demographics
Fort Bridger Map
Fort Bridger Overview
$40,138
PER CAPITA INCOME
0.02
INEQUALITY / GINI INDEX
170
TOTAL POPULATION
112
MALE POPULATION
58
FEMALE POPULATION
193.10
MALES / 100 FEMALES
51.79
FEMALES / 100 MALES
23.8
MEDIAN AGE
3.8
AVG FAMILY SIZE
4.4
AVG HOUSEHOLD SIZE
119
LABOR FORCE [ PEOPLE ]
86.2%
PERCENT IN LABOR FORCE
Fort Bridger Zip Codes
Fort Bridger Area Codes
Income in Fort Bridger
Income Overview in Fort Bridger
| Characteristic | Number | Measure |
| Per Capita Income | 170 | $40,138 |
| Median Family Income | 39 | $0 |
| Mean Family Income | 39 | $0 |
| Median Household Income | 39 | $0 |
| Mean Household Income | 39 | $0 |
| Income Deficit | 39 | $0 |
| Wage / Income Gap (%) | 170 | 0.00% |
| Wage / Income Gap ($) | 170 | 100.00¢ per $1 |
| Gini / Inequality Index | 170 | 0.02 |
Earnings by Sex in Fort Bridger
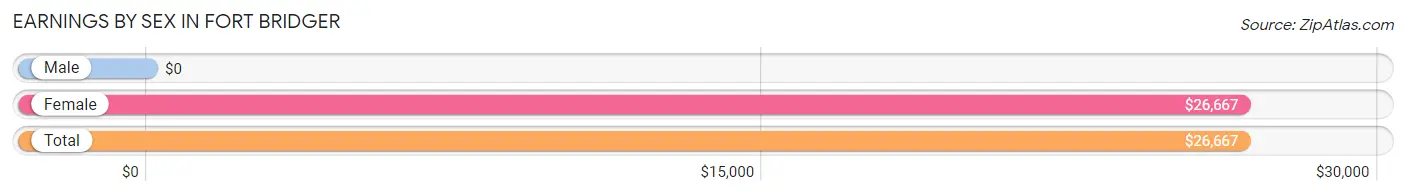
| Sex | Number | Average Earnings |
| Male | 80 (58.0%) | $0 |
| Female | 58 (42.0%) | $26,667 |
| Total | 138 (100.0%) | $26,667 |
Earnings by Sex by Income Bracket in Fort Bridger
The most common earnings brackets in Fort Bridger are $5,000 to $7,499 for men (22 | 27.5%) and $40,000 to $44,999 for women (24 | 41.4%).
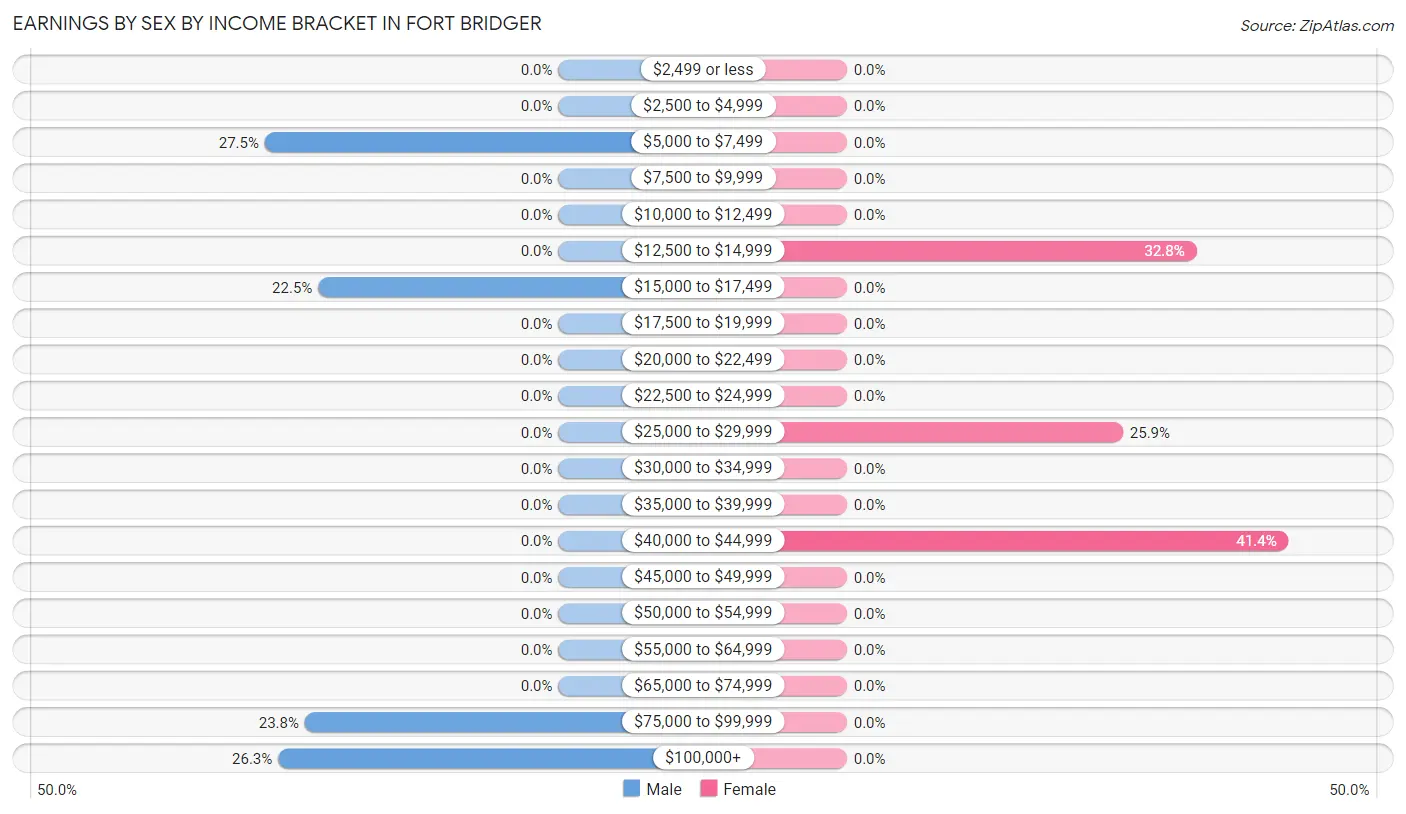
| Income | Male | Female |
| $2,499 or less | 0 (0.0%) | 0 (0.0%) |
| $2,500 to $4,999 | 0 (0.0%) | 0 (0.0%) |
| $5,000 to $7,499 | 22 (27.5%) | 0 (0.0%) |
| $7,500 to $9,999 | 0 (0.0%) | 0 (0.0%) |
| $10,000 to $12,499 | 0 (0.0%) | 0 (0.0%) |
| $12,500 to $14,999 | 0 (0.0%) | 19 (32.8%) |
| $15,000 to $17,499 | 18 (22.5%) | 0 (0.0%) |
| $17,500 to $19,999 | 0 (0.0%) | 0 (0.0%) |
| $20,000 to $22,499 | 0 (0.0%) | 0 (0.0%) |
| $22,500 to $24,999 | 0 (0.0%) | 0 (0.0%) |
| $25,000 to $29,999 | 0 (0.0%) | 15 (25.9%) |
| $30,000 to $34,999 | 0 (0.0%) | 0 (0.0%) |
| $35,000 to $39,999 | 0 (0.0%) | 0 (0.0%) |
| $40,000 to $44,999 | 0 (0.0%) | 24 (41.4%) |
| $45,000 to $49,999 | 0 (0.0%) | 0 (0.0%) |
| $50,000 to $54,999 | 0 (0.0%) | 0 (0.0%) |
| $55,000 to $64,999 | 0 (0.0%) | 0 (0.0%) |
| $65,000 to $74,999 | 0 (0.0%) | 0 (0.0%) |
| $75,000 to $99,999 | 19 (23.7%) | 0 (0.0%) |
| $100,000+ | 21 (26.3%) | 0 (0.0%) |
| Total | 80 (100.0%) | 58 (100.0%) |
Earnings by Sex by Educational Attainment in Fort Bridger
| Educational Attainment | Male Income | Female Income |
| Less than High School | - | - |
| High School Diploma | - | - |
| College or Associate's Degree | - | - |
| Bachelor's Degree | - | - |
| Graduate Degree | - | - |
| Total | - | - |
Family Income in Fort Bridger
Family Income Brackets in Fort Bridger
According to the Fort Bridger family income data, there are 24 families falling into the $150,000 to $199,999 income range, which is the most common income bracket and makes up 61.5% of all families.
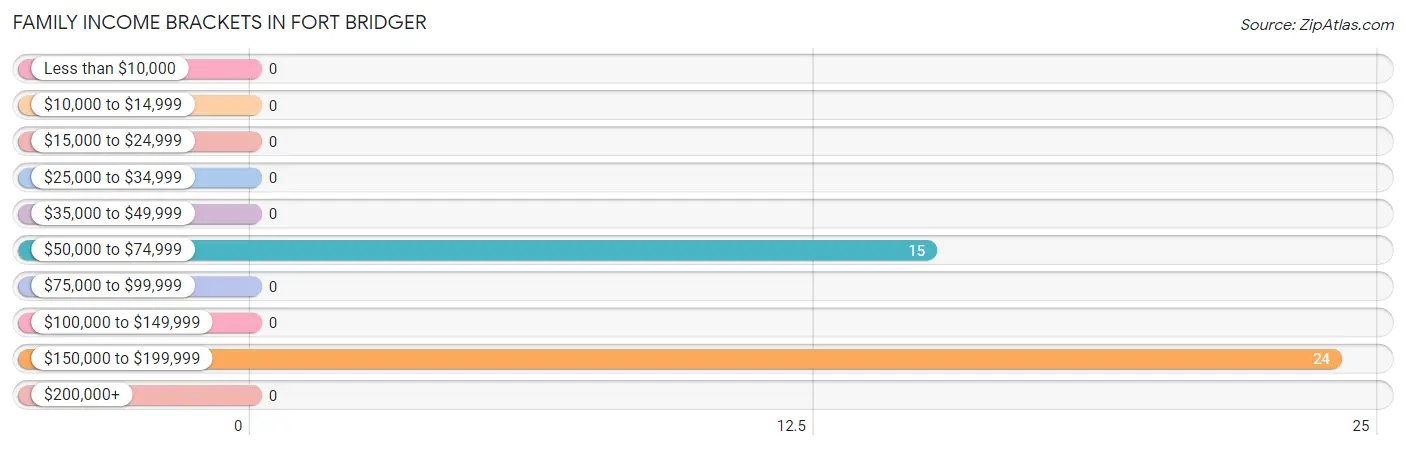
| Income Bracket | # Families | % Families |
| Less than $10,000 | 0 | 0.0% |
| $10,000 to $14,999 | 0 | 0.0% |
| $15,000 to $24,999 | 0 | 0.0% |
| $25,000 to $34,999 | 0 | 0.0% |
| $35,000 to $49,999 | 0 | 0.0% |
| $50,000 to $74,999 | 15 | 38.5% |
| $75,000 to $99,999 | 0 | 0.0% |
| $100,000 to $149,999 | 0 | 0.0% |
| $150,000 to $199,999 | 24 | 61.5% |
| $200,000+ | 0 | 0.0% |
Family Income by Famaliy Size in Fort Bridger
| Income Bracket | # Families | Median Income |
| 2-Person Families | 15 (38.5%) | $0 |
| 3-Person Families | 0 (0.0%) | $0 |
| 4-Person Families | 0 (0.0%) | $0 |
| 5-Person Families | 0 (0.0%) | $0 |
| 6-Person Families | 24 (61.5%) | $0 |
| 7+ Person Families | 0 (0.0%) | $0 |
| Total | 39 (100.0%) | $0 |
Family Income by Number of Earners in Fort Bridger
| Number of Earners | # Families | Median Income |
| No Earners | 0 (0.0%) | $0 |
| 1 Earner | 15 (38.5%) | $0 |
| 2 Earners | 0 (0.0%) | $0 |
| 3+ Earners | 24 (61.5%) | $0 |
| Total | 39 (100.0%) | $0 |
Household Income in Fort Bridger
Household Income Brackets in Fort Bridger
With 39 households falling in the category, the $150,000 to $199,999 income range is the most frequent in Fort Bridger, accounting for 100.0% of all households.
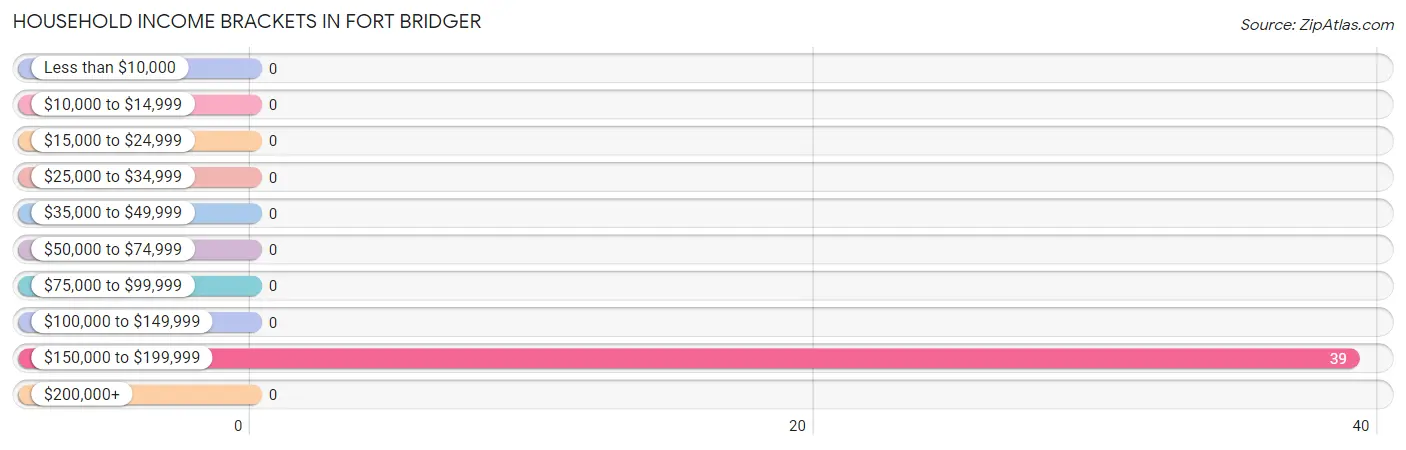
| Income Bracket | # Households | % Households |
| Less than $10,000 | 0 | 0.0% |
| $10,000 to $14,999 | 0 | 0.0% |
| $15,000 to $24,999 | 0 | 0.0% |
| $25,000 to $34,999 | 0 | 0.0% |
| $35,000 to $49,999 | 0 | 0.0% |
| $50,000 to $74,999 | 0 | 0.0% |
| $75,000 to $99,999 | 0 | 0.0% |
| $100,000 to $149,999 | 0 | 0.0% |
| $150,000 to $199,999 | 39 | 100.0% |
| $200,000+ | 0 | 0.0% |
Household Income by Householder Age in Fort Bridger
| Income Bracket | # Households | Median Income |
| 15 to 24 Years | 0 (0.0%) | $0 |
| 25 to 44 Years | 39 (100.0%) | $0 |
| 45 to 64 Years | 0 (0.0%) | $0 |
| 65+ Years | 0 (0.0%) | $0 |
| Total | 39 (100.0%) | $0 |
Poverty in Fort Bridger
Income Below Poverty by Sex and Age in Fort Bridger
| Age Bracket | Male | Female |
| Under 5 Years | 0 (0.0%) | 0 (0.0%) |
| 5 Years | 0 (0.0%) | 0 (0.0%) |
| 6 to 11 Years | 0 (0.0%) | 0 (0.0%) |
| 12 to 14 Years | 0 (0.0%) | 0 (0.0%) |
| 15 Years | 0 (0.0%) | 0 (0.0%) |
| 16 and 17 Years | 0 (0.0%) | 0 (0.0%) |
| 18 to 24 Years | 0 (0.0%) | 0 (0.0%) |
| 25 to 34 Years | 0 (0.0%) | 0 (0.0%) |
| 35 to 44 Years | 0 (0.0%) | 0 (0.0%) |
| 45 to 54 Years | 0 (0.0%) | 0 (0.0%) |
| 55 to 64 Years | 0 (0.0%) | 0 (0.0%) |
| 65 to 74 Years | 0 (0.0%) | 0 (0.0%) |
| 75 Years and over | 0 (0.0%) | 0 (0.0%) |
| Total | 0 (0.0%) | 0 (0.0%) |
Income Above Poverty by Sex and Age in Fort Bridger
According to the poverty statistics in Fort Bridger, males aged under 5 years and females aged 18 to 24 years are the age groups that are most secure financially, with 100.0% of males and 100.0% of females in these age groups living above the poverty line.
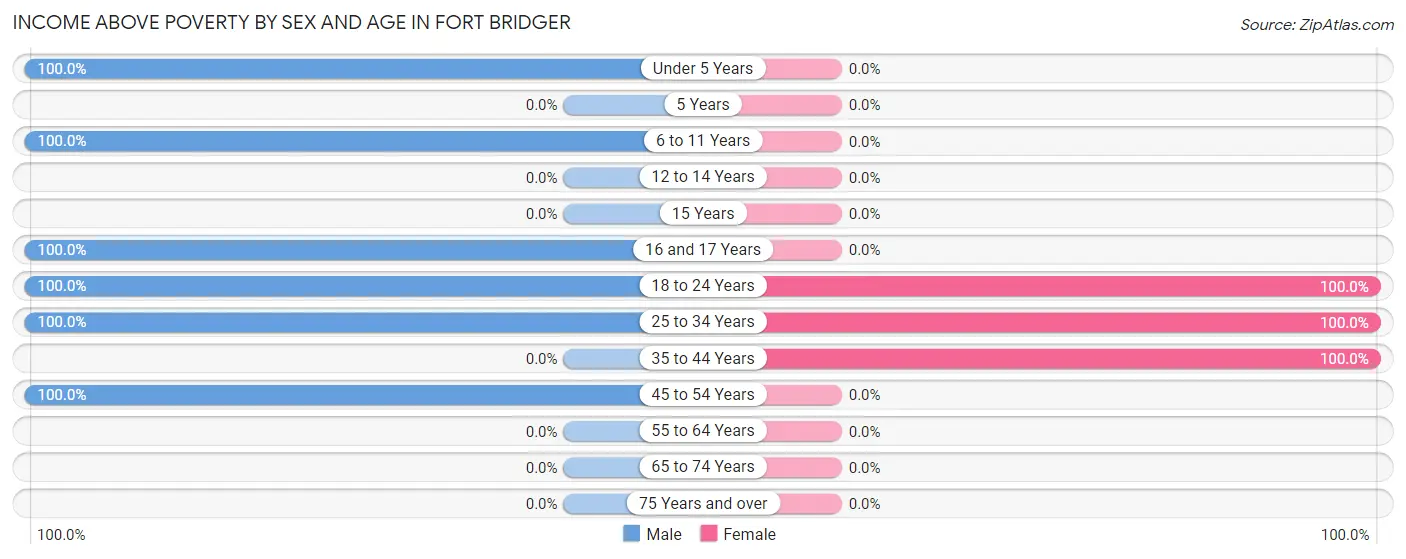
| Age Bracket | Male | Female |
| Under 5 Years | 11 (100.0%) | 0 (0.0%) |
| 5 Years | 0 (0.0%) | 0 (0.0%) |
| 6 to 11 Years | 21 (100.0%) | 0 (0.0%) |
| 12 to 14 Years | 0 (0.0%) | 0 (0.0%) |
| 15 Years | 0 (0.0%) | 0 (0.0%) |
| 16 and 17 Years | 22 (100.0%) | 0 (0.0%) |
| 18 to 24 Years | 18 (100.0%) | 19 (100.0%) |
| 25 to 34 Years | 21 (100.0%) | 15 (100.0%) |
| 35 to 44 Years | 0 (0.0%) | 24 (100.0%) |
| 45 to 54 Years | 19 (100.0%) | 0 (0.0%) |
| 55 to 64 Years | 0 (0.0%) | 0 (0.0%) |
| 65 to 74 Years | 0 (0.0%) | 0 (0.0%) |
| 75 Years and over | 0 (0.0%) | 0 (0.0%) |
| Total | 112 (100.0%) | 58 (100.0%) |
Income Below Poverty Among Married-Couple Families in Fort Bridger
| Children | Above Poverty | Below Poverty |
| No Children | 0 (0.0%) | 0 (0.0%) |
| 1 or 2 Children | 24 (100.0%) | 0 (0.0%) |
| 3 or 4 Children | 0 (0.0%) | 0 (0.0%) |
| 5 or more Children | 0 (0.0%) | 0 (0.0%) |
| Total | 24 (100.0%) | 0 (0.0%) |
Income Below Poverty Among Single-Parent Households in Fort Bridger
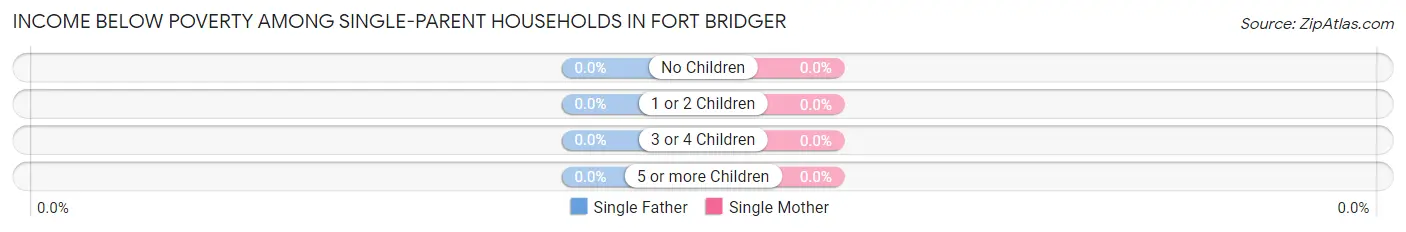
| Children | Single Father | Single Mother |
| No Children | 0 (0.0%) | 0 (0.0%) |
| 1 or 2 Children | 0 (0.0%) | 0 (0.0%) |
| 3 or 4 Children | 0 (0.0%) | 0 (0.0%) |
| 5 or more Children | 0 (0.0%) | 0 (0.0%) |
| Total | 0 (0.0%) | 0 (0.0%) |
Income Below Poverty Among Married-Couple vs Single-Parent Households in Fort Bridger
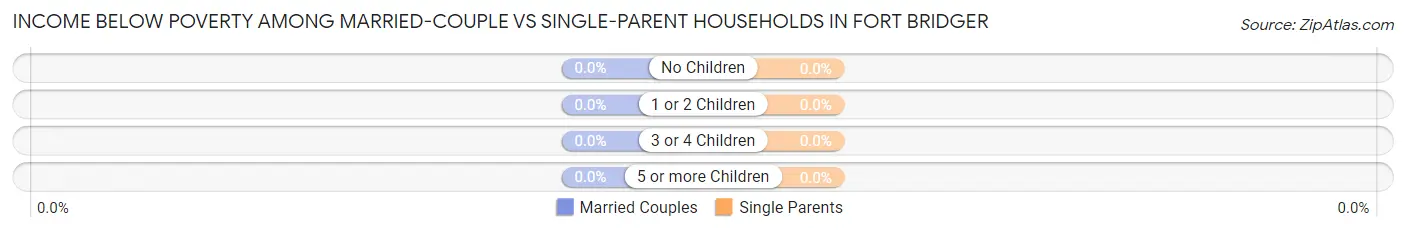
| Children | Married-Couple Families | Single-Parent Households |
| No Children | 0 (0.0%) | 0 (0.0%) |
| 1 or 2 Children | 0 (0.0%) | 0 (0.0%) |
| 3 or 4 Children | 0 (0.0%) | 0 (0.0%) |
| 5 or more Children | 0 (0.0%) | 0 (0.0%) |
| Total | 0 (0.0%) | 0 (0.0%) |
Race in Fort Bridger
The most populous races in Fort Bridger are , and White / Caucasian (170 | 100.0%).
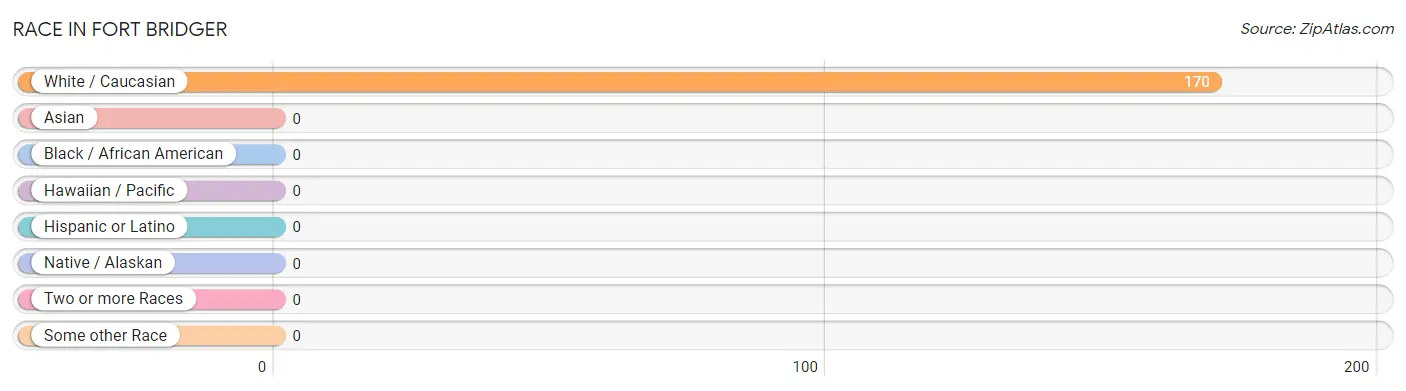
| Race | # Population | % Population |
| Asian | 0 | 0.0% |
| Black / African American | 0 | 0.0% |
| Hawaiian / Pacific | 0 | 0.0% |
| Hispanic or Latino | 0 | 0.0% |
| Native / Alaskan | 0 | 0.0% |
| White / Caucasian | 170 | 100.0% |
| Two or more Races | 0 | 0.0% |
| Some other Race | 0 | 0.0% |
| Total | 170 | 100.0% |
Ancestry in Fort Bridger
The most populous ancestries reported in Fort Bridger are , and Italian (36 | 21.2%), together accounting for 21.2% of all Fort Bridger residents.

| Ancestry | # Population | % Population |
| Italian | 36 | 21.2% | View All 1 Rows |
Immigrants in Fort Bridger

| Immigration Origin | # Population | % Population | View All 0 Rows |
Sex and Age in Fort Bridger
Sex and Age in Fort Bridger
The most populous age groups in Fort Bridger are 15 to 19 Years (22 | 19.6%) for men and 40 to 44 Years (24 | 41.4%) for women.
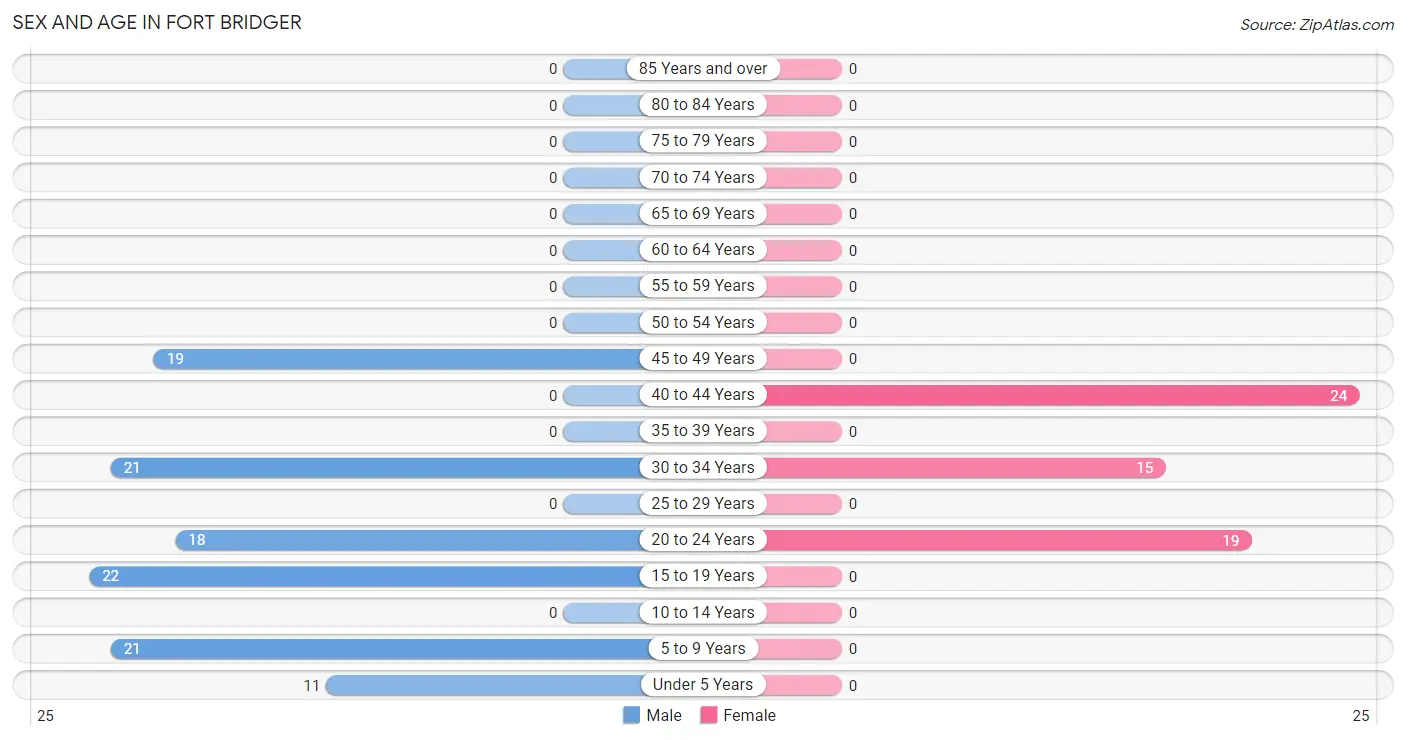
| Age Bracket | Male | Female |
| Under 5 Years | 11 (9.8%) | 0 (0.0%) |
| 5 to 9 Years | 21 (18.8%) | 0 (0.0%) |
| 10 to 14 Years | 0 (0.0%) | 0 (0.0%) |
| 15 to 19 Years | 22 (19.6%) | 0 (0.0%) |
| 20 to 24 Years | 18 (16.1%) | 19 (32.8%) |
| 25 to 29 Years | 0 (0.0%) | 0 (0.0%) |
| 30 to 34 Years | 21 (18.8%) | 15 (25.9%) |
| 35 to 39 Years | 0 (0.0%) | 0 (0.0%) |
| 40 to 44 Years | 0 (0.0%) | 24 (41.4%) |
| 45 to 49 Years | 19 (17.0%) | 0 (0.0%) |
| 50 to 54 Years | 0 (0.0%) | 0 (0.0%) |
| 55 to 59 Years | 0 (0.0%) | 0 (0.0%) |
| 60 to 64 Years | 0 (0.0%) | 0 (0.0%) |
| 65 to 69 Years | 0 (0.0%) | 0 (0.0%) |
| 70 to 74 Years | 0 (0.0%) | 0 (0.0%) |
| 75 to 79 Years | 0 (0.0%) | 0 (0.0%) |
| 80 to 84 Years | 0 (0.0%) | 0 (0.0%) |
| 85 Years and over | 0 (0.0%) | 0 (0.0%) |
| Total | 112 (100.0%) | 58 (100.0%) |
Families and Households in Fort Bridger
Median Family Size in Fort Bridger
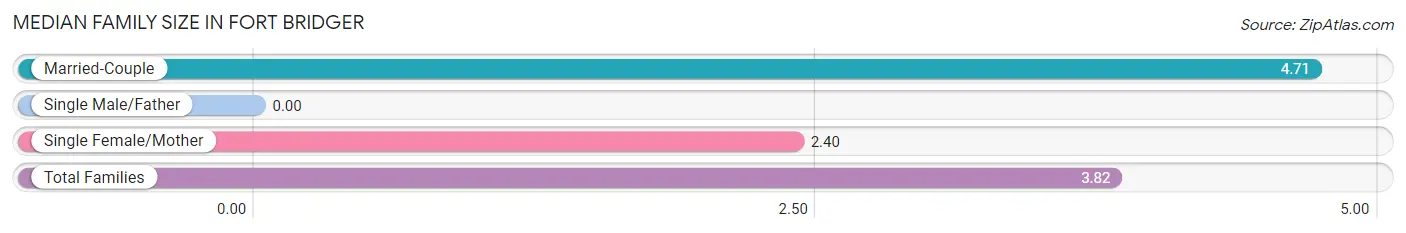
| Family Type | # Families | Family Size |
| Married-Couple | 24 (61.5%) | 4.71 |
| Single Male/Father | 0 (0.0%) | - |
| Single Female/Mother | 15 (38.5%) | 2.40 |
| Total Families | 39 (100.0%) | 3.82 |
Median Household Size in Fort Bridger
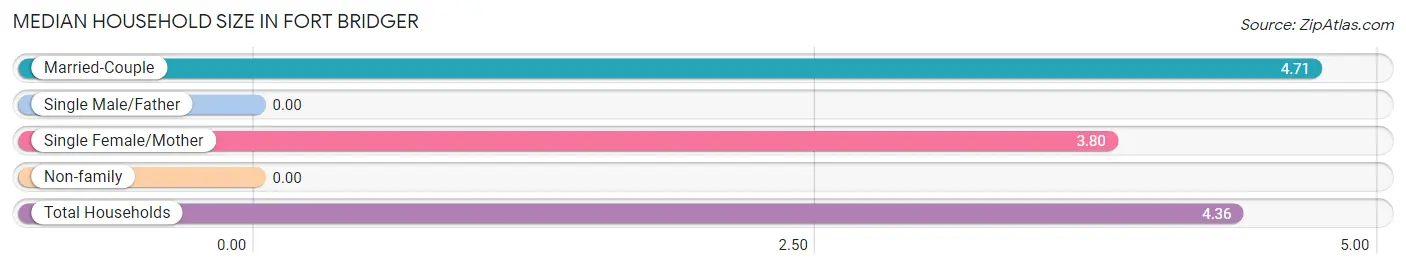
| Household Type | # Households | Household Size |
| Married-Couple | 24 (61.5%) | 4.71 |
| Single Male/Father | 0 (0.0%) | - |
| Single Female/Mother | 15 (38.5%) | 3.80 |
| Non-family | 0 (0.0%) | - |
| Total Households | 39 (100.0%) | 4.36 |
Household Size by Marriage Status in Fort Bridger
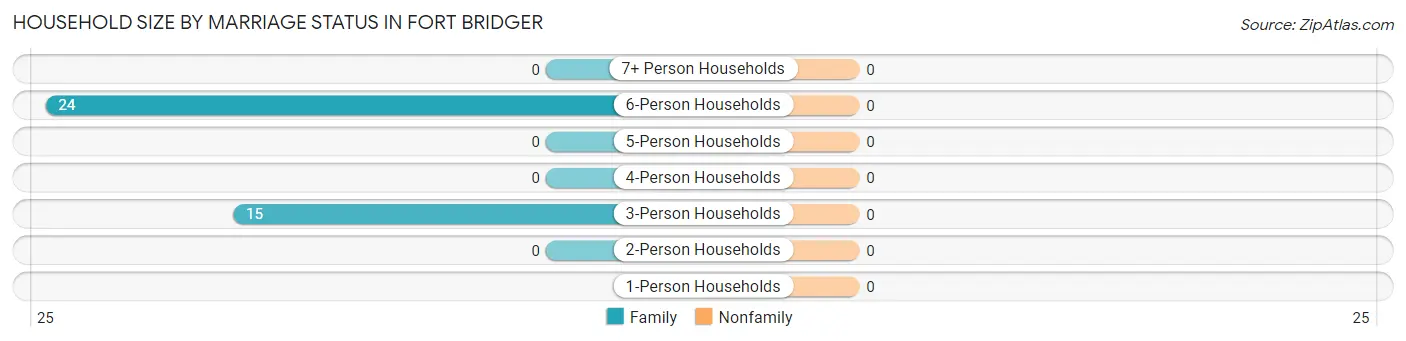
| Household Size | Family Households | Nonfamily Households |
| 1-Person Households | - | 0 (0.0%) |
| 2-Person Households | 0 (0.0%) | 0 (0.0%) |
| 3-Person Households | 15 (38.5%) | 0 (0.0%) |
| 4-Person Households | 0 (0.0%) | 0 (0.0%) |
| 5-Person Households | 0 (0.0%) | 0 (0.0%) |
| 6-Person Households | 24 (61.5%) | 0 (0.0%) |
| 7+ Person Households | 0 (0.0%) | 0 (0.0%) |
| Total | 39 (100.0%) | 0 (0.0%) |
Female Fertility in Fort Bridger
Fertility by Age in Fort Bridger
Average fertility rate in Fort Bridger is 328.0 births per 1,000 women. Women in the age bracket of 20 to 34 years have the highest fertility rate with 559.0 births per 1,000 women. Women in the age bracket of 20 to 34 years acount for 100.0% of all women with births.
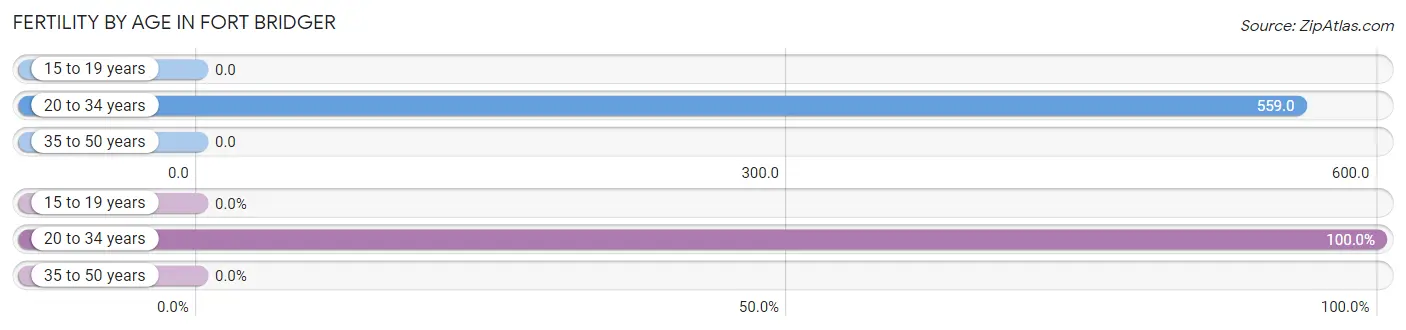
| Age Bracket | Women with Births | Births / 1,000 Women |
| 15 to 19 years | 0 (0.0%) | 0.0 |
| 20 to 34 years | 19 (100.0%) | 559.0 |
| 35 to 50 years | 0 (0.0%) | 0.0 |
| Total | 19 (100.0%) | 328.0 |
Fertility by Age by Marriage Status in Fort Bridger
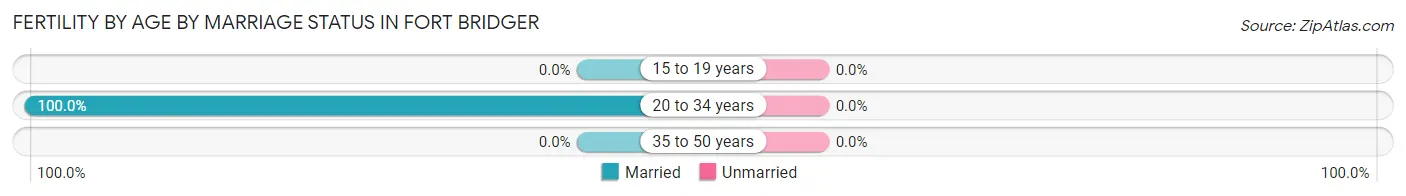
| Age Bracket | Married | Unmarried |
| 15 to 19 years | 0 (0.0%) | 0 (0.0%) |
| 20 to 34 years | 19 (100.0%) | 0 (0.0%) |
| 35 to 50 years | 0 (0.0%) | 0 (0.0%) |
| Total | 19 (100.0%) | 0 (0.0%) |
Fertility by Education in Fort Bridger
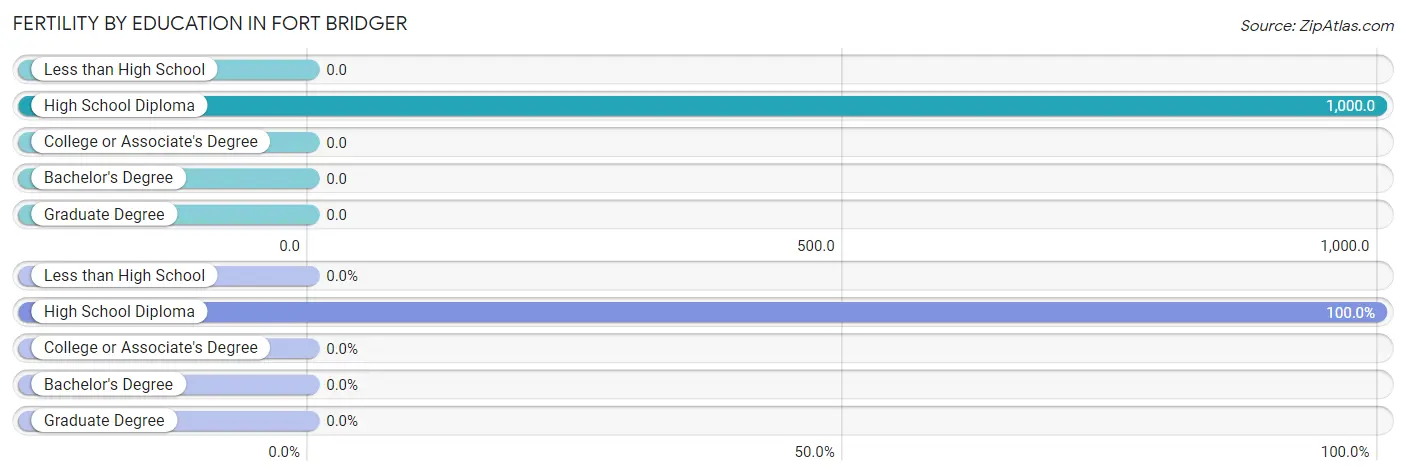
| Educational Attainment | Women with Births | Births / 1,000 Women |
| Less than High School | 0 (0.0%) | 0.0 |
| High School Diploma | 19 (100.0%) | 1,000.0 |
| College or Associate's Degree | 0 (0.0%) | 0.0 |
| Bachelor's Degree | 0 (0.0%) | 0.0 |
| Graduate Degree | 0 (0.0%) | 0.0 |
| Total | 19 (100.0%) | 328.0 |
Fertility by Education by Marriage Status in Fort Bridger
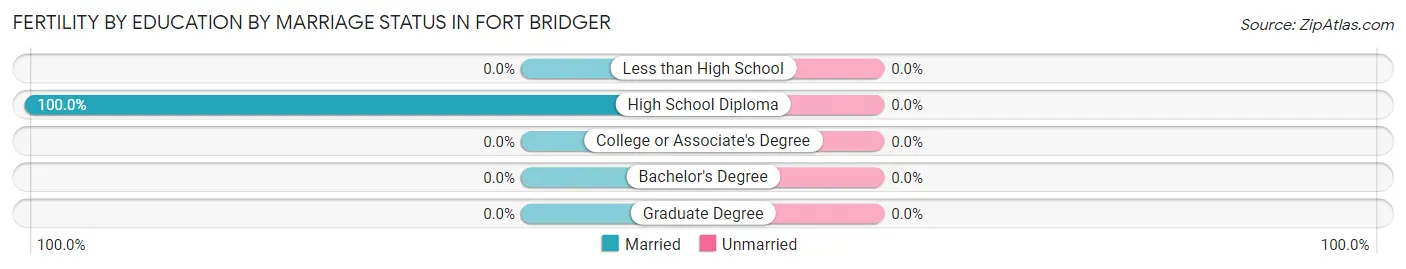
| Educational Attainment | Married | Unmarried |
| Less than High School | 0 (0.0%) | 0 (0.0%) |
| High School Diploma | 19 (100.0%) | 0 (0.0%) |
| College or Associate's Degree | 0 (0.0%) | 0 (0.0%) |
| Bachelor's Degree | 0 (0.0%) | 0 (0.0%) |
| Graduate Degree | 0 (0.0%) | 0 (0.0%) |
| Total | 19 (100.0%) | 0 (0.0%) |
Employment Characteristics in Fort Bridger
Employment by Class of Employer in Fort Bridger
Among the 119 employed individuals in Fort Bridger, private company employees (82 | 68.9%), and local government employees (37 | 31.1%) make up the most common classes of employment.
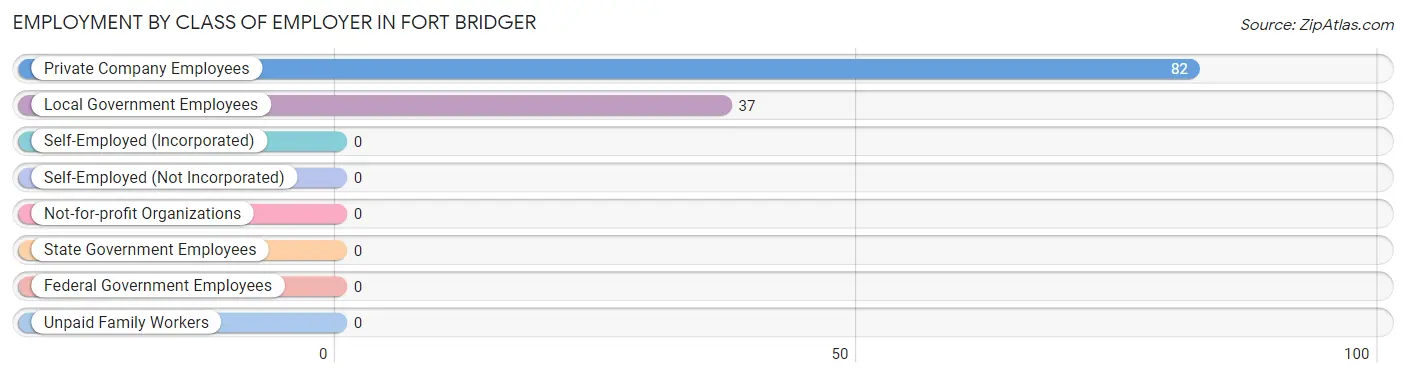
| Employer Class | # Employees | % Employees |
| Private Company Employees | 82 | 68.9% |
| Self-Employed (Incorporated) | 0 | 0.0% |
| Self-Employed (Not Incorporated) | 0 | 0.0% |
| Not-for-profit Organizations | 0 | 0.0% |
| Local Government Employees | 37 | 31.1% |
| State Government Employees | 0 | 0.0% |
| Federal Government Employees | 0 | 0.0% |
| Unpaid Family Workers | 0 | 0.0% |
| Total | 119 | 100.0% |
Employment Status by Age in Fort Bridger
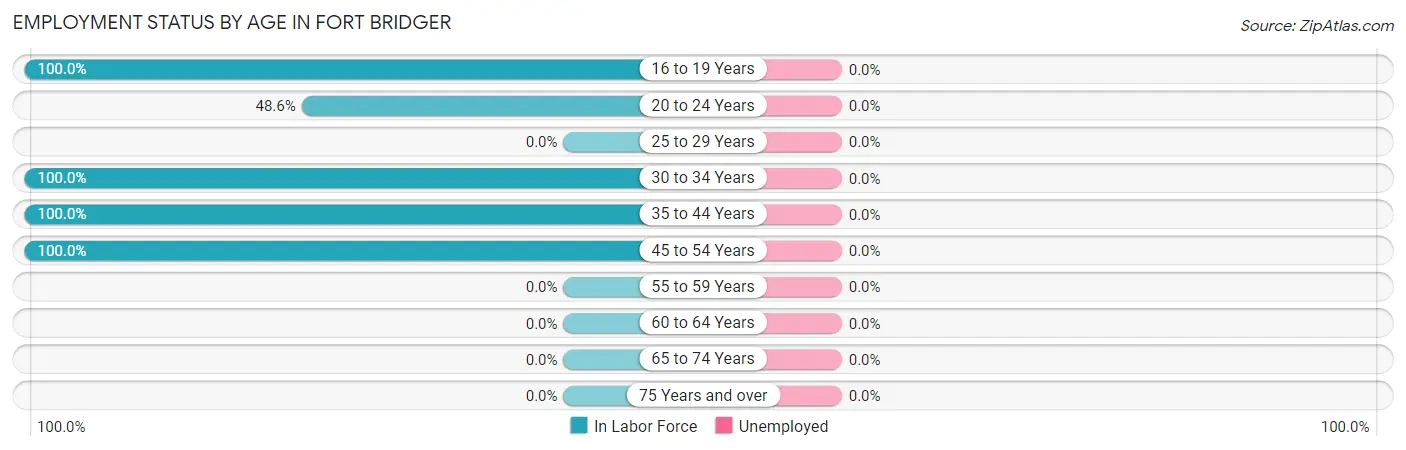
| Age Bracket | In Labor Force | Unemployed |
| 16 to 19 Years | 22 (100.0%) | 0 (0.0%) |
| 20 to 24 Years | 18 (48.6%) | 0 (0.0%) |
| 25 to 29 Years | 0 (0.0%) | 0 (0.0%) |
| 30 to 34 Years | 36 (100.0%) | 0 (0.0%) |
| 35 to 44 Years | 24 (100.0%) | 0 (0.0%) |
| 45 to 54 Years | 19 (100.0%) | 0 (0.0%) |
| 55 to 59 Years | 0 (0.0%) | 0 (0.0%) |
| 60 to 64 Years | 0 (0.0%) | 0 (0.0%) |
| 65 to 74 Years | 0 (0.0%) | 0 (0.0%) |
| 75 Years and over | 0 (0.0%) | 0 (0.0%) |
| Total | 119 (86.2%) | 0 (0.0%) |
Employment Status by Educational Attainment in Fort Bridger
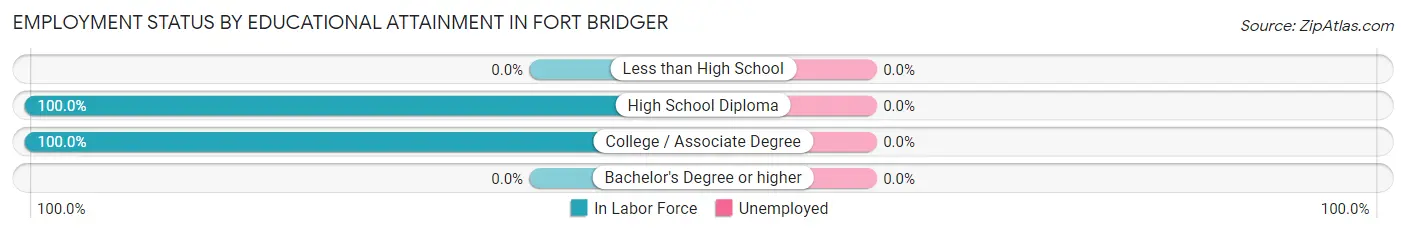
| Educational Attainment | In Labor Force | Unemployed |
| Less than High School | 0 (0.0%) | 0 (0.0%) |
| High School Diploma | 40 (100.0%) | 0 (0.0%) |
| College / Associate Degree | 39 (100.0%) | 0 (0.0%) |
| Bachelor's Degree or higher | 0 (0.0%) | 0 (0.0%) |
| Total | 79 (100.0%) | 0 (0.0%) |
Employment Occupations by Sex in Fort Bridger
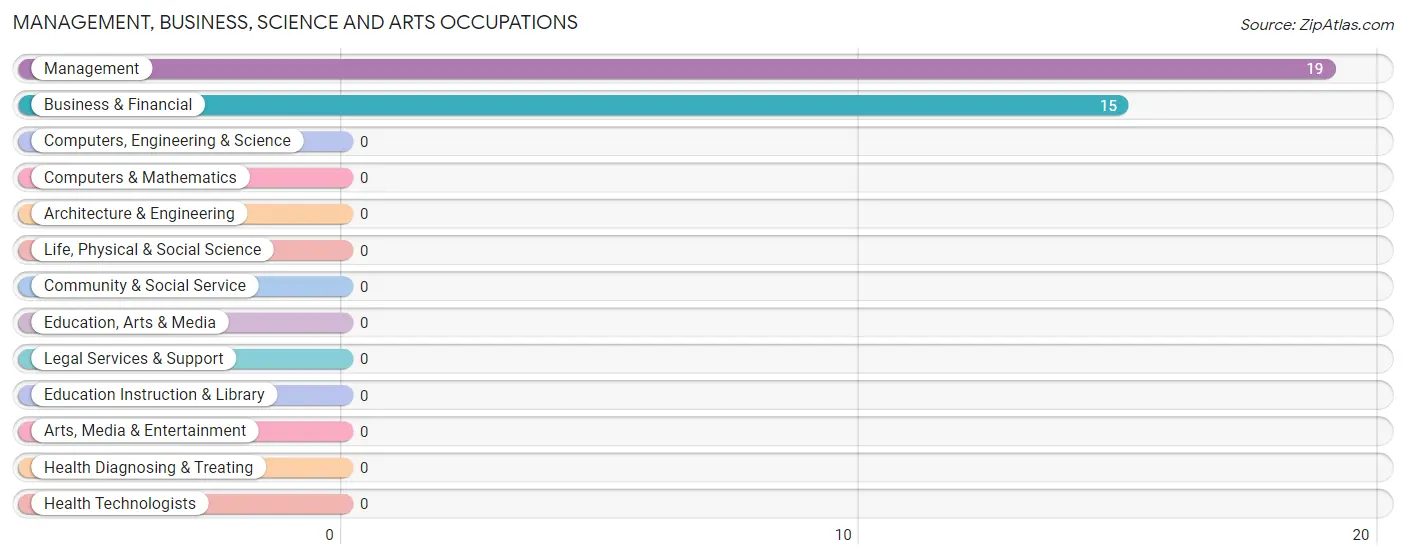
Management, Business, Science and Arts Occupations
The most common Management, Business, Science and Arts occupations in Fort Bridger are Management (19 | 16.0%), and Business & Financial (15 | 12.6%).
Management, Business, Science and Arts Occupations by Sex
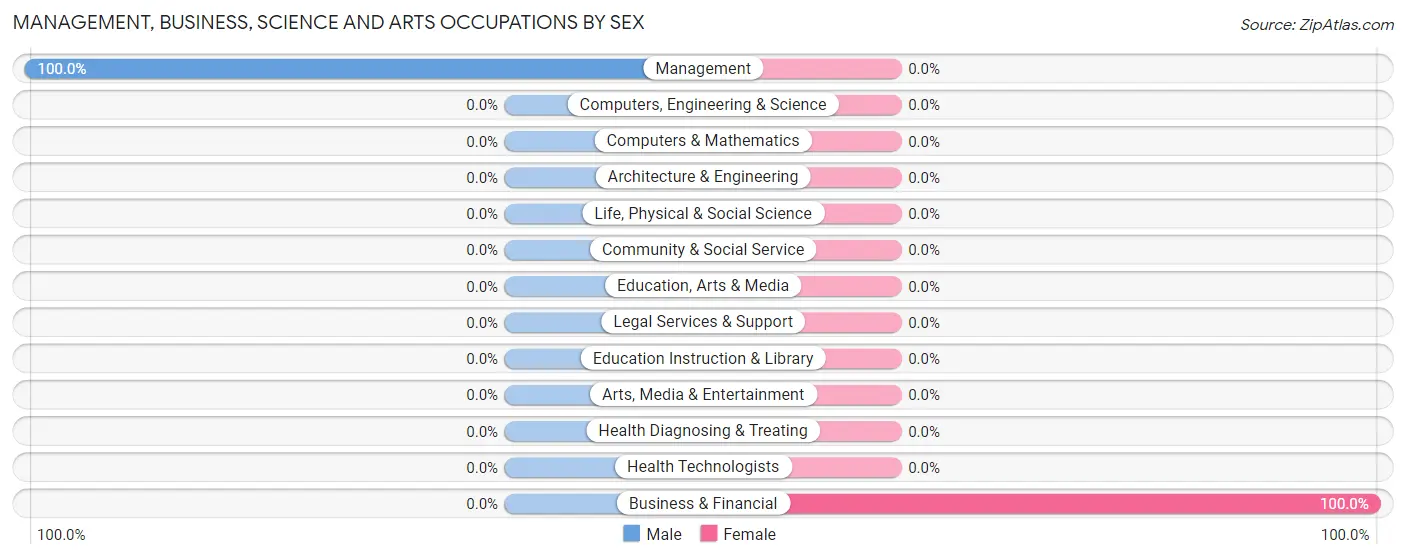
| Occupation | Male | Female |
| Management | 19 (100.0%) | 0 (0.0%) |
| Business & Financial | 0 (0.0%) | 15 (100.0%) |
| Computers, Engineering & Science | 0 (0.0%) | 0 (0.0%) |
| Computers & Mathematics | 0 (0.0%) | 0 (0.0%) |
| Architecture & Engineering | 0 (0.0%) | 0 (0.0%) |
| Life, Physical & Social Science | 0 (0.0%) | 0 (0.0%) |
| Community & Social Service | 0 (0.0%) | 0 (0.0%) |
| Education, Arts & Media | 0 (0.0%) | 0 (0.0%) |
| Legal Services & Support | 0 (0.0%) | 0 (0.0%) |
| Education Instruction & Library | 0 (0.0%) | 0 (0.0%) |
| Arts, Media & Entertainment | 0 (0.0%) | 0 (0.0%) |
| Health Diagnosing & Treating | 0 (0.0%) | 0 (0.0%) |
| Health Technologists | 0 (0.0%) | 0 (0.0%) |
| Total (Category) | 19 (55.9%) | 15 (44.1%) |
| Total (Overall) | 80 (67.2%) | 39 (32.8%) |
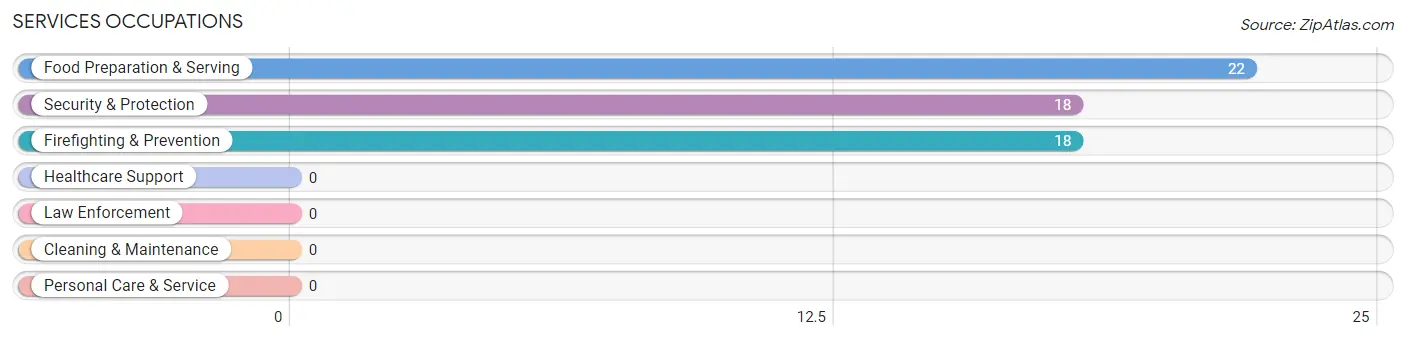
Services Occupations
The most common Services occupations in Fort Bridger are Food Preparation & Serving (22 | 18.5%), Security & Protection (18 | 15.1%), and Firefighting & Prevention (18 | 15.1%).
Services Occupations by Sex
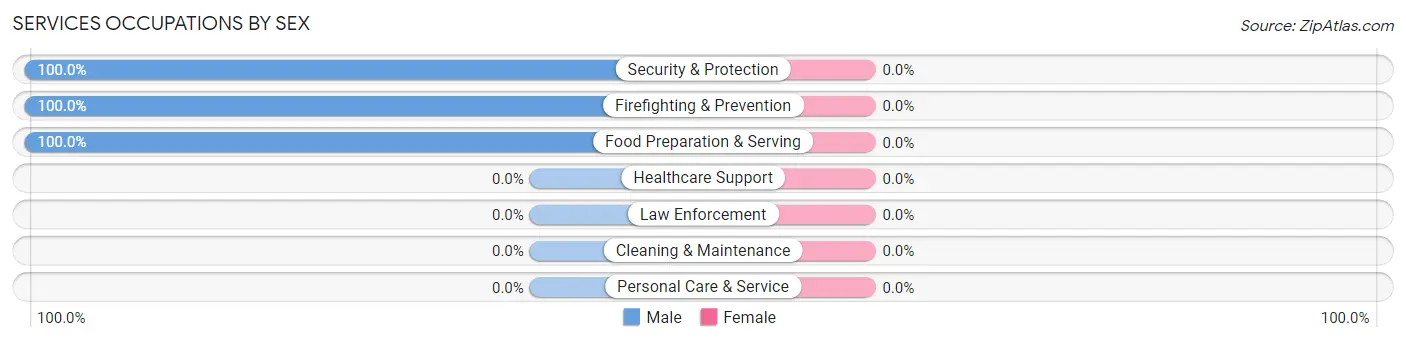
| Occupation | Male | Female |
| Healthcare Support | 0 (0.0%) | 0 (0.0%) |
| Security & Protection | 18 (100.0%) | 0 (0.0%) |
| Firefighting & Prevention | 18 (100.0%) | 0 (0.0%) |
| Law Enforcement | 0 (0.0%) | 0 (0.0%) |
| Food Preparation & Serving | 22 (100.0%) | 0 (0.0%) |
| Cleaning & Maintenance | 0 (0.0%) | 0 (0.0%) |
| Personal Care & Service | 0 (0.0%) | 0 (0.0%) |
| Total (Category) | 40 (100.0%) | 0 (0.0%) |
| Total (Overall) | 80 (67.2%) | 39 (32.8%) |
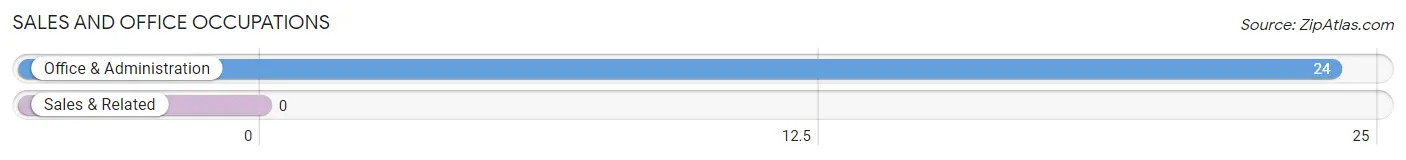
Sales and Office Occupations
The most common Sales and Office occupations in Fort Bridger are , and Office & Administration (24 | 20.2%).
Sales and Office Occupations by Sex
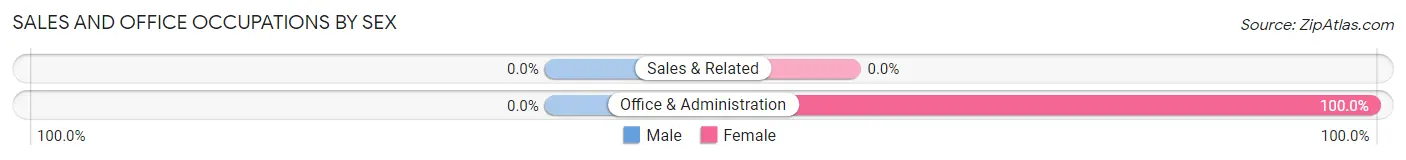
| Occupation | Male | Female |
| Sales & Related | 0 (0.0%) | 0 (0.0%) |
| Office & Administration | 0 (0.0%) | 24 (100.0%) |
| Total (Category) | 0 (0.0%) | 24 (100.0%) |
| Total (Overall) | 80 (67.2%) | 39 (32.8%) |
Natural Resources, Construction and Maintenance Occupations
Natural Resources, Construction and Maintenance Occupations by Sex
| Occupation | Male | Female |
| Farming, Fishing & Forestry | 0 (0.0%) | 0 (0.0%) |
| Construction & Extraction | 0 (0.0%) | 0 (0.0%) |
| Installation, Maintenance & Repair | 0 (0.0%) | 0 (0.0%) |
| Total (Category) | 0 (0.0%) | 0 (0.0%) |
| Total (Overall) | 80 (67.2%) | 39 (32.8%) |
Production, Transportation and Moving Occupations
The most common Production, Transportation and Moving occupations in Fort Bridger are , and Transportation (21 | 17.6%).
Production, Transportation and Moving Occupations by Sex
| Occupation | Male | Female |
| Production | 0 (0.0%) | 0 (0.0%) |
| Transportation | 21 (100.0%) | 0 (0.0%) |
| Material Moving | 0 (0.0%) | 0 (0.0%) |
| Total (Category) | 21 (100.0%) | 0 (0.0%) |
| Total (Overall) | 80 (67.2%) | 39 (32.8%) |
Employment Industries by Sex in Fort Bridger
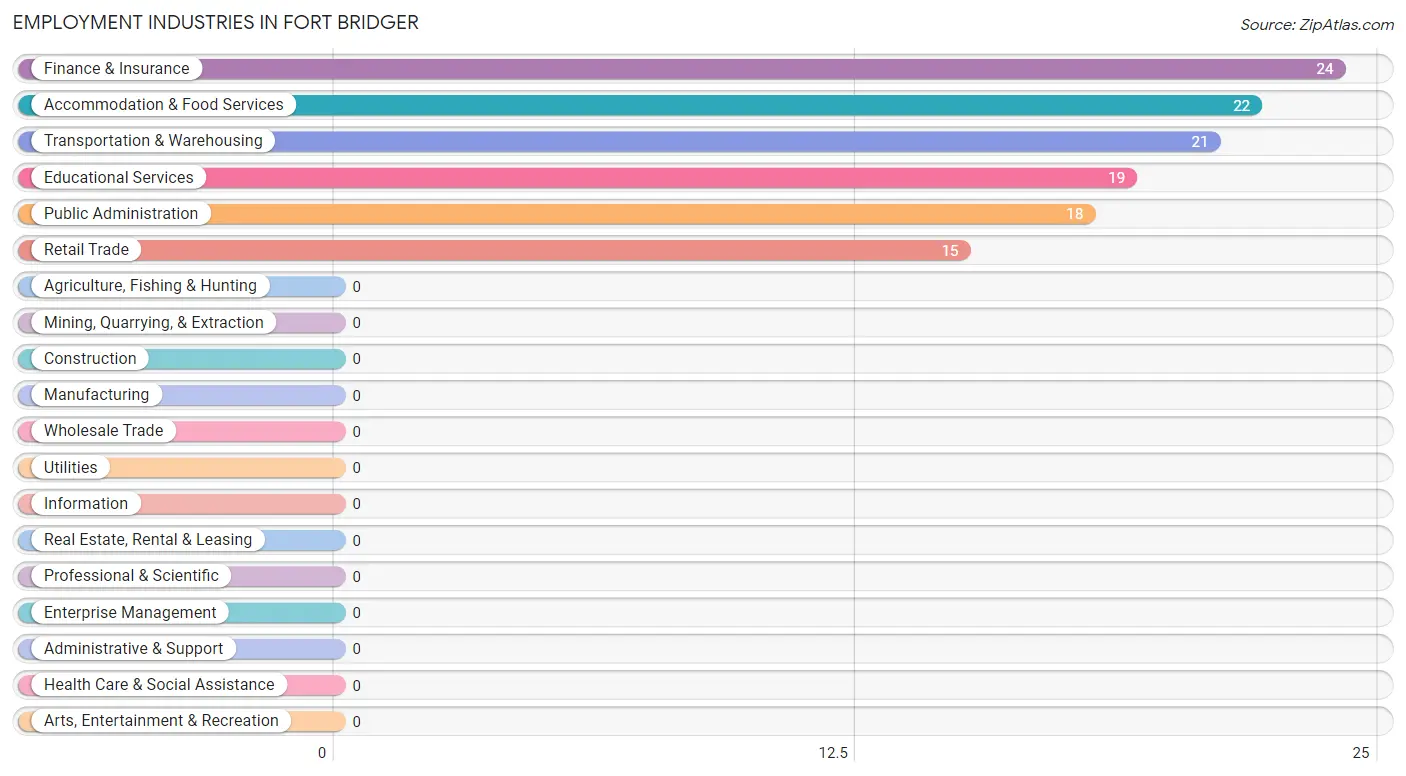
Employment Industries in Fort Bridger
The major employment industries in Fort Bridger include Finance & Insurance (24 | 20.2%), Accommodation & Food Services (22 | 18.5%), Transportation & Warehousing (21 | 17.6%), Educational Services (19 | 16.0%), and Public Administration (18 | 15.1%).
Employment Industries by Sex in Fort Bridger
The Fort Bridger industries that see more men than women are Transportation & Warehousing (100.0%), Educational Services (100.0%), and Accommodation & Food Services (100.0%), whereas the industries that tend to have a higher number of women are Retail Trade (100.0%), and Finance & Insurance (100.0%).
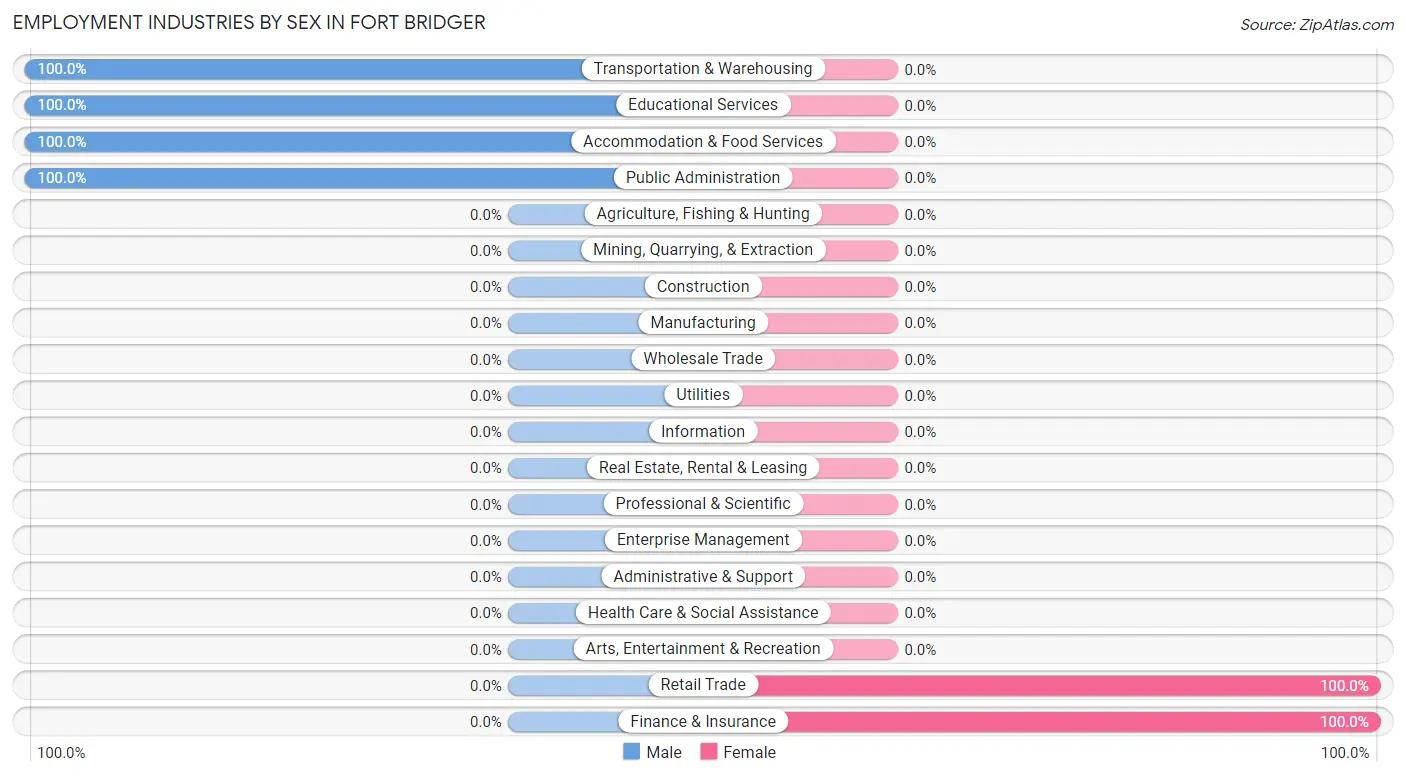
| Industry | Male | Female |
| Agriculture, Fishing & Hunting | 0 (0.0%) | 0 (0.0%) |
| Mining, Quarrying, & Extraction | 0 (0.0%) | 0 (0.0%) |
| Construction | 0 (0.0%) | 0 (0.0%) |
| Manufacturing | 0 (0.0%) | 0 (0.0%) |
| Wholesale Trade | 0 (0.0%) | 0 (0.0%) |
| Retail Trade | 0 (0.0%) | 15 (100.0%) |
| Transportation & Warehousing | 21 (100.0%) | 0 (0.0%) |
| Utilities | 0 (0.0%) | 0 (0.0%) |
| Information | 0 (0.0%) | 0 (0.0%) |
| Finance & Insurance | 0 (0.0%) | 24 (100.0%) |
| Real Estate, Rental & Leasing | 0 (0.0%) | 0 (0.0%) |
| Professional & Scientific | 0 (0.0%) | 0 (0.0%) |
| Enterprise Management | 0 (0.0%) | 0 (0.0%) |
| Administrative & Support | 0 (0.0%) | 0 (0.0%) |
| Educational Services | 19 (100.0%) | 0 (0.0%) |
| Health Care & Social Assistance | 0 (0.0%) | 0 (0.0%) |
| Arts, Entertainment & Recreation | 0 (0.0%) | 0 (0.0%) |
| Accommodation & Food Services | 22 (100.0%) | 0 (0.0%) |
| Public Administration | 18 (100.0%) | 0 (0.0%) |
| Total | 80 (67.2%) | 39 (32.8%) |
Education in Fort Bridger
School Enrollment in Fort Bridger
The most common levels of schooling among the 43 students in Fort Bridger are high school (22 | 51.2%), and elementary school (21 | 48.8%).
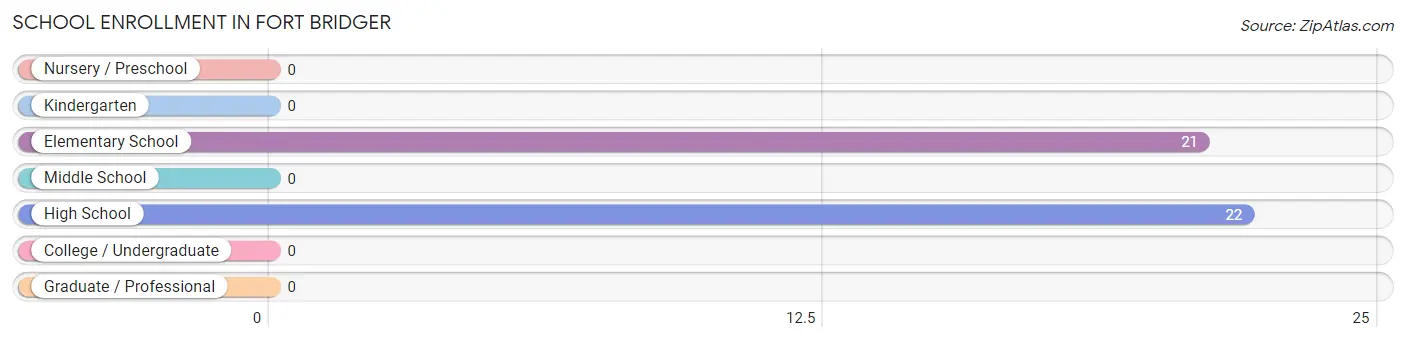
| School Level | # Students | % Students |
| Nursery / Preschool | 0 | 0.0% |
| Kindergarten | 0 | 0.0% |
| Elementary School | 21 | 48.8% |
| Middle School | 0 | 0.0% |
| High School | 22 | 51.2% |
| College / Undergraduate | 0 | 0.0% |
| Graduate / Professional | 0 | 0.0% |
| Total | 43 | 100.0% |
School Enrollment by Age by Funding Source in Fort Bridger
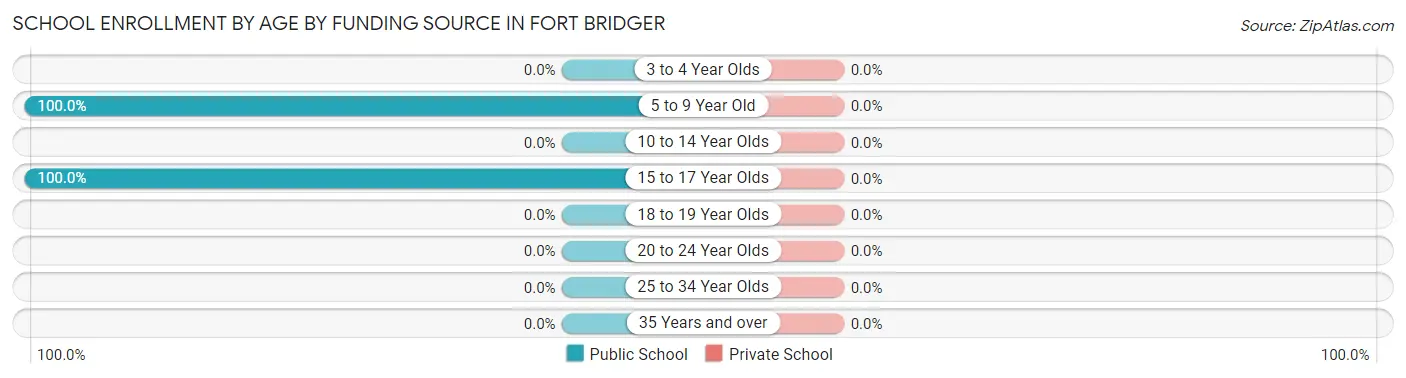
| Age Bracket | Public School | Private School |
| 3 to 4 Year Olds | 0 (0.0%) | 0 (0.0%) |
| 5 to 9 Year Old | 21 (100.0%) | 0 (0.0%) |
| 10 to 14 Year Olds | 0 (0.0%) | 0 (0.0%) |
| 15 to 17 Year Olds | 22 (100.0%) | 0 (0.0%) |
| 18 to 19 Year Olds | 0 (0.0%) | 0 (0.0%) |
| 20 to 24 Year Olds | 0 (0.0%) | 0 (0.0%) |
| 25 to 34 Year Olds | 0 (0.0%) | 0 (0.0%) |
| 35 Years and over | 0 (0.0%) | 0 (0.0%) |
| Total | 43 (100.0%) | 0 (0.0%) |
Educational Attainment by Field of Study in Fort Bridger
| Field of Study | # Graduates | % Graduates |
| Computers & Mathematics | 0 | 0.0% |
| Bio, Nature & Agricultural | 0 | 0.0% |
| Physical & Health Sciences | 0 | 0.0% |
| Psychology | 0 | 0.0% |
| Social Sciences | 0 | 0.0% |
| Engineering | 0 | 0.0% |
| Multidisciplinary Studies | 0 | 0.0% |
| Science & Technology | 0 | 0.0% |
| Business | 0 | 0.0% |
| Education | 0 | 0.0% |
| Literature & Languages | 0 | 0.0% |
| Liberal Arts & History | 0 | 0.0% |
| Visual & Performing Arts | 0 | 0.0% |
| Communications | 0 | 0.0% |
| Arts & Humanities | 0 | 0.0% |
| Total | 0 | 0.0% |
Transportation & Commute in Fort Bridger
Vehicle Availability by Sex in Fort Bridger
The most prevalent vehicle ownership categories in Fort Bridger are males with 5 or more vehicles (59, accounting for 73.8%) and females with 5 or more vehicles (24, making up 151.3%).
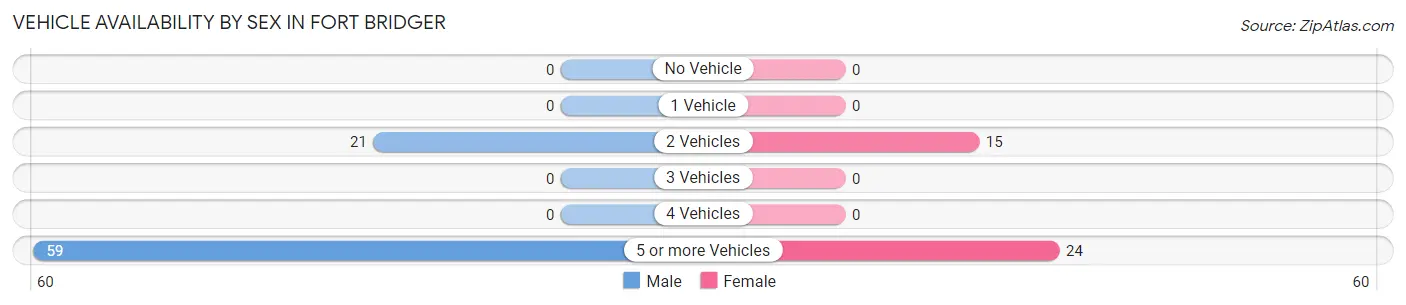
| Vehicles Available | Male | Female |
| No Vehicle | 0 (0.0%) | 0 (0.0%) |
| 1 Vehicle | 0 (0.0%) | 0 (0.0%) |
| 2 Vehicles | 21 (26.3%) | 15 (38.5%) |
| 3 Vehicles | 0 (0.0%) | 0 (0.0%) |
| 4 Vehicles | 0 (0.0%) | 0 (0.0%) |
| 5 or more Vehicles | 59 (73.8%) | 24 (61.5%) |
| Total | 80 (100.0%) | 39 (100.0%) |
Commute Time in Fort Bridger
The most frequently occuring commute durations in Fort Bridger are 5 to 9 minutes (83 commuters, 69.8%), 10 to 14 minutes (21 commuters, 17.6%), and 20 to 24 minutes (15 commuters, 12.6%).
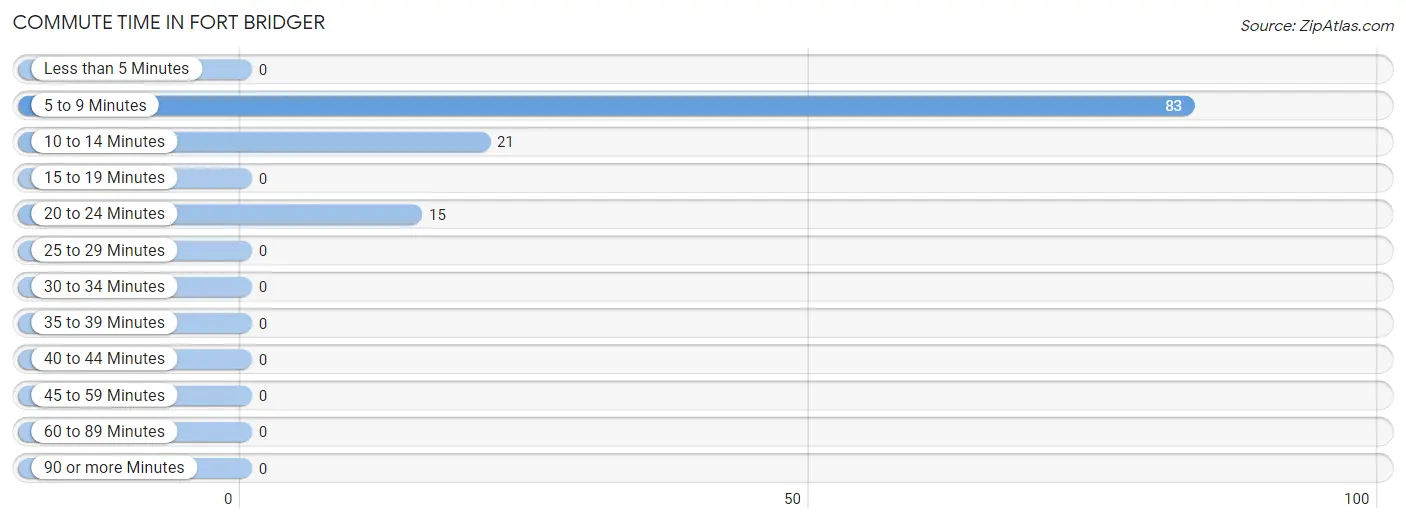
| Commute Time | # Commuters | % Commuters |
| Less than 5 Minutes | 0 | 0.0% |
| 5 to 9 Minutes | 83 | 69.8% |
| 10 to 14 Minutes | 21 | 17.6% |
| 15 to 19 Minutes | 0 | 0.0% |
| 20 to 24 Minutes | 15 | 12.6% |
| 25 to 29 Minutes | 0 | 0.0% |
| 30 to 34 Minutes | 0 | 0.0% |
| 35 to 39 Minutes | 0 | 0.0% |
| 40 to 44 Minutes | 0 | 0.0% |
| 45 to 59 Minutes | 0 | 0.0% |
| 60 to 89 Minutes | 0 | 0.0% |
| 90 or more Minutes | 0 | 0.0% |
Commute Time by Sex in Fort Bridger
The most common commute times in Fort Bridger are 5 to 9 minutes (59 commuters, 73.8%) for males and 5 to 9 minutes (24 commuters, 61.5%) for females.
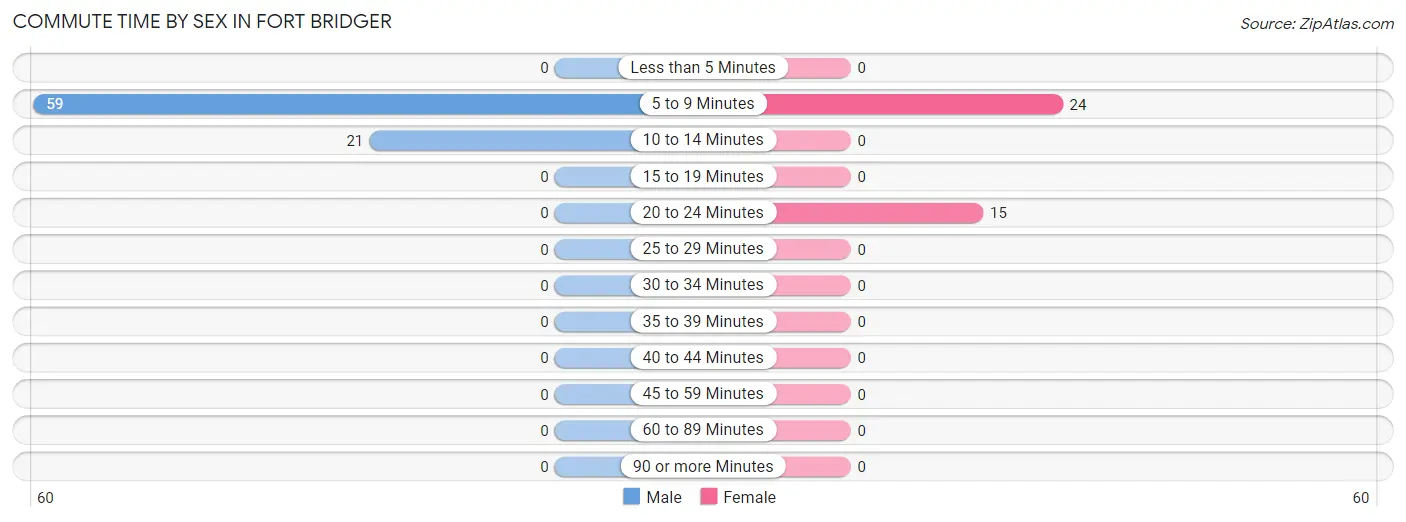
| Commute Time | Male | Female |
| Less than 5 Minutes | 0 (0.0%) | 0 (0.0%) |
| 5 to 9 Minutes | 59 (73.8%) | 24 (61.5%) |
| 10 to 14 Minutes | 21 (26.3%) | 0 (0.0%) |
| 15 to 19 Minutes | 0 (0.0%) | 0 (0.0%) |
| 20 to 24 Minutes | 0 (0.0%) | 15 (38.5%) |
| 25 to 29 Minutes | 0 (0.0%) | 0 (0.0%) |
| 30 to 34 Minutes | 0 (0.0%) | 0 (0.0%) |
| 35 to 39 Minutes | 0 (0.0%) | 0 (0.0%) |
| 40 to 44 Minutes | 0 (0.0%) | 0 (0.0%) |
| 45 to 59 Minutes | 0 (0.0%) | 0 (0.0%) |
| 60 to 89 Minutes | 0 (0.0%) | 0 (0.0%) |
| 90 or more Minutes | 0 (0.0%) | 0 (0.0%) |
Time of Departure to Work by Sex in Fort Bridger
The most frequent times of departure to work in Fort Bridger are 11:00 AM to 11:59 AM (22, 27.5%) for males and 7:30 AM to 7:59 AM (39, 100.0%) for females.
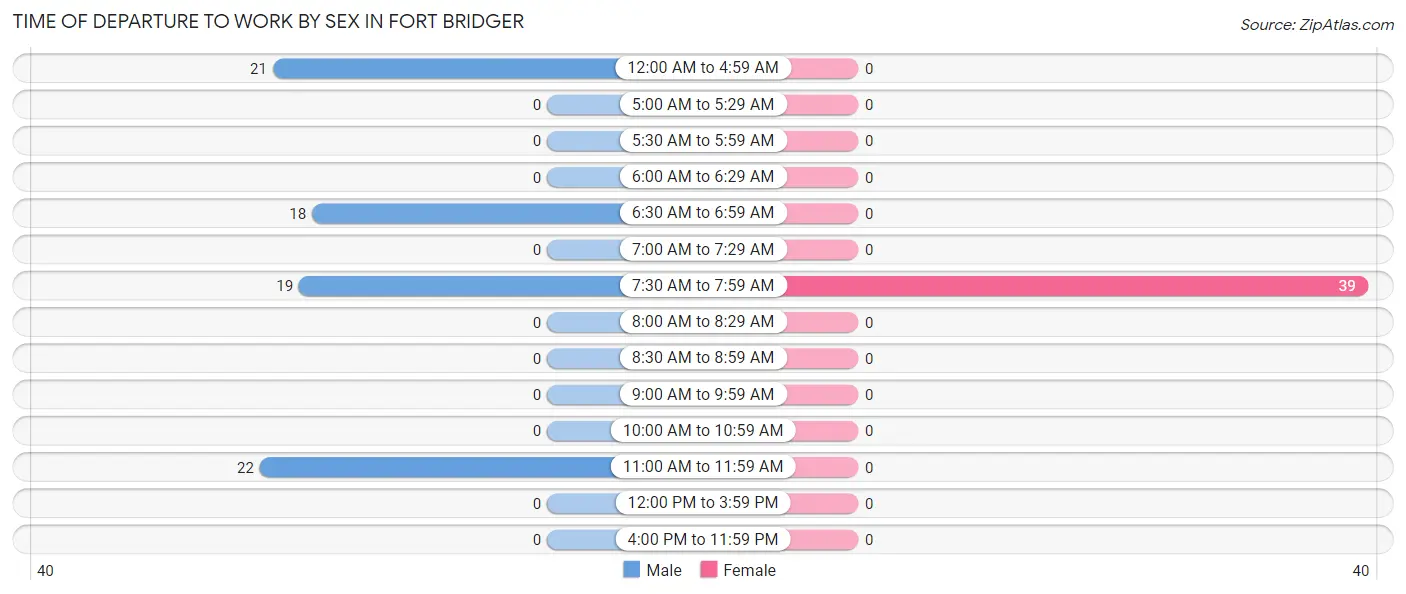
| Time of Departure | Male | Female |
| 12:00 AM to 4:59 AM | 21 (26.3%) | 0 (0.0%) |
| 5:00 AM to 5:29 AM | 0 (0.0%) | 0 (0.0%) |
| 5:30 AM to 5:59 AM | 0 (0.0%) | 0 (0.0%) |
| 6:00 AM to 6:29 AM | 0 (0.0%) | 0 (0.0%) |
| 6:30 AM to 6:59 AM | 18 (22.5%) | 0 (0.0%) |
| 7:00 AM to 7:29 AM | 0 (0.0%) | 0 (0.0%) |
| 7:30 AM to 7:59 AM | 19 (23.7%) | 39 (100.0%) |
| 8:00 AM to 8:29 AM | 0 (0.0%) | 0 (0.0%) |
| 8:30 AM to 8:59 AM | 0 (0.0%) | 0 (0.0%) |
| 9:00 AM to 9:59 AM | 0 (0.0%) | 0 (0.0%) |
| 10:00 AM to 10:59 AM | 0 (0.0%) | 0 (0.0%) |
| 11:00 AM to 11:59 AM | 22 (27.5%) | 0 (0.0%) |
| 12:00 PM to 3:59 PM | 0 (0.0%) | 0 (0.0%) |
| 4:00 PM to 11:59 PM | 0 (0.0%) | 0 (0.0%) |
| Total | 80 (100.0%) | 39 (100.0%) |
Housing Occupancy in Fort Bridger
Occupancy by Ownership in Fort Bridger
Of the total 39 dwellings in Fort Bridger, owner-occupied units account for 39 (100.0%), while renter-occupied units make up 0 (0.0%).
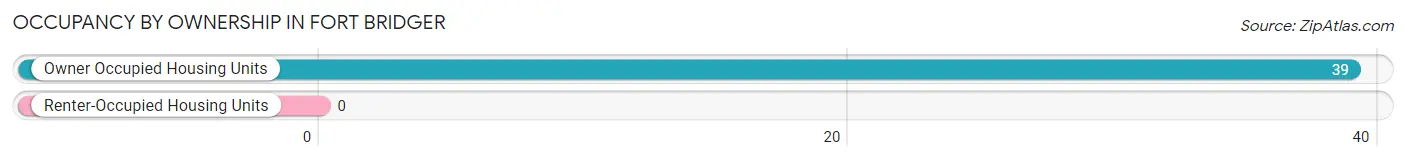
| Occupancy | # Housing Units | % Housing Units |
| Owner Occupied Housing Units | 39 | 100.0% |
| Renter-Occupied Housing Units | 0 | 0.0% |
| Total Occupied Housing Units | 39 | 100.0% |
Occupancy by Household Size in Fort Bridger
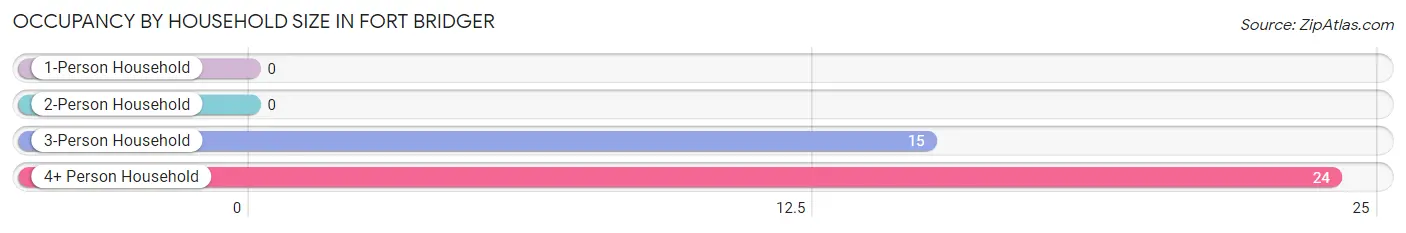
| Household Size | # Housing Units | % Housing Units |
| 1-Person Household | 0 | 0.0% |
| 2-Person Household | 0 | 0.0% |
| 3-Person Household | 15 | 38.5% |
| 4+ Person Household | 24 | 61.5% |
| Total Housing Units | 39 | 100.0% |
Occupancy by Ownership by Household Size in Fort Bridger
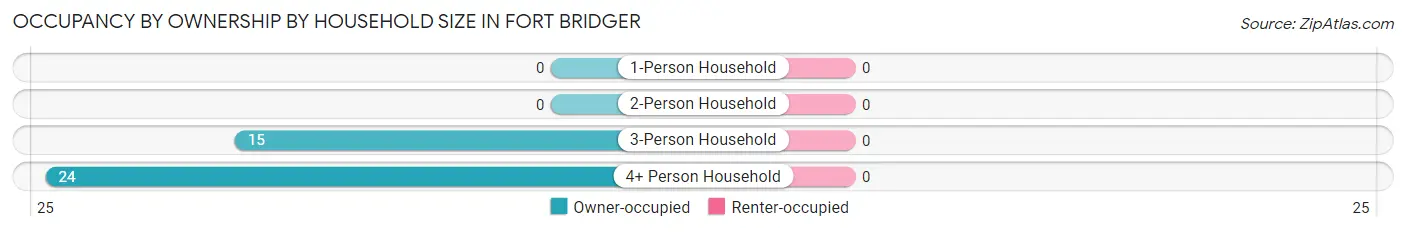
| Household Size | Owner-occupied | Renter-occupied |
| 1-Person Household | 0 (0.0%) | 0 (0.0%) |
| 2-Person Household | 0 (0.0%) | 0 (0.0%) |
| 3-Person Household | 15 (100.0%) | 0 (0.0%) |
| 4+ Person Household | 24 (100.0%) | 0 (0.0%) |
| Total Housing Units | 39 (100.0%) | 0 (0.0%) |
Occupancy by Educational Attainment in Fort Bridger
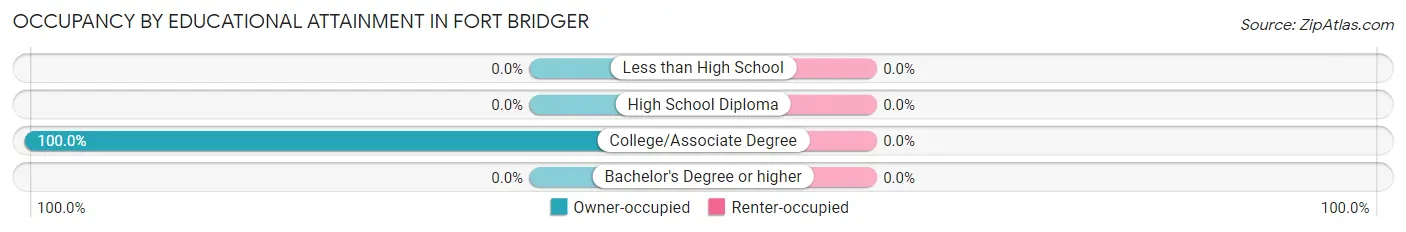
| Household Size | Owner-occupied | Renter-occupied |
| Less than High School | 0 (0.0%) | 0 (0.0%) |
| High School Diploma | 0 (0.0%) | 0 (0.0%) |
| College/Associate Degree | 39 (100.0%) | 0 (0.0%) |
| Bachelor's Degree or higher | 0 (0.0%) | 0 (0.0%) |
Occupancy by Age of Householder in Fort Bridger
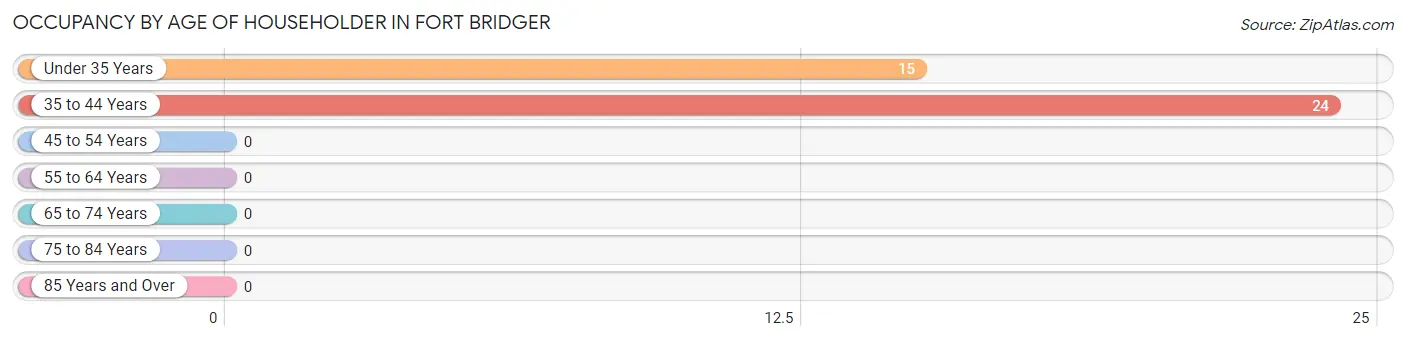
| Age Bracket | # Households | % Households |
| Under 35 Years | 15 | 38.5% |
| 35 to 44 Years | 24 | 61.5% |
| 45 to 54 Years | 0 | 0.0% |
| 55 to 64 Years | 0 | 0.0% |
| 65 to 74 Years | 0 | 0.0% |
| 75 to 84 Years | 0 | 0.0% |
| 85 Years and Over | 0 | 0.0% |
| Total | 39 | 100.0% |
Housing Finances in Fort Bridger
Median Income by Occupancy in Fort Bridger
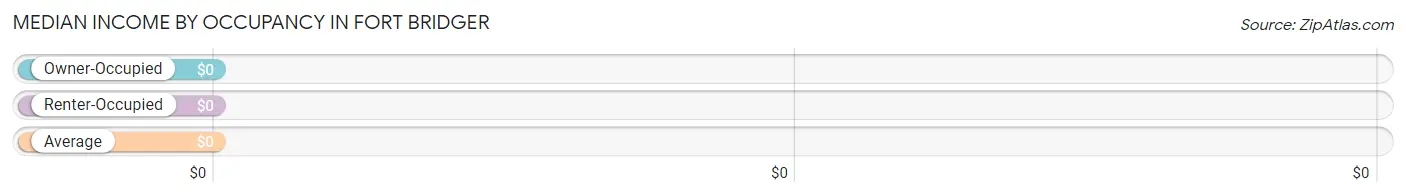
| Occupancy Type | # Households | Median Income |
| Owner-Occupied | 39 (100.0%) | $0 |
| Renter-Occupied | 0 (0.0%) | $0 |
| Average | 39 (100.0%) | $0 |
Occupancy by Householder Income Bracket in Fort Bridger
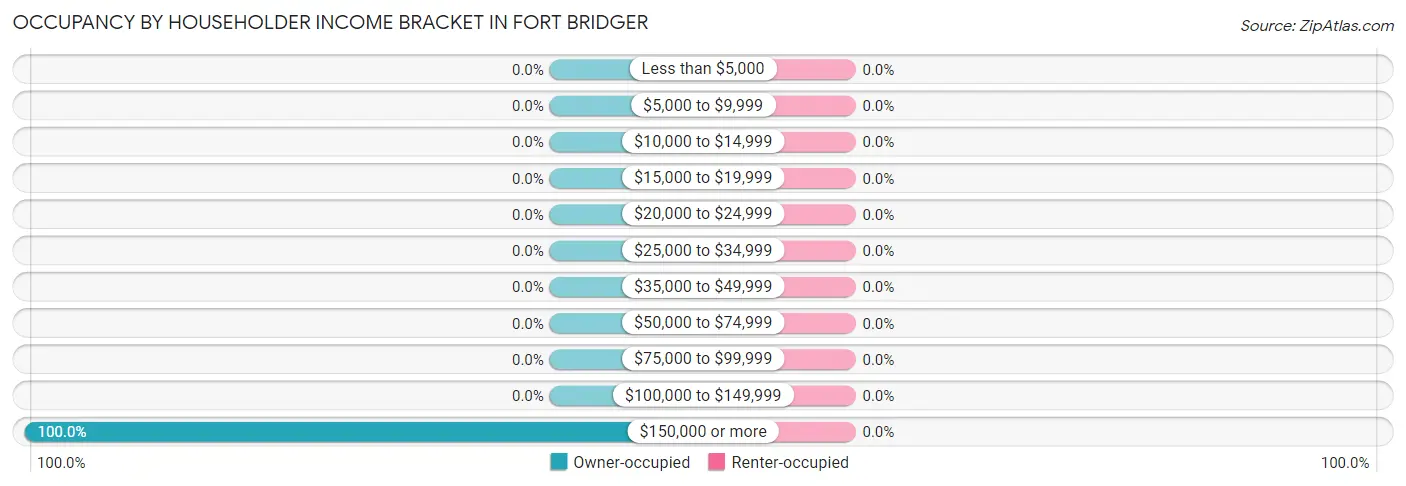
| Income Bracket | Owner-occupied | Renter-occupied |
| Less than $5,000 | 0 (0.0%) | 0 (0.0%) |
| $5,000 to $9,999 | 0 (0.0%) | 0 (0.0%) |
| $10,000 to $14,999 | 0 (0.0%) | 0 (0.0%) |
| $15,000 to $19,999 | 0 (0.0%) | 0 (0.0%) |
| $20,000 to $24,999 | 0 (0.0%) | 0 (0.0%) |
| $25,000 to $34,999 | 0 (0.0%) | 0 (0.0%) |
| $35,000 to $49,999 | 0 (0.0%) | 0 (0.0%) |
| $50,000 to $74,999 | 0 (0.0%) | 0 (0.0%) |
| $75,000 to $99,999 | 0 (0.0%) | 0 (0.0%) |
| $100,000 to $149,999 | 0 (0.0%) | 0 (0.0%) |
| $150,000 or more | 39 (100.0%) | 0 (0.0%) |
| Total | 39 (100.0%) | 0 (0.0%) |
Monthly Housing Cost Tiers in Fort Bridger
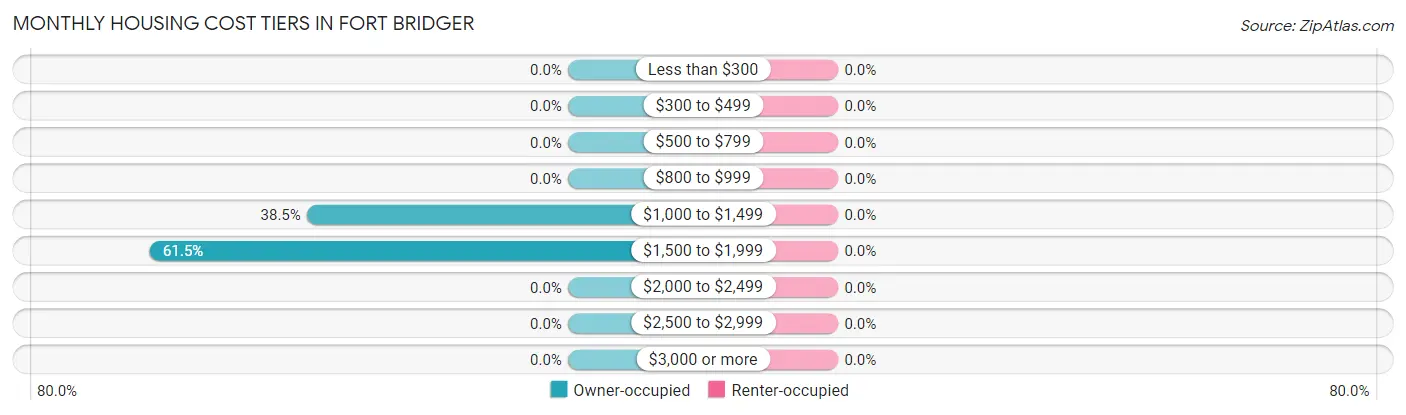
| Monthly Cost | Owner-occupied | Renter-occupied |
| Less than $300 | 0 (0.0%) | 0 (0.0%) |
| $300 to $499 | 0 (0.0%) | 0 (0.0%) |
| $500 to $799 | 0 (0.0%) | 0 (0.0%) |
| $800 to $999 | 0 (0.0%) | 0 (0.0%) |
| $1,000 to $1,499 | 15 (38.5%) | 0 (0.0%) |
| $1,500 to $1,999 | 24 (61.5%) | 0 (0.0%) |
| $2,000 to $2,499 | 0 (0.0%) | 0 (0.0%) |
| $2,500 to $2,999 | 0 (0.0%) | 0 (0.0%) |
| $3,000 or more | 0 (0.0%) | 0 (0.0%) |
| Total | 39 (100.0%) | 0 (0.0%) |
Physical Housing Characteristics in Fort Bridger
Housing Structures in Fort Bridger
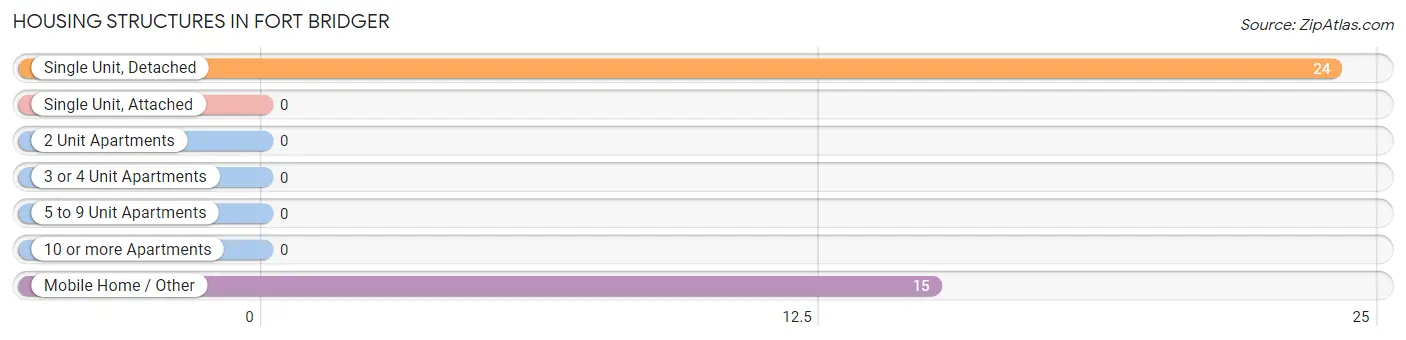
| Structure Type | # Housing Units | % Housing Units |
| Single Unit, Detached | 24 | 61.5% |
| Single Unit, Attached | 0 | 0.0% |
| 2 Unit Apartments | 0 | 0.0% |
| 3 or 4 Unit Apartments | 0 | 0.0% |
| 5 to 9 Unit Apartments | 0 | 0.0% |
| 10 or more Apartments | 0 | 0.0% |
| Mobile Home / Other | 15 | 38.5% |
| Total | 39 | 100.0% |
Housing Structures by Occupancy in Fort Bridger
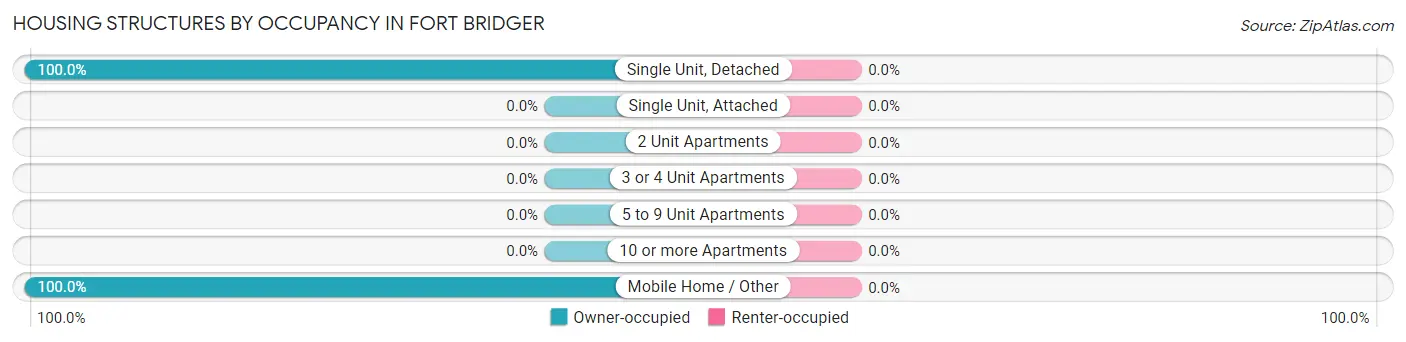
| Structure Type | Owner-occupied | Renter-occupied |
| Single Unit, Detached | 24 (100.0%) | 0 (0.0%) |
| Single Unit, Attached | 0 (0.0%) | 0 (0.0%) |
| 2 Unit Apartments | 0 (0.0%) | 0 (0.0%) |
| 3 or 4 Unit Apartments | 0 (0.0%) | 0 (0.0%) |
| 5 to 9 Unit Apartments | 0 (0.0%) | 0 (0.0%) |
| 10 or more Apartments | 0 (0.0%) | 0 (0.0%) |
| Mobile Home / Other | 15 (100.0%) | 0 (0.0%) |
| Total | 39 (100.0%) | 0 (0.0%) |
Housing Structures by Number of Rooms in Fort Bridger
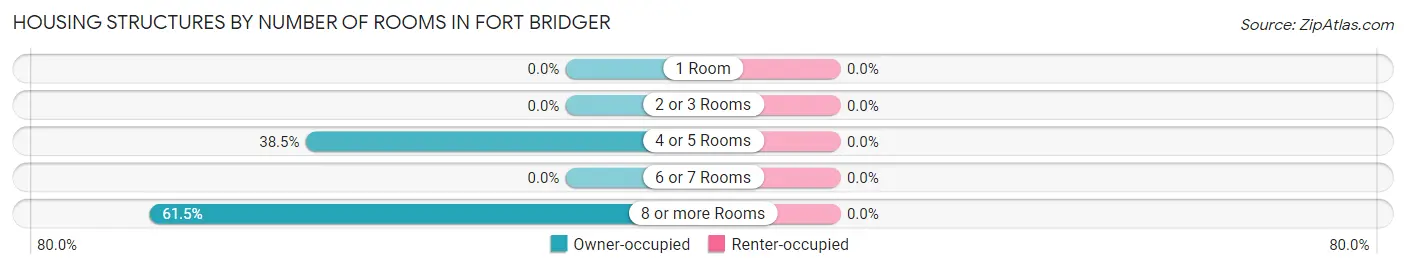
| Number of Rooms | Owner-occupied | Renter-occupied |
| 1 Room | 0 (0.0%) | 0 (0.0%) |
| 2 or 3 Rooms | 0 (0.0%) | 0 (0.0%) |
| 4 or 5 Rooms | 15 (38.5%) | 0 (0.0%) |
| 6 or 7 Rooms | 0 (0.0%) | 0 (0.0%) |
| 8 or more Rooms | 24 (61.5%) | 0 (0.0%) |
| Total | 39 (100.0%) | 0 (0.0%) |
Housing Structure by Heating Type in Fort Bridger
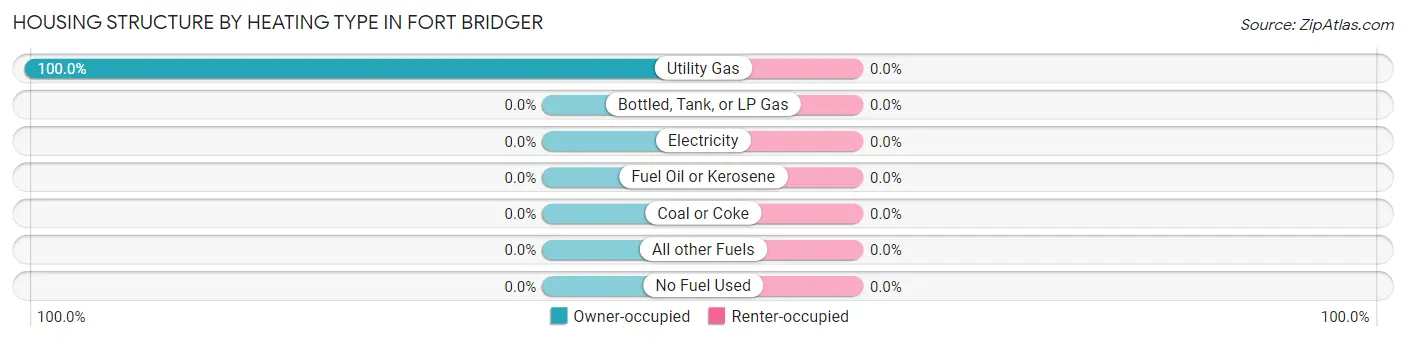
| Heating Type | Owner-occupied | Renter-occupied |
| Utility Gas | 39 (100.0%) | 0 (0.0%) |
| Bottled, Tank, or LP Gas | 0 (0.0%) | 0 (0.0%) |
| Electricity | 0 (0.0%) | 0 (0.0%) |
| Fuel Oil or Kerosene | 0 (0.0%) | 0 (0.0%) |
| Coal or Coke | 0 (0.0%) | 0 (0.0%) |
| All other Fuels | 0 (0.0%) | 0 (0.0%) |
| No Fuel Used | 0 (0.0%) | 0 (0.0%) |
| Total | 39 (100.0%) | 0 (0.0%) |
Household Vehicle Usage in Fort Bridger
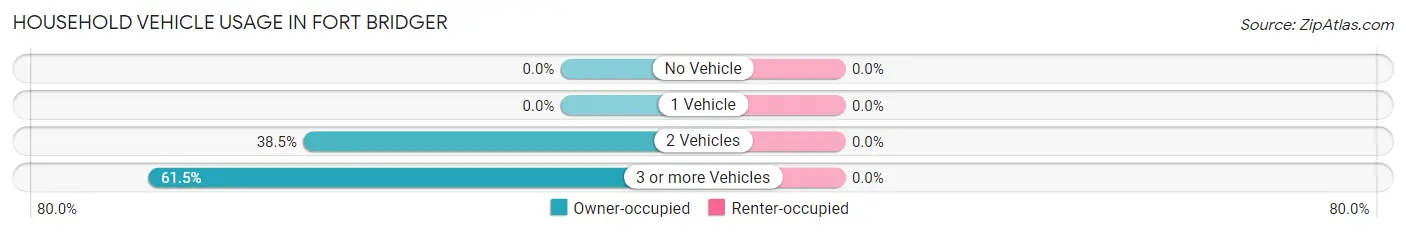
| Vehicles per Household | Owner-occupied | Renter-occupied |
| No Vehicle | 0 (0.0%) | 0 (0.0%) |
| 1 Vehicle | 0 (0.0%) | 0 (0.0%) |
| 2 Vehicles | 15 (38.5%) | 0 (0.0%) |
| 3 or more Vehicles | 24 (61.5%) | 0 (0.0%) |
| Total | 39 (100.0%) | 0 (0.0%) |
Real Estate & Mortgages in Fort Bridger
Real Estate and Mortgage Overview in Fort Bridger
| Characteristic | Without Mortgage | With Mortgage |
| Housing Units | 0 | 39 |
| Median Property Value | - | - |
| Median Household Income | - | - |
| Monthly Housing Costs | - | - |
| Real Estate Taxes | - | - |
Property Value by Mortgage Status in Fort Bridger
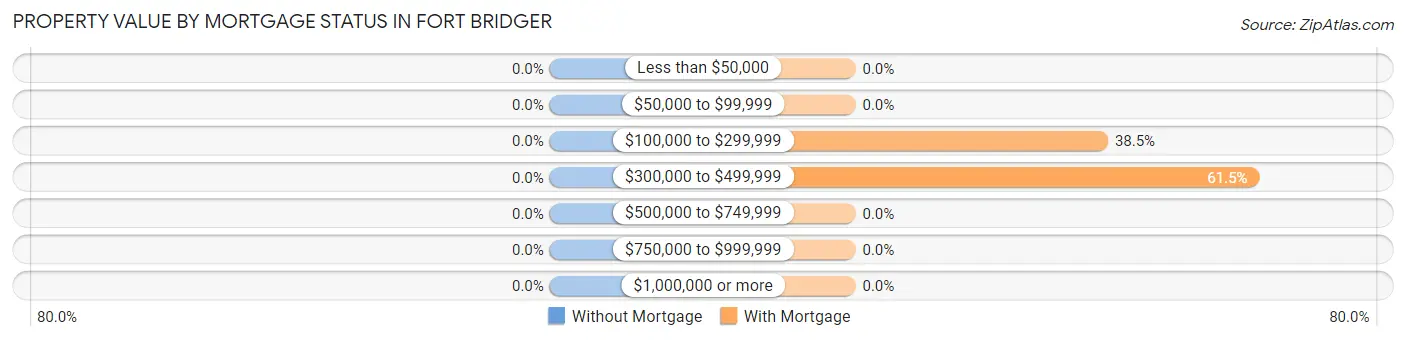
| Property Value | Without Mortgage | With Mortgage |
| Less than $50,000 | 0 (0.0%) | 0 (0.0%) |
| $50,000 to $99,999 | 0 (0.0%) | 0 (0.0%) |
| $100,000 to $299,999 | 0 (0.0%) | 15 (38.5%) |
| $300,000 to $499,999 | 0 (0.0%) | 24 (61.5%) |
| $500,000 to $749,999 | 0 (0.0%) | 0 (0.0%) |
| $750,000 to $999,999 | 0 (0.0%) | 0 (0.0%) |
| $1,000,000 or more | 0 (0.0%) | 0 (0.0%) |
| Total | 0 (0.0%) | 39 (100.0%) |
Household Income by Mortgage Status in Fort Bridger
| Household Income | Without Mortgage | With Mortgage |
| Less than $10,000 | 0 (0.0%) | 0 (0.0%) |
| $10,000 to $24,999 | 0 (0.0%) | 0 (0.0%) |
| $25,000 to $34,999 | 0 (0.0%) | 0 (0.0%) |
| $35,000 to $49,999 | 0 (0.0%) | 0 (0.0%) |
| $50,000 to $74,999 | 0 (0.0%) | 0 (0.0%) |
| $75,000 to $99,999 | 0 (0.0%) | 0 (0.0%) |
| $100,000 to $149,999 | 0 (0.0%) | 0 (0.0%) |
| $150,000 or more | 0 (0.0%) | 0 (0.0%) |
| Total | 0 (0.0%) | 39 (100.0%) |
Property Value to Household Income Ratio in Fort Bridger
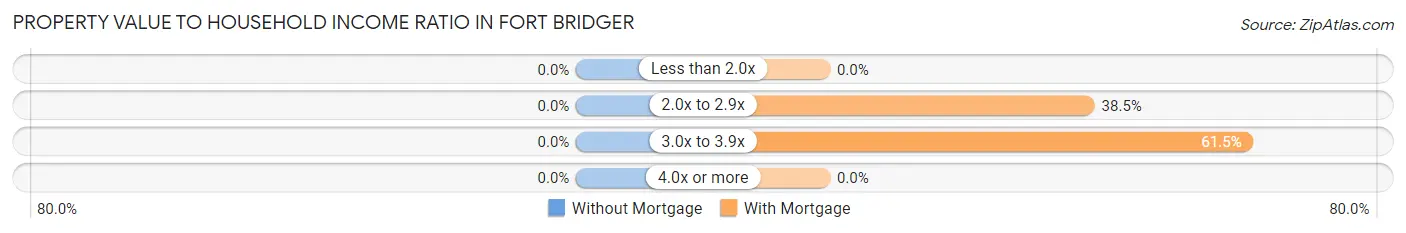
| Value-to-Income Ratio | Without Mortgage | With Mortgage |
| Less than 2.0x | 0 (0.0%) | 0 (0.0%) |
| 2.0x to 2.9x | 0 (0.0%) | 15 (38.5%) |
| 3.0x to 3.9x | 0 (0.0%) | 24 (61.5%) |
| 4.0x or more | 0 (0.0%) | 0 (0.0%) |
| Total | 0 (0.0%) | 39 (100.0%) |
Real Estate Taxes by Mortgage Status in Fort Bridger
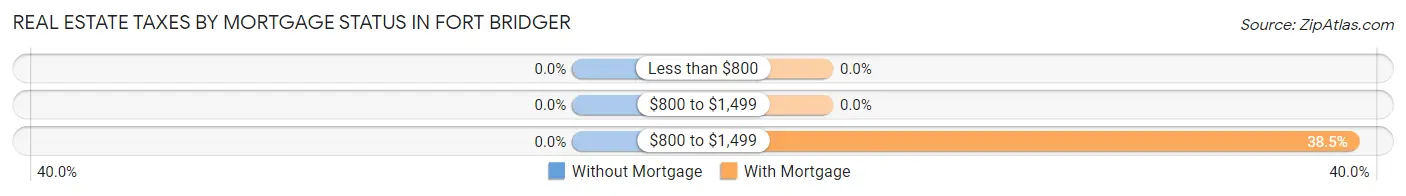
| Property Taxes | Without Mortgage | With Mortgage |
| Less than $800 | 0 (0.0%) | 0 (0.0%) |
| $800 to $1,499 | 0 (0.0%) | 0 (0.0%) |
| $800 to $1,499 | 0 (0.0%) | 15 (38.5%) |
| Total | 0 (0.0%) | 39 (100.0%) |
Health & Disability in Fort Bridger
Health Insurance Coverage by Age in Fort Bridger
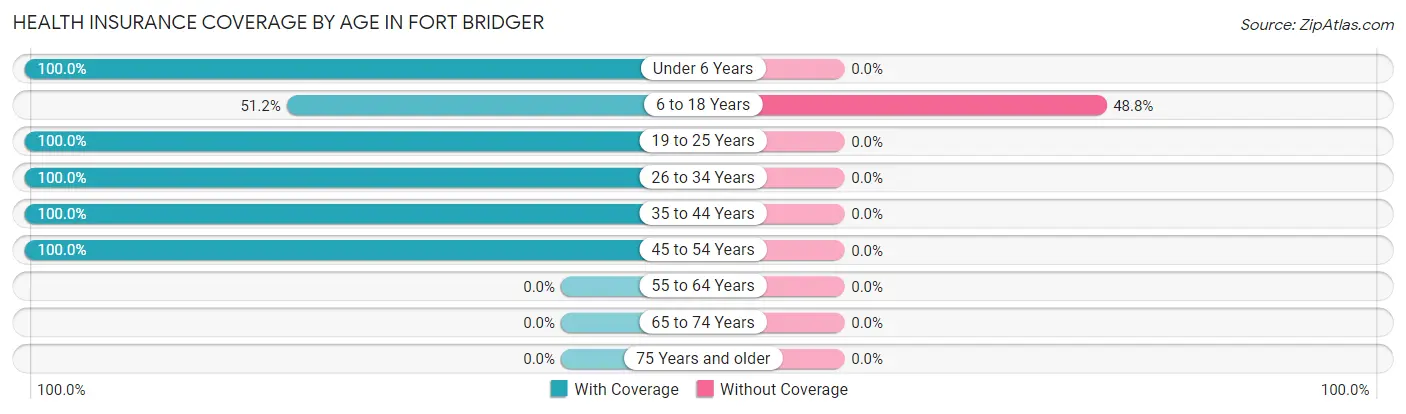
| Age Bracket | With Coverage | Without Coverage |
| Under 6 Years | 11 (100.0%) | 0 (0.0%) |
| 6 to 18 Years | 22 (51.2%) | 21 (48.8%) |
| 19 to 25 Years | 37 (100.0%) | 0 (0.0%) |
| 26 to 34 Years | 36 (100.0%) | 0 (0.0%) |
| 35 to 44 Years | 24 (100.0%) | 0 (0.0%) |
| 45 to 54 Years | 19 (100.0%) | 0 (0.0%) |
| 55 to 64 Years | 0 (0.0%) | 0 (0.0%) |
| 65 to 74 Years | 0 (0.0%) | 0 (0.0%) |
| 75 Years and older | 0 (0.0%) | 0 (0.0%) |
| Total | 149 (87.6%) | 21 (12.3%) |
Health Insurance Coverage by Citizenship Status in Fort Bridger
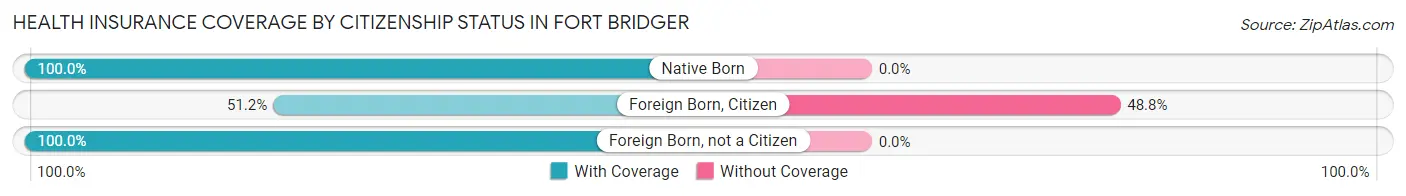
| Citizenship Status | With Coverage | Without Coverage |
| Native Born | 11 (100.0%) | 0 (0.0%) |
| Foreign Born, Citizen | 22 (51.2%) | 21 (48.8%) |
| Foreign Born, not a Citizen | 37 (100.0%) | 0 (0.0%) |
Health Insurance Coverage by Household Income in Fort Bridger
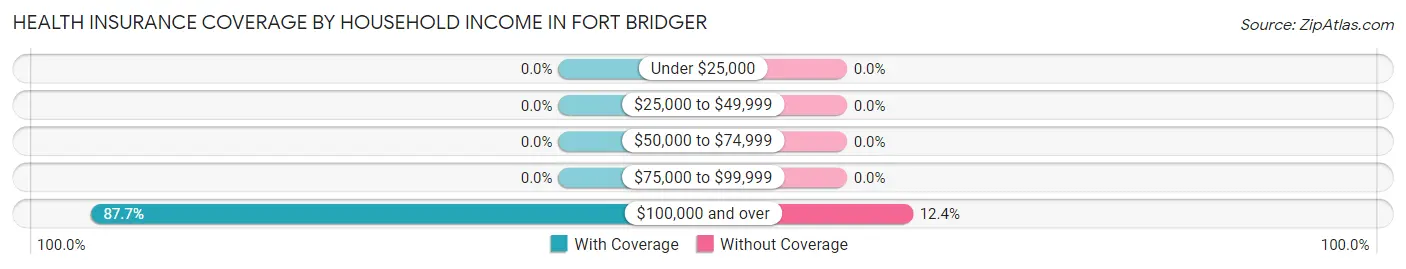
| Household Income | With Coverage | Without Coverage |
| Under $25,000 | 0 (0.0%) | 0 (0.0%) |
| $25,000 to $49,999 | 0 (0.0%) | 0 (0.0%) |
| $50,000 to $74,999 | 0 (0.0%) | 0 (0.0%) |
| $75,000 to $99,999 | 0 (0.0%) | 0 (0.0%) |
| $100,000 and over | 149 (87.6%) | 21 (12.3%) |
Public vs Private Health Insurance Coverage by Age in Fort Bridger
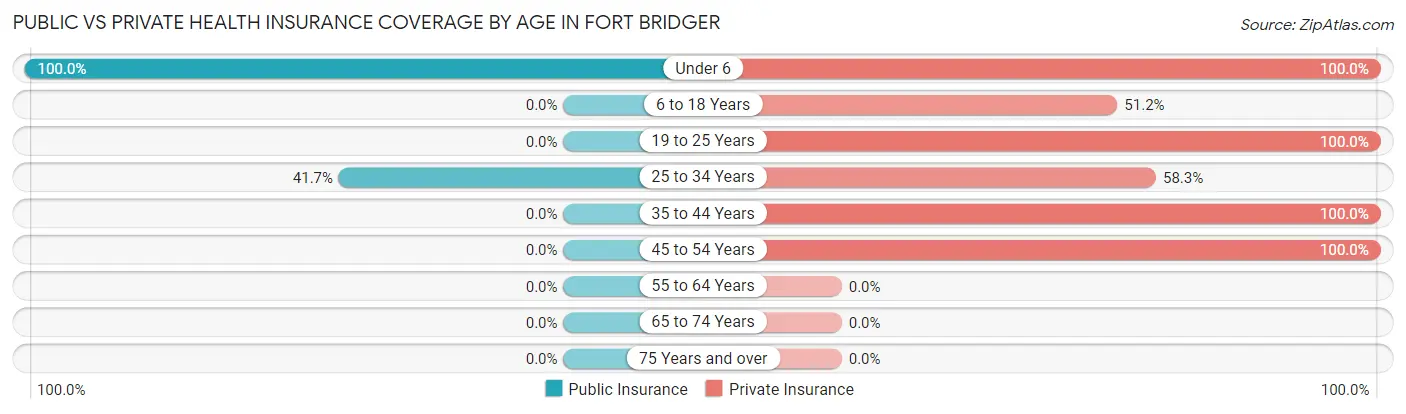
| Age Bracket | Public Insurance | Private Insurance |
| Under 6 | 11 (100.0%) | 11 (100.0%) |
| 6 to 18 Years | 0 (0.0%) | 22 (51.2%) |
| 19 to 25 Years | 0 (0.0%) | 37 (100.0%) |
| 25 to 34 Years | 15 (41.7%) | 21 (58.3%) |
| 35 to 44 Years | 0 (0.0%) | 24 (100.0%) |
| 45 to 54 Years | 0 (0.0%) | 19 (100.0%) |
| 55 to 64 Years | 0 (0.0%) | 0 (0.0%) |
| 65 to 74 Years | 0 (0.0%) | 0 (0.0%) |
| 75 Years and over | 0 (0.0%) | 0 (0.0%) |
| Total | 26 (15.3%) | 134 (78.8%) |
Disability Status by Sex by Age in Fort Bridger
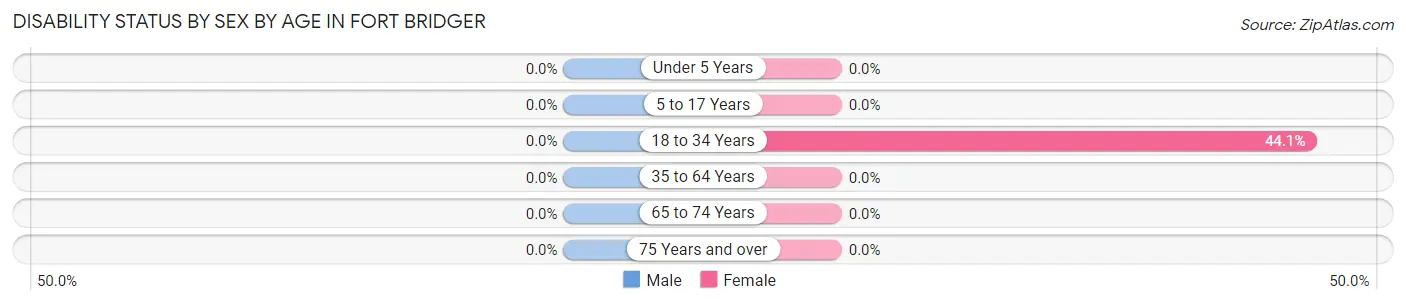
| Age Bracket | Male | Female |
| Under 5 Years | 0 (0.0%) | 0 (0.0%) |
| 5 to 17 Years | 0 (0.0%) | 0 (0.0%) |
| 18 to 34 Years | 0 (0.0%) | 15 (44.1%) |
| 35 to 64 Years | 0 (0.0%) | 0 (0.0%) |
| 65 to 74 Years | 0 (0.0%) | 0 (0.0%) |
| 75 Years and over | 0 (0.0%) | 0 (0.0%) |
Disability Class by Sex by Age in Fort Bridger
Disability Class: Hearing Difficulty
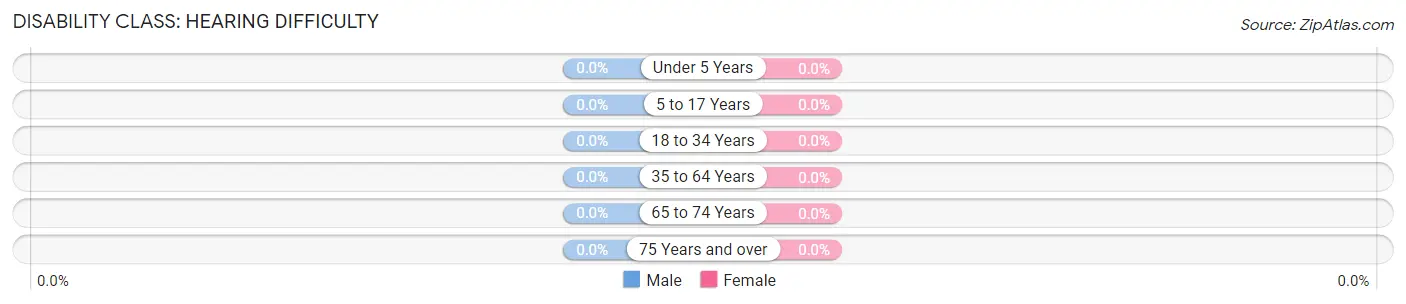
| Age Bracket | Male | Female |
| Under 5 Years | 0 (0.0%) | 0 (0.0%) |
| 5 to 17 Years | 0 (0.0%) | 0 (0.0%) |
| 18 to 34 Years | 0 (0.0%) | 0 (0.0%) |
| 35 to 64 Years | 0 (0.0%) | 0 (0.0%) |
| 65 to 74 Years | 0 (0.0%) | 0 (0.0%) |
| 75 Years and over | 0 (0.0%) | 0 (0.0%) |
Disability Class: Vision Difficulty
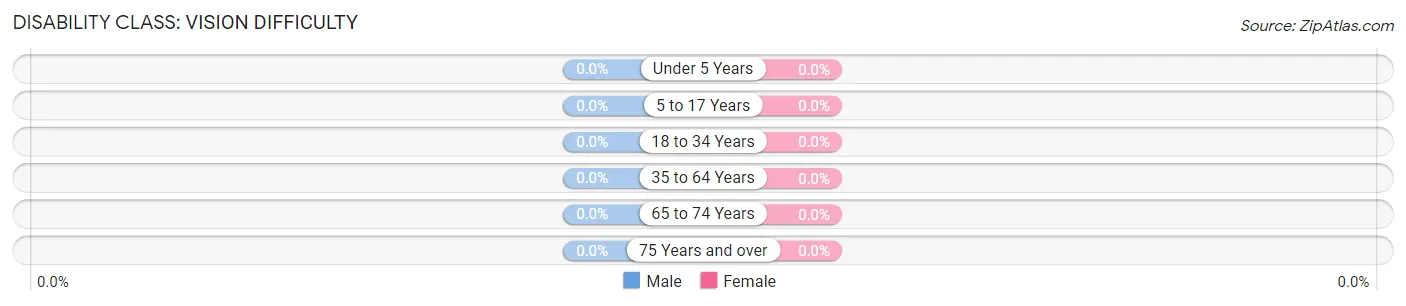
| Age Bracket | Male | Female |
| Under 5 Years | 0 (0.0%) | 0 (0.0%) |
| 5 to 17 Years | 0 (0.0%) | 0 (0.0%) |
| 18 to 34 Years | 0 (0.0%) | 0 (0.0%) |
| 35 to 64 Years | 0 (0.0%) | 0 (0.0%) |
| 65 to 74 Years | 0 (0.0%) | 0 (0.0%) |
| 75 Years and over | 0 (0.0%) | 0 (0.0%) |
Disability Class: Cognitive Difficulty
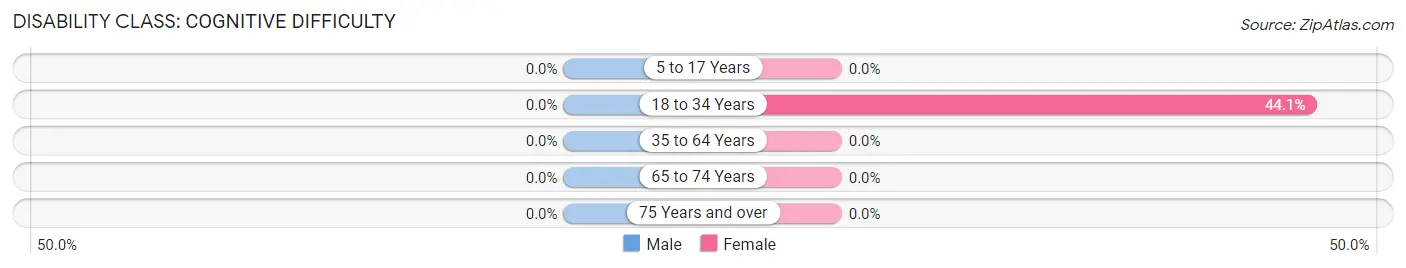
| Age Bracket | Male | Female |
| 5 to 17 Years | 0 (0.0%) | 0 (0.0%) |
| 18 to 34 Years | 0 (0.0%) | 15 (44.1%) |
| 35 to 64 Years | 0 (0.0%) | 0 (0.0%) |
| 65 to 74 Years | 0 (0.0%) | 0 (0.0%) |
| 75 Years and over | 0 (0.0%) | 0 (0.0%) |
Disability Class: Ambulatory Difficulty
| Age Bracket | Male | Female |
| 5 to 17 Years | 0 (0.0%) | 0 (0.0%) |
| 18 to 34 Years | 0 (0.0%) | 0 (0.0%) |
| 35 to 64 Years | 0 (0.0%) | 0 (0.0%) |
| 65 to 74 Years | 0 (0.0%) | 0 (0.0%) |
| 75 Years and over | 0 (0.0%) | 0 (0.0%) |
Disability Class: Self-Care Difficulty
| Age Bracket | Male | Female |
| 5 to 17 Years | 0 (0.0%) | 0 (0.0%) |
| 18 to 34 Years | 0 (0.0%) | 0 (0.0%) |
| 35 to 64 Years | 0 (0.0%) | 0 (0.0%) |
| 65 to 74 Years | 0 (0.0%) | 0 (0.0%) |
| 75 Years and over | 0 (0.0%) | 0 (0.0%) |
Technology Access in Fort Bridger
Computing Device Access in Fort Bridger
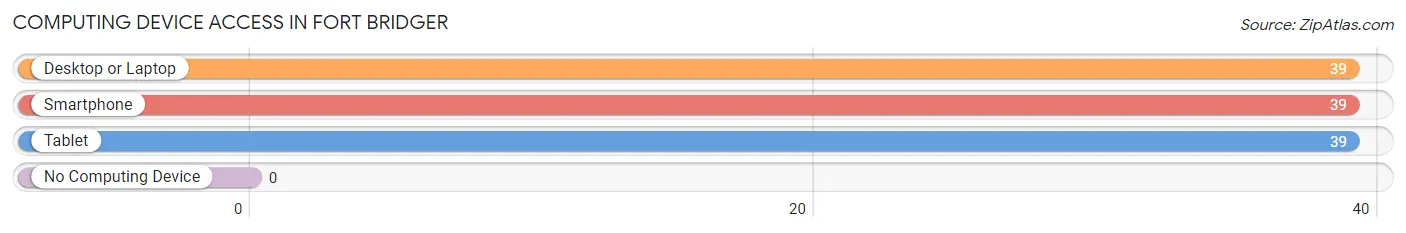
| Device Type | # Households | % Households |
| Desktop or Laptop | 39 | 100.0% |
| Smartphone | 39 | 100.0% |
| Tablet | 39 | 100.0% |
| No Computing Device | 0 | 0.0% |
| Total | 39 | 100.0% |
Internet Access in Fort Bridger
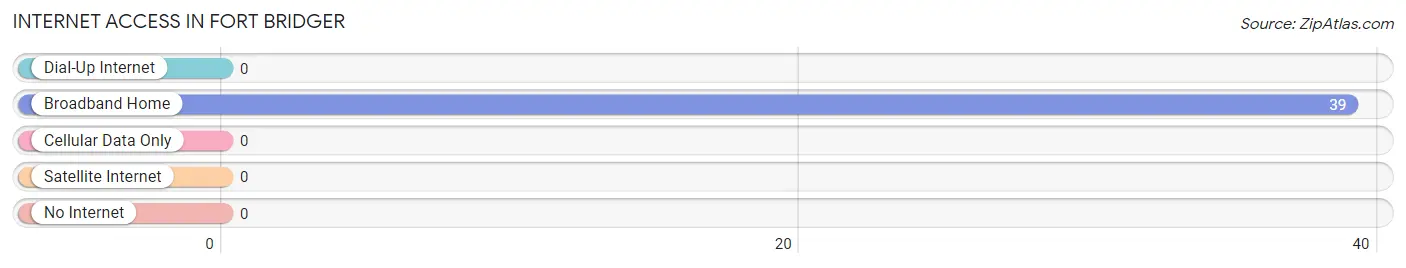
| Internet Type | # Households | % Households |
| Dial-Up Internet | 0 | 0.0% |
| Broadband Home | 39 | 100.0% |
| Cellular Data Only | 0 | 0.0% |
| Satellite Internet | 0 | 0.0% |
| No Internet | 0 | 0.0% |
| Total | 39 | 100.0% |
Fort Bridger Summary
Introduction
Fort Bridger is a small town located in southwestern Wyoming, United States. It is situated in the Uinta County, and is the county seat. The town is named after the historic fort of the same name, which was established in 1842 by the famous mountain man Jim Bridger. The town is located on the banks of the Blacks Fork River, and is surrounded by the Uinta Mountains. The town has a population of around 500 people, and is a popular tourist destination due to its rich history and scenic beauty.
History
Fort Bridger was established in 1842 by the famous mountain man Jim Bridger. The fort was originally built as a trading post for fur trappers and Native Americans. It was also used as a supply station for travelers on the Oregon Trail. In 1847, the fort was taken over by the United States Army and was used as a military post until 1890. During this time, the fort was used to protect settlers from Native American attacks.
In 1868, the fort was sold to Mormon settlers, who established a small town around the fort. The town was incorporated in 1872, and was named after the fort. The town grew slowly, and by the early 1900s, it had a population of around 500 people.
Geography
Fort Bridger is located in southwestern Wyoming, in the Uinta County. It is situated on the banks of the Blacks Fork River, and is surrounded by the Uinta Mountains. The town is located at an elevation of 6,400 feet, and has a total area of 0.9 square miles. The climate of the town is semi-arid, with hot summers and cold winters.
Economy
The economy of Fort Bridger is mainly based on tourism. The town is a popular tourist destination due to its rich history and scenic beauty. The town is also home to several small businesses, including restaurants, hotels, and retail stores. The town also has a small manufacturing sector, which produces a variety of products, including furniture and clothing.
Demographics
As of the 2010 census, the population of Fort Bridger was 498 people. The racial makeup of the town was 95.2% White, 0.2% African American, 0.4% Native American, 0.2% Asian, 0.2% Pacific Islander, and 3.8% from other races. The median household income was $37,500, and the median family income was $41,250. The per capita income was $17,845.
Conclusion
Fort Bridger is a small town located in southwestern Wyoming, United States. It is situated in the Uinta County, and is the county seat. The town is named after the historic fort of the same name, which was established in 1842 by the famous mountain man Jim Bridger. The town has a population of around 500 people, and is a popular tourist destination due to its rich history and scenic beauty. The economy of the town is mainly based on tourism, and the town is also home to several small businesses. The racial makeup of the town is mainly White, with a small percentage of African American, Native American, Asian, and Pacific Islander residents.
Common Questions
What is Per Capita Income in Fort Bridger?
Per Capita income in Fort Bridger is $40,138.
What is Inequality or Gini Index in Fort Bridger?
Inequality or Gini Index in Fort Bridger is 0.02.
What is the Total Population of Fort Bridger?
Total Population of Fort Bridger is 170.
What is the Total Male Population of Fort Bridger?
Total Male Population of Fort Bridger is 112.
What is the Total Female Population of Fort Bridger?
Total Female Population of Fort Bridger is 58.
What is the Ratio of Males per 100 Females in Fort Bridger?
There are 193.10 Males per 100 Females in Fort Bridger.
What is the Ratio of Females per 100 Males in Fort Bridger?
There are 51.79 Females per 100 Males in Fort Bridger.
What is the Median Population Age in Fort Bridger?
Median Population Age in Fort Bridger is 23.8 Years.
What is the Average Family Size in Fort Bridger
Average Family Size in Fort Bridger is 3.8 People.
What is the Average Household Size in Fort Bridger
Average Household Size in Fort Bridger is 4.4 People.
How Large is the Labor Force in Fort Bridger?
There are 119 People in the Labor Forcein in Fort Bridger.
What is the Percentage of People in the Labor Force in Fort Bridger?
86.2% of People are in the Labor Force in Fort Bridger.