Zip Codes with the Highest Percentage of Population Employed in Installation, Maintenance & Repair in Woodbridge, VA
RELATED REPORTS & OPTIONS
Installation, Maintenance & Repair
Woodbridge
Compare Zip Codes
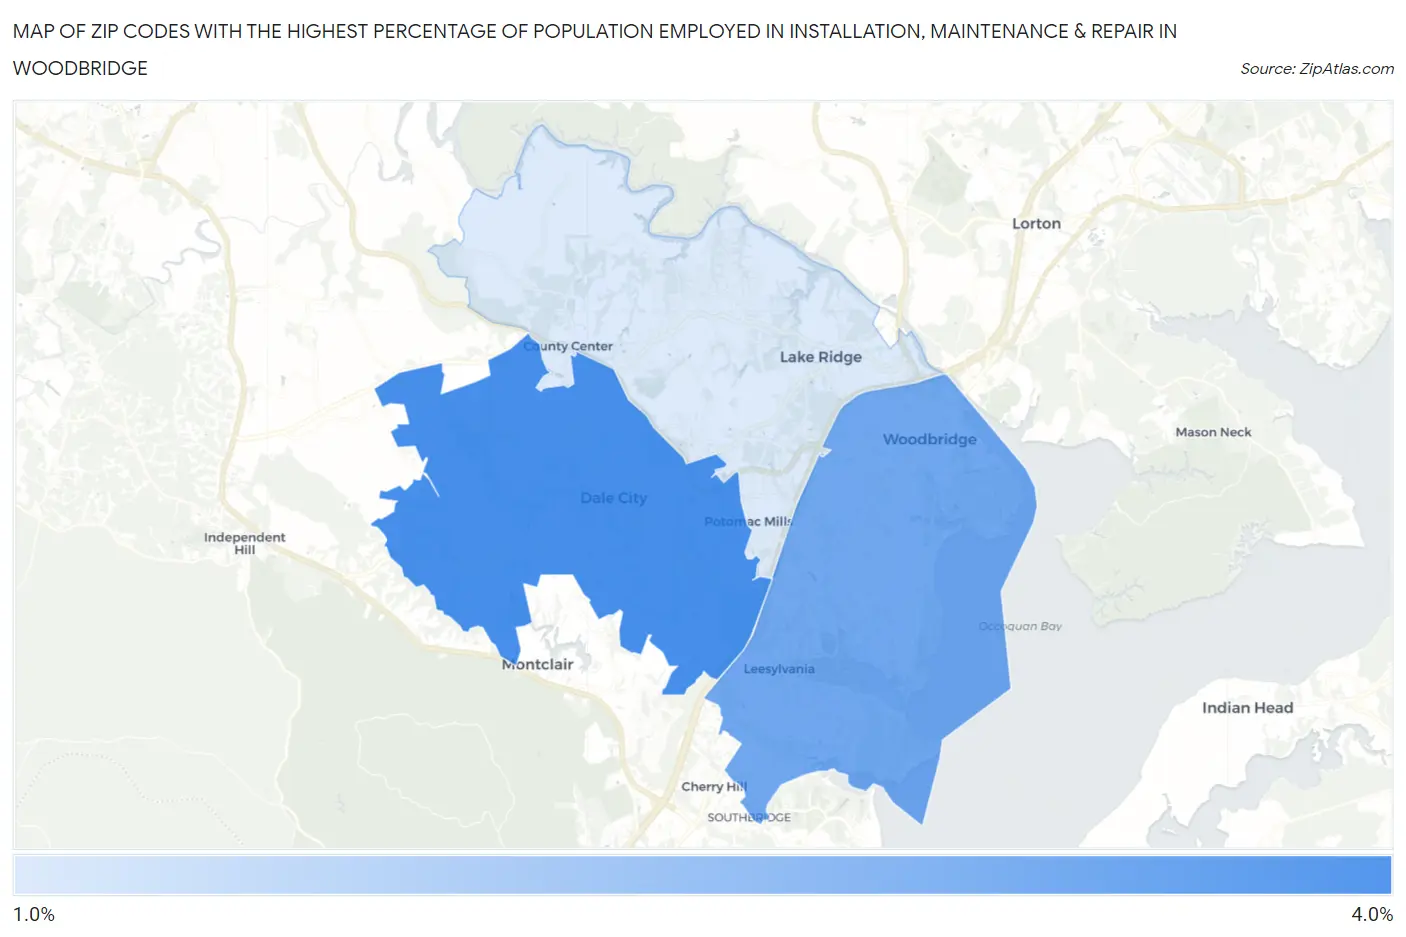
Map of Zip Codes with the Highest Percentage of Population Employed in Installation, Maintenance & Repair in Woodbridge
1.8%
3.8%
Zip Codes with the Highest Percentage of Population Employed in Installation, Maintenance & Repair in Woodbridge, VA
| Zip Code | % Employed | vs State | vs National | |
| 1. | 22193 | 3.8% | 2.9%(+0.869)#332 | 3.1%(+0.703)#13,377 |
| 2. | 22191 | 3.2% | 2.9%(+0.314)#390 | 3.1%(+0.148)#15,952 |
| 3. | 22192 | 1.8% | 2.9%(-1.13)#567 | 3.1%(-1.29)#23,001 |
1
Common Questions
What are the Top Zip Codes with the Highest Percentage of Population Employed in Installation, Maintenance & Repair in Woodbridge, VA?
Top Zip Codes with the Highest Percentage of Population Employed in Installation, Maintenance & Repair in Woodbridge, VA are:
What zip code has the Highest Percentage of Population Employed in Installation, Maintenance & Repair in Woodbridge, VA?
22193 has the Highest Percentage of Population Employed in Installation, Maintenance & Repair in Woodbridge, VA with 3.8%.
What is the Percentage of Population Employed in Installation, Maintenance & Repair in Woodbridge, VA?
Percentage of Population Employed in Installation, Maintenance & Repair in Woodbridge is 4.2%.
What is the Percentage of Population Employed in Installation, Maintenance & Repair in Virginia?
Percentage of Population Employed in Installation, Maintenance & Repair in Virginia is 2.9%.
What is the Percentage of Population Employed in Installation, Maintenance & Repair in the United States?
Percentage of Population Employed in Installation, Maintenance & Repair in the United States is 3.1%.