Zip Codes with the Highest Costs of Housing as Percentage of Income in Floral Park, NY
RELATED REPORTS & OPTIONS
Highest Housing Costs / Income
Floral Park
Compare Zip Codes
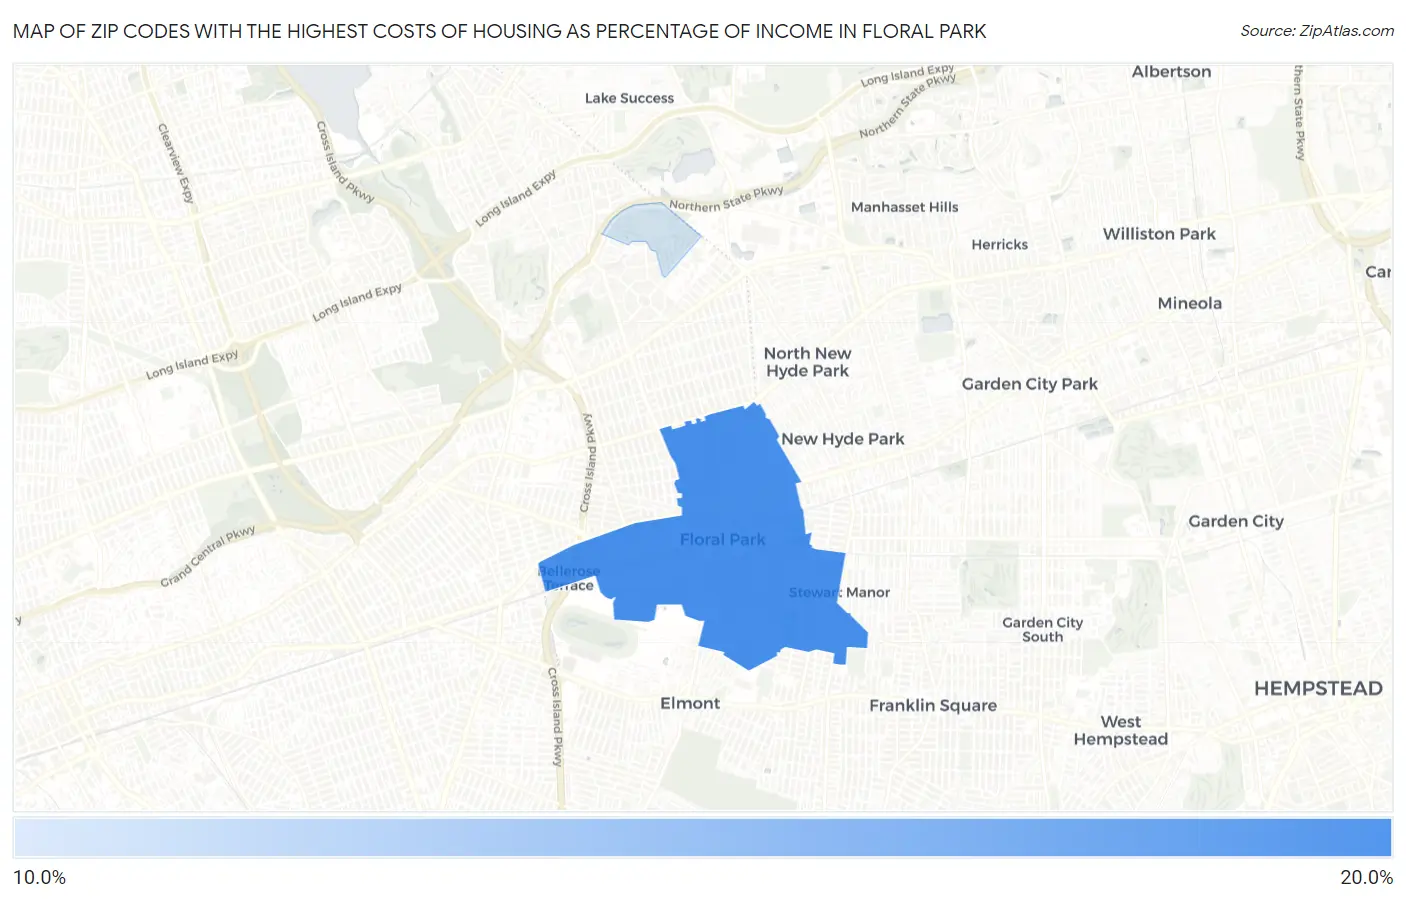
Map of Zip Codes with the Highest Costs of Housing as Percentage of Income in Floral Park
19.1%
19.7%
Zip Codes with the Highest Costs of Housing as Percentage of Income in Floral Park, NY
| Zip Code | Housing Costs / Income | vs State | vs National | |
| 1. | 11001 | 19.7% | 23.0%(-3.28)#706 | 20.4%(-0.698)#9,396 |
| 2. | 11005 | 19.1% | 23.0%(-3.83)#771 | 20.4%(-1.25)#10,560 |
1
Common Questions
What are the Top Zip Codes with the Highest Costs of Housing as Percentage of Income in Floral Park, NY?
Top Zip Codes with the Highest Costs of Housing as Percentage of Income in Floral Park, NY are:
What zip code has the Highest Costs of Housing as Percentage of Income in Floral Park, NY?
11001 has the Highest Costs of Housing as Percentage of Income in Floral Park, NY with 19.7%.
What is the Average Housing Costs as Percentage of Income in Floral Park, NY?
Average Housing Costs as Percentage of Income in Floral Park is 17.7%.
What is the Average Housing Costs as Percentage of Income in New York?
Average Housing Costs as Percentage of Income in New York is 23.0%.
What is the Average Housing Costs as Percentage of Income in the United States?
Average Housing Costs as Percentage of Income in the United States is 20.4%.