Nelchina, AK Map & Demographics
Nelchina Map
Nelchina Overview
$45,579
PER CAPITA INCOME
0.04
INEQUALITY / GINI INDEX
135
TOTAL POPULATION
68
MALE POPULATION
67
FEMALE POPULATION
101.49
MALES / 100 FEMALES
98.53
FEMALES / 100 MALES
39.6
MEDIAN AGE
3.4
AVG FAMILY SIZE
3.4
AVG HOUSEHOLD SIZE
46
LABOR FORCE [ PEOPLE ]
50.5%
PERCENT IN LABOR FORCE
Income in Nelchina
Income Overview in Nelchina
| Characteristic | Number | Measure |
| Per Capita Income | 135 | $45,579 |
| Median Family Income | 40 | $0 |
| Mean Family Income | 40 | $0 |
| Median Household Income | 40 | $0 |
| Mean Household Income | 40 | $0 |
| Income Deficit | 40 | $0 |
| Wage / Income Gap (%) | 135 | 0.00% |
| Wage / Income Gap ($) | 135 | 100.00¢ per $1 |
| Gini / Inequality Index | 135 | 0.04 |
Earnings by Sex in Nelchina
| Sex | Number | Average Earnings |
| Male | 40 (87.0%) | $0 |
| Female | 6 (13.0%) | $0 |
| Total | 46 (100.0%) | $0 |
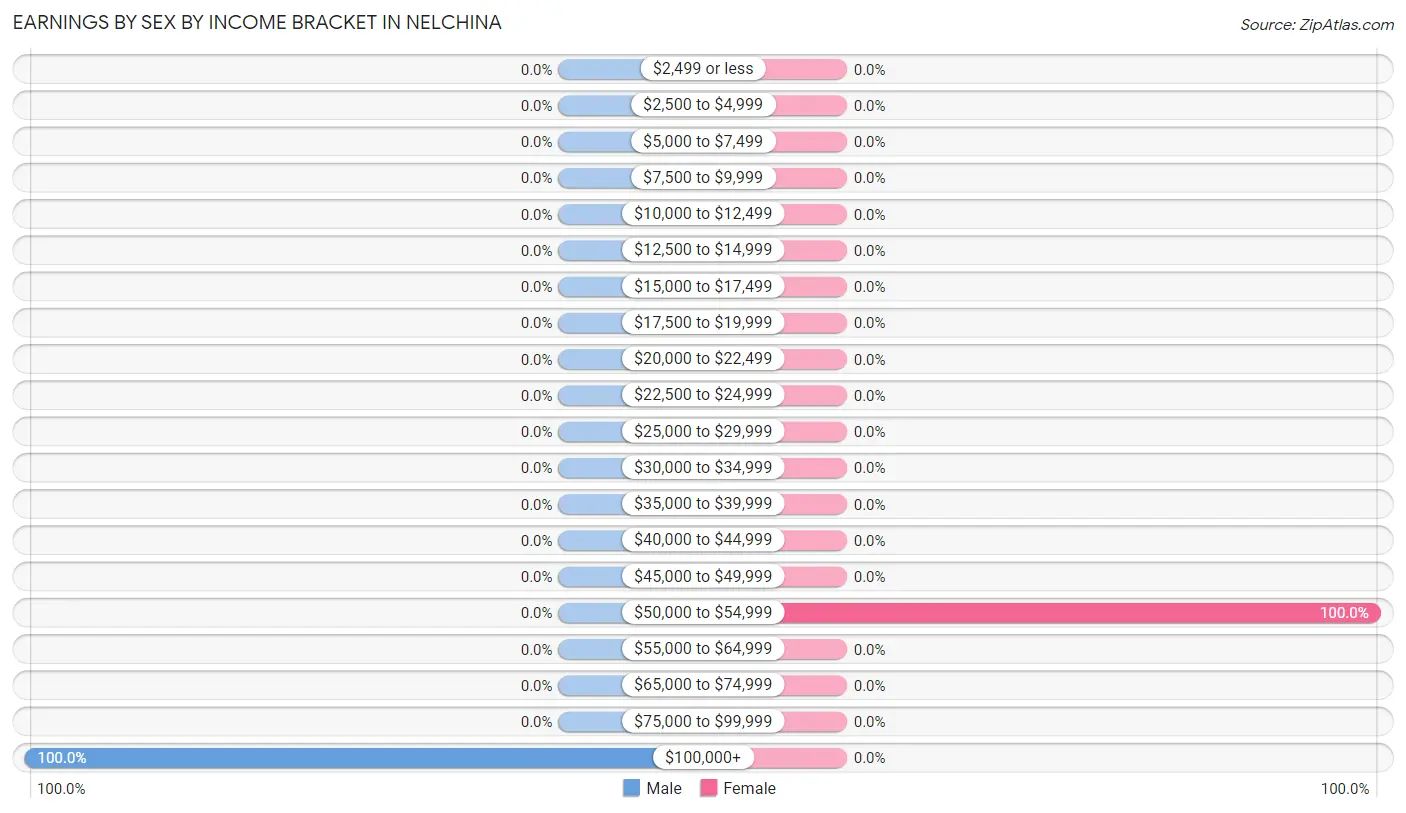
Earnings by Sex by Income Bracket in Nelchina
The most common earnings brackets in Nelchina are $100,000+ for men (40 | 100.0%) and $50,000 to $54,999 for women (6 | 100.0%).
| Income | Male | Female |
| $2,499 or less | 0 (0.0%) | 0 (0.0%) |
| $2,500 to $4,999 | 0 (0.0%) | 0 (0.0%) |
| $5,000 to $7,499 | 0 (0.0%) | 0 (0.0%) |
| $7,500 to $9,999 | 0 (0.0%) | 0 (0.0%) |
| $10,000 to $12,499 | 0 (0.0%) | 0 (0.0%) |
| $12,500 to $14,999 | 0 (0.0%) | 0 (0.0%) |
| $15,000 to $17,499 | 0 (0.0%) | 0 (0.0%) |
| $17,500 to $19,999 | 0 (0.0%) | 0 (0.0%) |
| $20,000 to $22,499 | 0 (0.0%) | 0 (0.0%) |
| $22,500 to $24,999 | 0 (0.0%) | 0 (0.0%) |
| $25,000 to $29,999 | 0 (0.0%) | 0 (0.0%) |
| $30,000 to $34,999 | 0 (0.0%) | 0 (0.0%) |
| $35,000 to $39,999 | 0 (0.0%) | 0 (0.0%) |
| $40,000 to $44,999 | 0 (0.0%) | 0 (0.0%) |
| $45,000 to $49,999 | 0 (0.0%) | 0 (0.0%) |
| $50,000 to $54,999 | 0 (0.0%) | 6 (100.0%) |
| $55,000 to $64,999 | 0 (0.0%) | 0 (0.0%) |
| $65,000 to $74,999 | 0 (0.0%) | 0 (0.0%) |
| $75,000 to $99,999 | 0 (0.0%) | 0 (0.0%) |
| $100,000+ | 40 (100.0%) | 0 (0.0%) |
| Total | 40 (100.0%) | 6 (100.0%) |
Earnings by Sex by Educational Attainment in Nelchina
| Educational Attainment | Male Income | Female Income |
| Less than High School | - | - |
| High School Diploma | - | - |
| College or Associate's Degree | - | - |
| Bachelor's Degree | - | - |
| Graduate Degree | - | - |
| Total | - | - |
Family Income in Nelchina
Family Income Brackets in Nelchina
According to the Nelchina family income data, there are 34 families falling into the $100,000 to $149,999 income range, which is the most common income bracket and makes up 85.0% of all families.
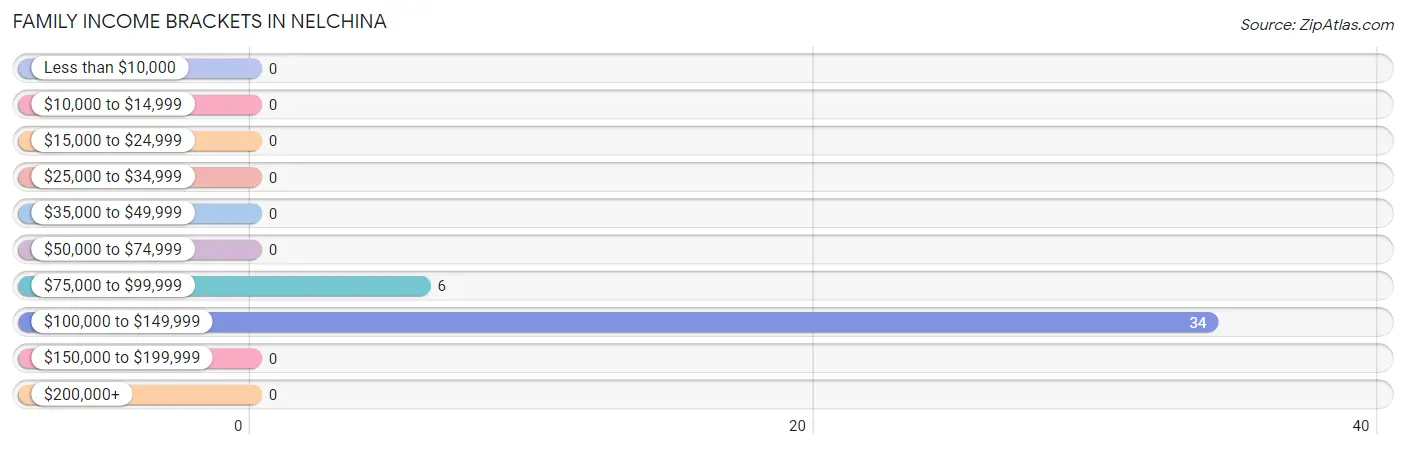
| Income Bracket | # Families | % Families |
| Less than $10,000 | 0 | 0.0% |
| $10,000 to $14,999 | 0 | 0.0% |
| $15,000 to $24,999 | 0 | 0.0% |
| $25,000 to $34,999 | 0 | 0.0% |
| $35,000 to $49,999 | 0 | 0.0% |
| $50,000 to $74,999 | 0 | 0.0% |
| $75,000 to $99,999 | 6 | 15.0% |
| $100,000 to $149,999 | 34 | 85.0% |
| $150,000 to $199,999 | 0 | 0.0% |
| $200,000+ | 0 | 0.0% |
Family Income by Famaliy Size in Nelchina
| Income Bracket | # Families | Median Income |
| 2-Person Families | 6 (15.0%) | $0 |
| 3-Person Families | 0 (0.0%) | $0 |
| 4-Person Families | 34 (85.0%) | $0 |
| 5-Person Families | 0 (0.0%) | $0 |
| 6-Person Families | 0 (0.0%) | $0 |
| 7+ Person Families | 0 (0.0%) | $0 |
| Total | 40 (100.0%) | $0 |
Family Income by Number of Earners in Nelchina
| Number of Earners | # Families | Median Income |
| No Earners | 0 (0.0%) | $0 |
| 1 Earner | 40 (100.0%) | $0 |
| 2 Earners | 0 (0.0%) | $0 |
| 3+ Earners | 0 (0.0%) | $0 |
| Total | 40 (100.0%) | $0 |
Household Income in Nelchina
Household Income Brackets in Nelchina
With 34 households falling in the category, the $100,000 to $149,999 income range is the most frequent in Nelchina, accounting for 85.0% of all households.
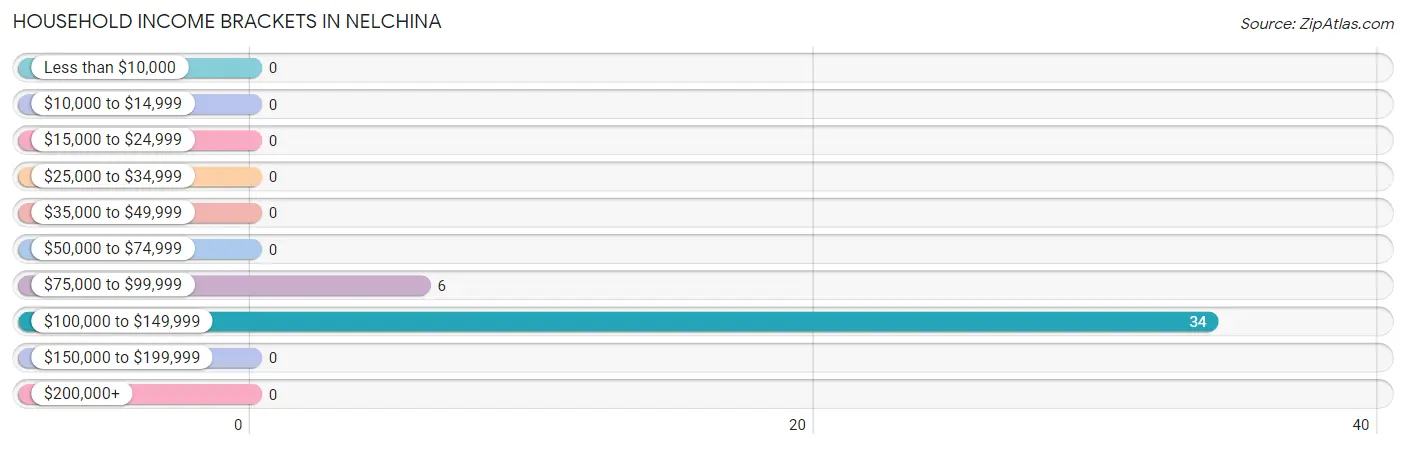
| Income Bracket | # Households | % Households |
| Less than $10,000 | 0 | 0.0% |
| $10,000 to $14,999 | 0 | 0.0% |
| $15,000 to $24,999 | 0 | 0.0% |
| $25,000 to $34,999 | 0 | 0.0% |
| $35,000 to $49,999 | 0 | 0.0% |
| $50,000 to $74,999 | 0 | 0.0% |
| $75,000 to $99,999 | 6 | 15.0% |
| $100,000 to $149,999 | 34 | 85.0% |
| $150,000 to $199,999 | 0 | 0.0% |
| $200,000+ | 0 | 0.0% |
Household Income by Householder Age in Nelchina
| Income Bracket | # Households | Median Income |
| 15 to 24 Years | 0 (0.0%) | $0 |
| 25 to 44 Years | 0 (0.0%) | $0 |
| 45 to 64 Years | 40 (100.0%) | $0 |
| 65+ Years | 0 (0.0%) | $0 |
| Total | 40 (100.0%) | $0 |
Poverty in Nelchina
Income Below Poverty by Sex and Age in Nelchina
| Age Bracket | Male | Female |
| Under 5 Years | 0 (0.0%) | 0 (0.0%) |
| 5 Years | 0 (0.0%) | 0 (0.0%) |
| 6 to 11 Years | 0 (0.0%) | 0 (0.0%) |
| 12 to 14 Years | 0 (0.0%) | 0 (0.0%) |
| 15 Years | 0 (0.0%) | 0 (0.0%) |
| 16 and 17 Years | 0 (0.0%) | 0 (0.0%) |
| 18 to 24 Years | 0 (0.0%) | 0 (0.0%) |
| 25 to 34 Years | 0 (0.0%) | 0 (0.0%) |
| 35 to 44 Years | 0 (0.0%) | 0 (0.0%) |
| 45 to 54 Years | 0 (0.0%) | 0 (0.0%) |
| 55 to 64 Years | 0 (0.0%) | 0 (0.0%) |
| 65 to 74 Years | 0 (0.0%) | 0 (0.0%) |
| 75 Years and over | 0 (0.0%) | 0 (0.0%) |
| Total | 0 (0.0%) | 0 (0.0%) |
Income Above Poverty by Sex and Age in Nelchina
According to the poverty statistics in Nelchina, males aged 15 years and females aged 12 to 14 years are the age groups that are most secure financially, with 100.0% of males and 100.0% of females in these age groups living above the poverty line.
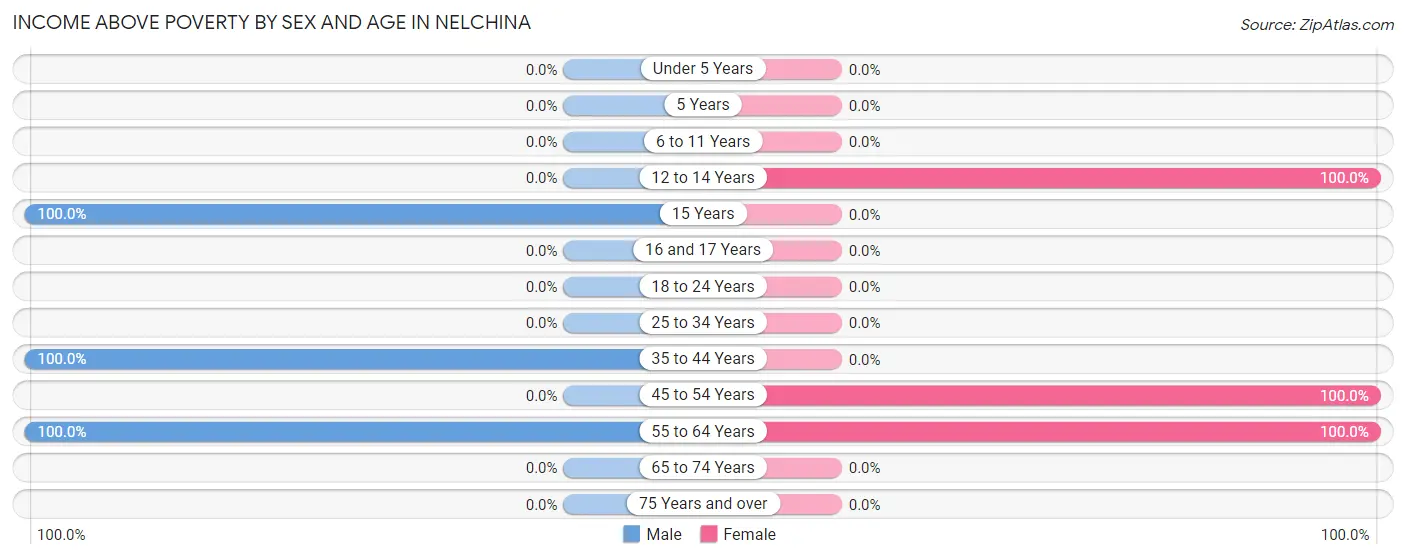
| Age Bracket | Male | Female |
| Under 5 Years | 0 (0.0%) | 0 (0.0%) |
| 5 Years | 0 (0.0%) | 0 (0.0%) |
| 6 to 11 Years | 0 (0.0%) | 0 (0.0%) |
| 12 to 14 Years | 0 (0.0%) | 27 (100.0%) |
| 15 Years | 17 (100.0%) | 0 (0.0%) |
| 16 and 17 Years | 0 (0.0%) | 0 (0.0%) |
| 18 to 24 Years | 0 (0.0%) | 0 (0.0%) |
| 25 to 34 Years | 0 (0.0%) | 0 (0.0%) |
| 35 to 44 Years | 40 (100.0%) | 0 (0.0%) |
| 45 to 54 Years | 0 (0.0%) | 34 (100.0%) |
| 55 to 64 Years | 11 (100.0%) | 6 (100.0%) |
| 65 to 74 Years | 0 (0.0%) | 0 (0.0%) |
| 75 Years and over | 0 (0.0%) | 0 (0.0%) |
| Total | 68 (100.0%) | 67 (100.0%) |
Income Below Poverty Among Married-Couple Families in Nelchina
| Children | Above Poverty | Below Poverty |
| No Children | 6 (100.0%) | 0 (0.0%) |
| 1 or 2 Children | 34 (100.0%) | 0 (0.0%) |
| 3 or 4 Children | 0 (0.0%) | 0 (0.0%) |
| 5 or more Children | 0 (0.0%) | 0 (0.0%) |
| Total | 40 (100.0%) | 0 (0.0%) |
Income Below Poverty Among Single-Parent Households in Nelchina
| Children | Single Father | Single Mother |
| No Children | 0 (0.0%) | 0 (0.0%) |
| 1 or 2 Children | 0 (0.0%) | 0 (0.0%) |
| 3 or 4 Children | 0 (0.0%) | 0 (0.0%) |
| 5 or more Children | 0 (0.0%) | 0 (0.0%) |
| Total | 0 (0.0%) | 0 (0.0%) |
Income Below Poverty Among Married-Couple vs Single-Parent Households in Nelchina
| Children | Married-Couple Families | Single-Parent Households |
| No Children | 0 (0.0%) | 0 (0.0%) |
| 1 or 2 Children | 0 (0.0%) | 0 (0.0%) |
| 3 or 4 Children | 0 (0.0%) | 0 (0.0%) |
| 5 or more Children | 0 (0.0%) | 0 (0.0%) |
| Total | 0 (0.0%) | 0 (0.0%) |
Race in Nelchina
The most populous races in Nelchina are Hispanic or Latino (84 | 62.2%), Two or more Races (84 | 62.2%), and White / Caucasian (45 | 33.3%).
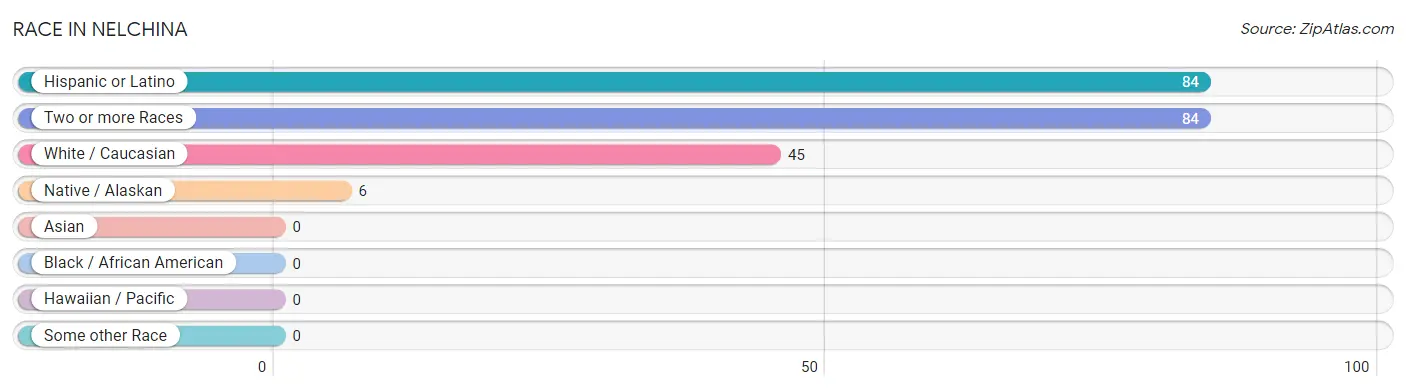
| Race | # Population | % Population |
| Asian | 0 | 0.0% |
| Black / African American | 0 | 0.0% |
| Hawaiian / Pacific | 0 | 0.0% |
| Hispanic or Latino | 84 | 62.2% |
| Native / Alaskan | 6 | 4.4% |
| White / Caucasian | 45 | 33.3% |
| Two or more Races | 84 | 62.2% |
| Some other Race | 0 | 0.0% |
| Total | 135 | 100.0% |
Ancestry in Nelchina
The most populous ancestries reported in Nelchina are Mexican (84 | 62.2%), Czech (78 | 57.8%), and Alaskan Athabascan (6 | 4.4%), together accounting for 124.4% of all Nelchina residents.
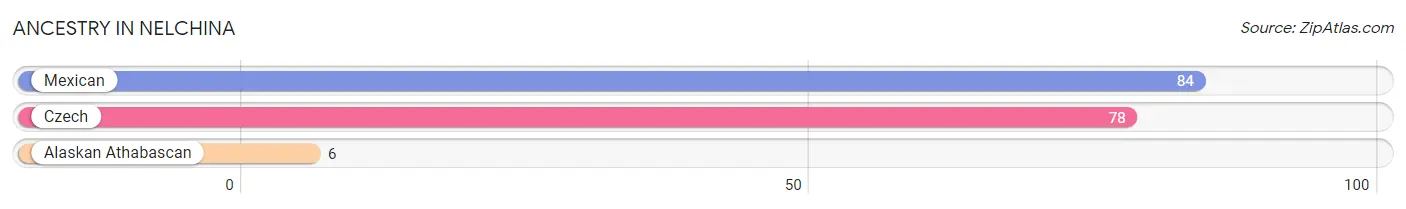
| Ancestry | # Population | % Population |
| Alaskan Athabascan | 6 | 4.4% |
| Czech | 78 | 57.8% |
| Mexican | 84 | 62.2% | View All 3 Rows |
Immigrants in Nelchina

| Immigration Origin | # Population | % Population | View All 0 Rows |
Sex and Age in Nelchina
Sex and Age in Nelchina
The most populous age groups in Nelchina are 35 to 39 Years (40 | 58.8%) for men and 45 to 49 Years (34 | 50.7%) for women.
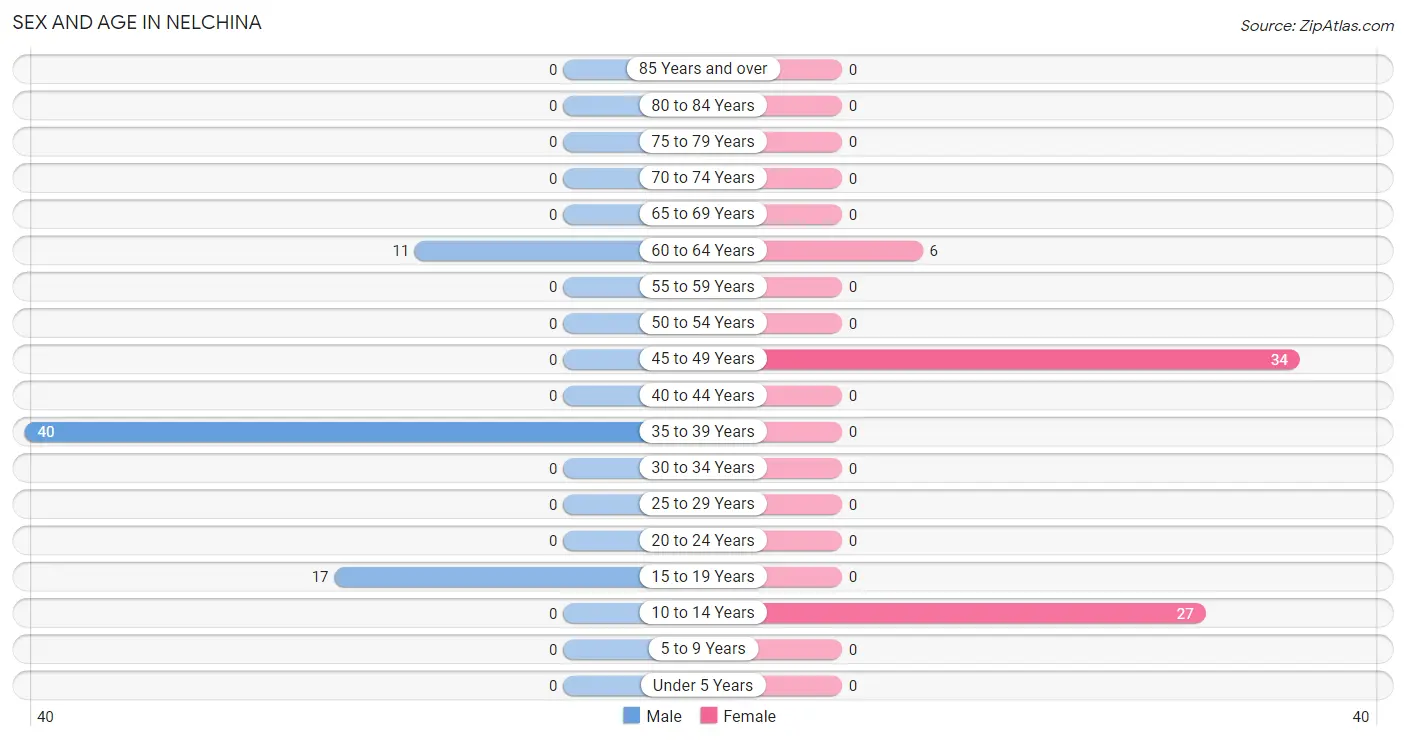
| Age Bracket | Male | Female |
| Under 5 Years | 0 (0.0%) | 0 (0.0%) |
| 5 to 9 Years | 0 (0.0%) | 0 (0.0%) |
| 10 to 14 Years | 0 (0.0%) | 27 (40.3%) |
| 15 to 19 Years | 17 (25.0%) | 0 (0.0%) |
| 20 to 24 Years | 0 (0.0%) | 0 (0.0%) |
| 25 to 29 Years | 0 (0.0%) | 0 (0.0%) |
| 30 to 34 Years | 0 (0.0%) | 0 (0.0%) |
| 35 to 39 Years | 40 (58.8%) | 0 (0.0%) |
| 40 to 44 Years | 0 (0.0%) | 0 (0.0%) |
| 45 to 49 Years | 0 (0.0%) | 34 (50.7%) |
| 50 to 54 Years | 0 (0.0%) | 0 (0.0%) |
| 55 to 59 Years | 0 (0.0%) | 0 (0.0%) |
| 60 to 64 Years | 11 (16.2%) | 6 (9.0%) |
| 65 to 69 Years | 0 (0.0%) | 0 (0.0%) |
| 70 to 74 Years | 0 (0.0%) | 0 (0.0%) |
| 75 to 79 Years | 0 (0.0%) | 0 (0.0%) |
| 80 to 84 Years | 0 (0.0%) | 0 (0.0%) |
| 85 Years and over | 0 (0.0%) | 0 (0.0%) |
| Total | 68 (100.0%) | 67 (100.0%) |
Families and Households in Nelchina
Median Family Size in Nelchina
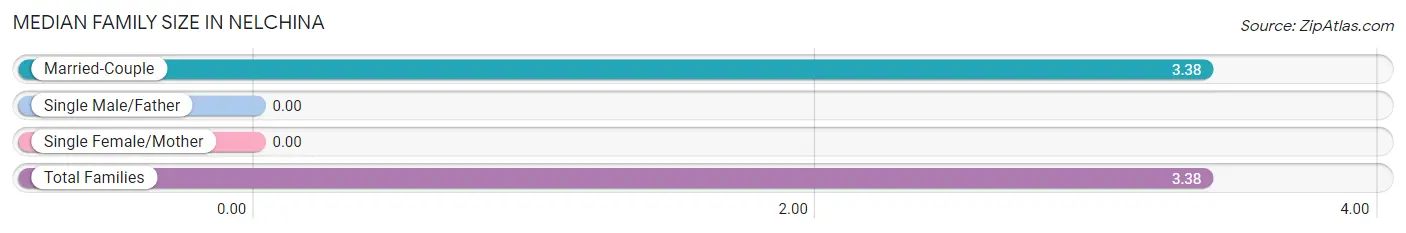
| Family Type | # Families | Family Size |
| Married-Couple | 40 (100.0%) | 3.38 |
| Single Male/Father | 0 (0.0%) | - |
| Single Female/Mother | 0 (0.0%) | - |
| Total Families | 40 (100.0%) | 3.38 |
Median Household Size in Nelchina
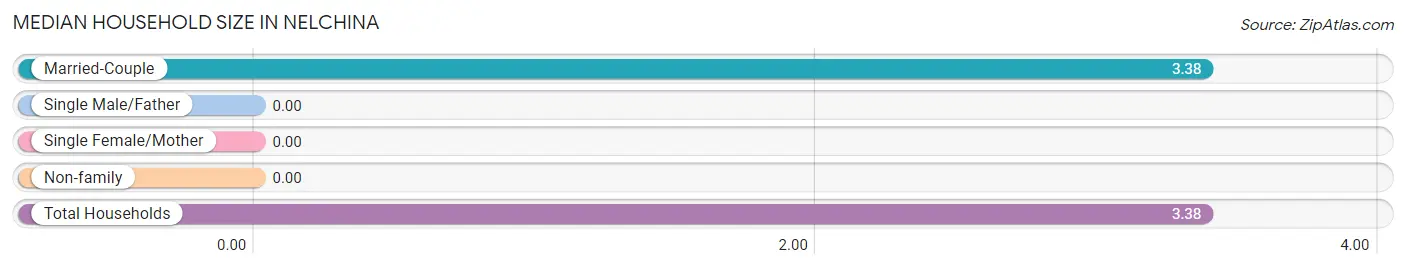
| Household Type | # Households | Household Size |
| Married-Couple | 40 (100.0%) | 3.38 |
| Single Male/Father | 0 (0.0%) | - |
| Single Female/Mother | 0 (0.0%) | - |
| Non-family | 0 (0.0%) | - |
| Total Households | 40 (100.0%) | 3.38 |
Household Size by Marriage Status in Nelchina
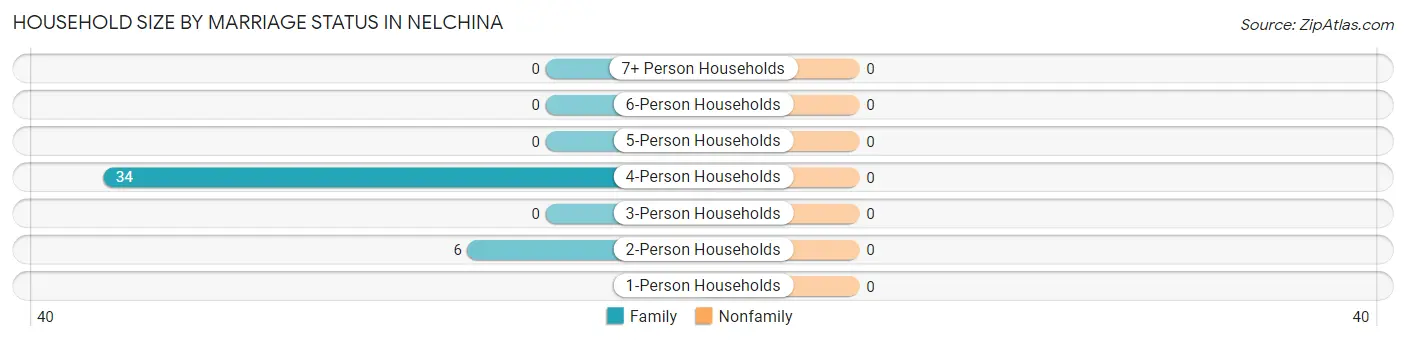
| Household Size | Family Households | Nonfamily Households |
| 1-Person Households | - | 0 (0.0%) |
| 2-Person Households | 6 (15.0%) | 0 (0.0%) |
| 3-Person Households | 0 (0.0%) | 0 (0.0%) |
| 4-Person Households | 34 (85.0%) | 0 (0.0%) |
| 5-Person Households | 0 (0.0%) | 0 (0.0%) |
| 6-Person Households | 0 (0.0%) | 0 (0.0%) |
| 7+ Person Households | 0 (0.0%) | 0 (0.0%) |
| Total | 40 (100.0%) | 0 (0.0%) |
Female Fertility in Nelchina
Fertility by Age in Nelchina
Average fertility rate in Nelchina is 1,000.0 births per 1,000 women. Women in the age bracket of 35 to 50 years have the highest fertility rate with 1,000.0 births per 1,000 women. Women in the age bracket of 35 to 50 years acount for 100.0% of all women with births.
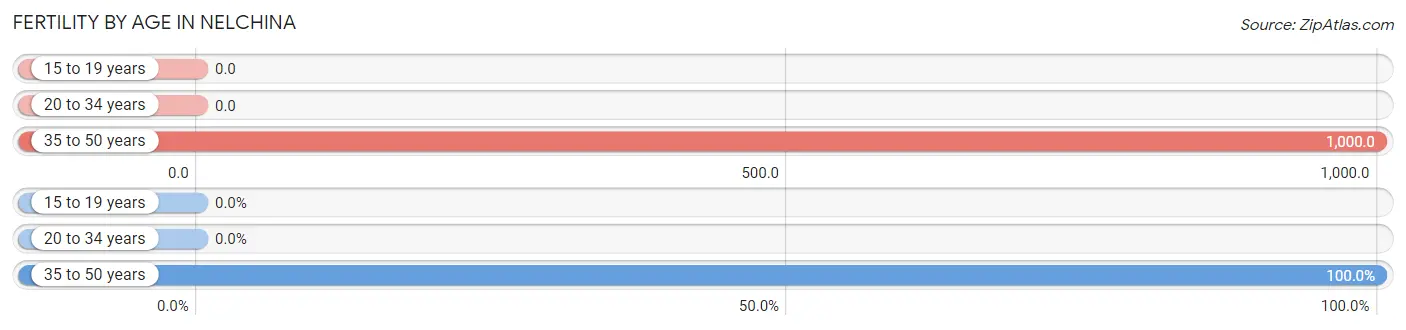
| Age Bracket | Women with Births | Births / 1,000 Women |
| 15 to 19 years | 0 (0.0%) | 0.0 |
| 20 to 34 years | 0 (0.0%) | 0.0 |
| 35 to 50 years | 34 (100.0%) | 1,000.0 |
| Total | 34 (100.0%) | 1,000.0 |
Fertility by Age by Marriage Status in Nelchina
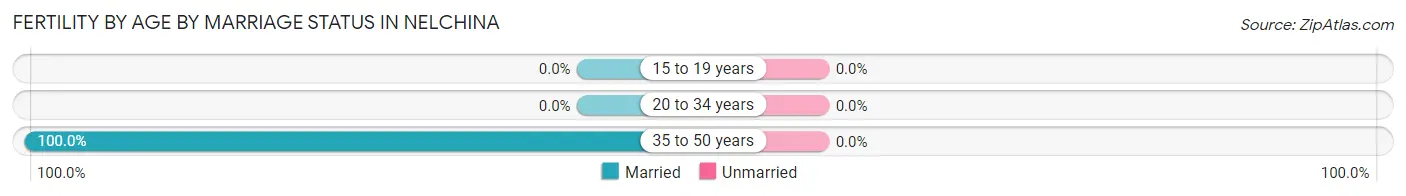
| Age Bracket | Married | Unmarried |
| 15 to 19 years | 0 (0.0%) | 0 (0.0%) |
| 20 to 34 years | 0 (0.0%) | 0 (0.0%) |
| 35 to 50 years | 34 (100.0%) | 0 (0.0%) |
| Total | 34 (100.0%) | 0 (0.0%) |
Fertility by Education in Nelchina
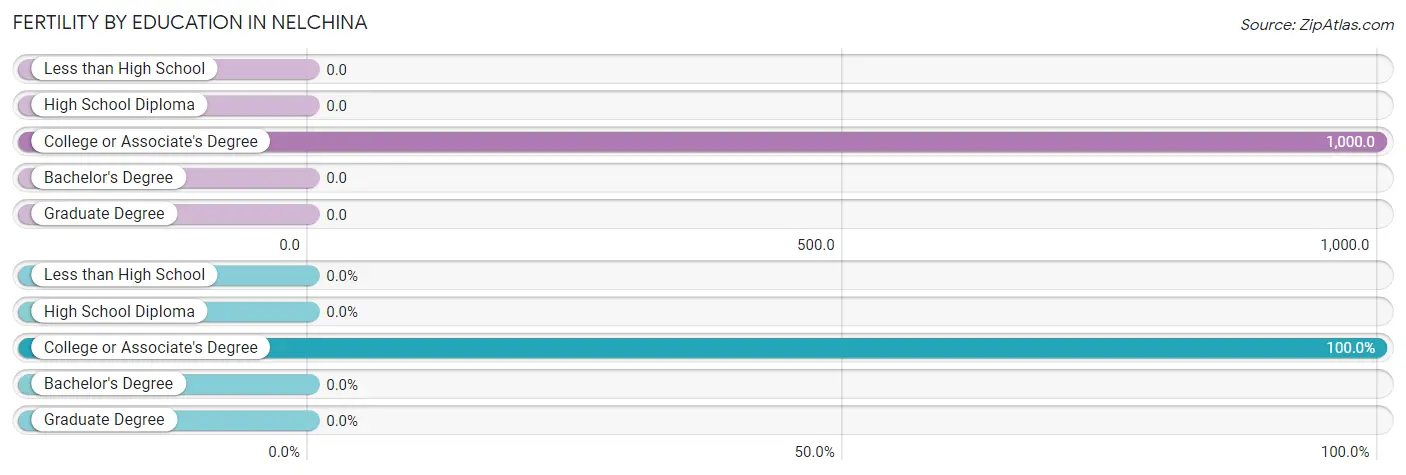
| Educational Attainment | Women with Births | Births / 1,000 Women |
| Less than High School | 0 (0.0%) | 0.0 |
| High School Diploma | 0 (0.0%) | 0.0 |
| College or Associate's Degree | 34 (100.0%) | 1,000.0 |
| Bachelor's Degree | 0 (0.0%) | 0.0 |
| Graduate Degree | 0 (0.0%) | 0.0 |
| Total | 34 (100.0%) | 1,000.0 |
Fertility by Education by Marriage Status in Nelchina
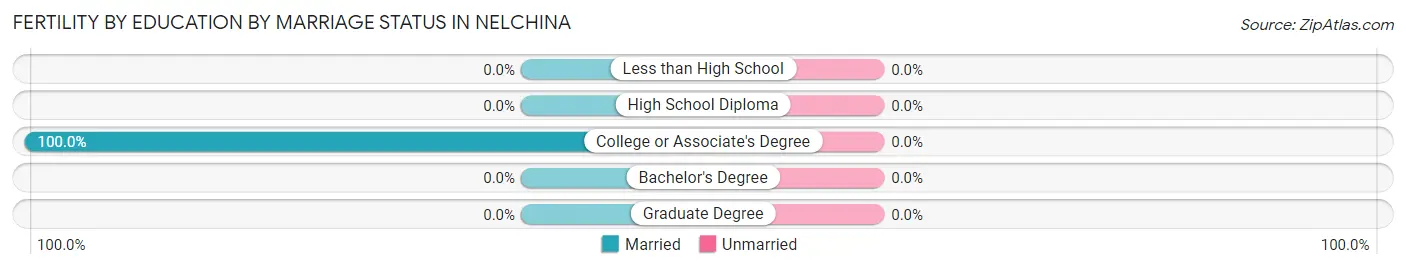
| Educational Attainment | Married | Unmarried |
| Less than High School | 0 (0.0%) | 0 (0.0%) |
| High School Diploma | 0 (0.0%) | 0 (0.0%) |
| College or Associate's Degree | 34 (100.0%) | 0 (0.0%) |
| Bachelor's Degree | 0 (0.0%) | 0 (0.0%) |
| Graduate Degree | 0 (0.0%) | 0 (0.0%) |
| Total | 34 (100.0%) | 0 (0.0%) |
Employment Characteristics in Nelchina
Employment by Class of Employer in Nelchina
Among the 46 employed individuals in Nelchina, federal government employees (40 | 87.0%), and private company employees (6 | 13.0%) make up the most common classes of employment.
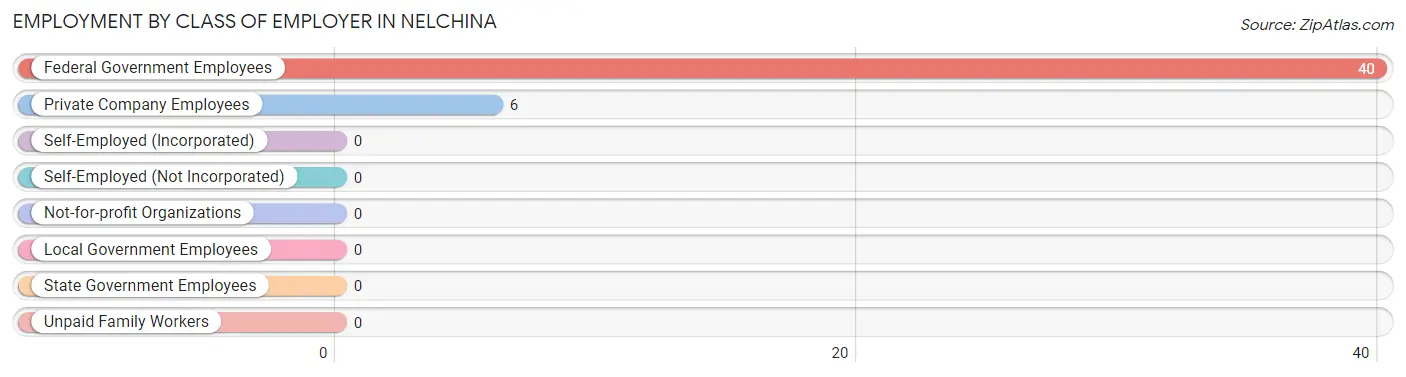
| Employer Class | # Employees | % Employees |
| Private Company Employees | 6 | 13.0% |
| Self-Employed (Incorporated) | 0 | 0.0% |
| Self-Employed (Not Incorporated) | 0 | 0.0% |
| Not-for-profit Organizations | 0 | 0.0% |
| Local Government Employees | 0 | 0.0% |
| State Government Employees | 0 | 0.0% |
| Federal Government Employees | 40 | 87.0% |
| Unpaid Family Workers | 0 | 0.0% |
| Total | 46 | 100.0% |
Employment Status by Age in Nelchina
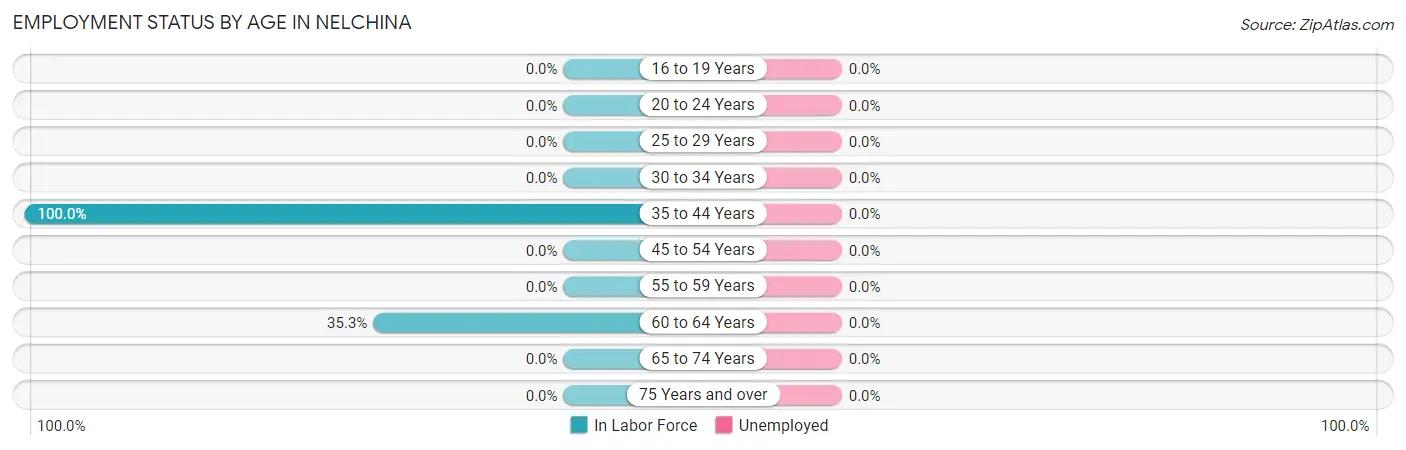
| Age Bracket | In Labor Force | Unemployed |
| 16 to 19 Years | 0 (0.0%) | 0 (0.0%) |
| 20 to 24 Years | 0 (0.0%) | 0 (0.0%) |
| 25 to 29 Years | 0 (0.0%) | 0 (0.0%) |
| 30 to 34 Years | 0 (0.0%) | 0 (0.0%) |
| 35 to 44 Years | 40 (100.0%) | 0 (0.0%) |
| 45 to 54 Years | 0 (0.0%) | 0 (0.0%) |
| 55 to 59 Years | 0 (0.0%) | 0 (0.0%) |
| 60 to 64 Years | 6 (35.3%) | 0 (0.0%) |
| 65 to 74 Years | 0 (0.0%) | 0 (0.0%) |
| 75 Years and over | 0 (0.0%) | 0 (0.0%) |
| Total | 46 (50.5%) | 0 (0.0%) |
Employment Status by Educational Attainment in Nelchina
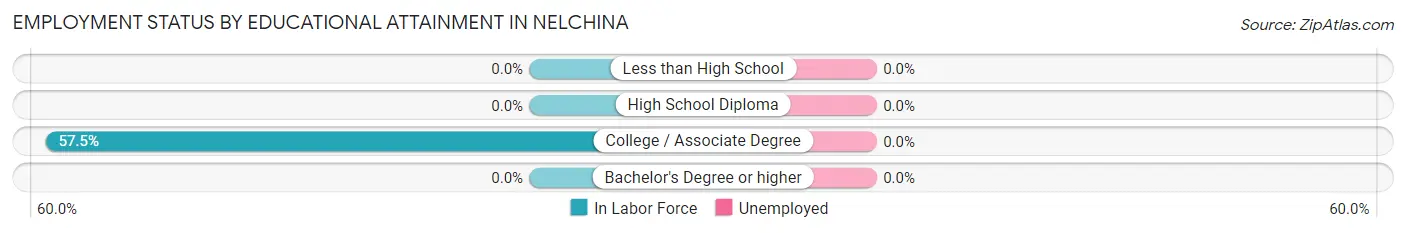
| Educational Attainment | In Labor Force | Unemployed |
| Less than High School | 0 (0.0%) | 0 (0.0%) |
| High School Diploma | 0 (0.0%) | 0 (0.0%) |
| College / Associate Degree | 46 (57.5%) | 0 (0.0%) |
| Bachelor's Degree or higher | 0 (0.0%) | 0 (0.0%) |
| Total | 46 (50.5%) | 0 (0.0%) |
Employment Occupations by Sex in Nelchina
Management, Business, Science and Arts Occupations
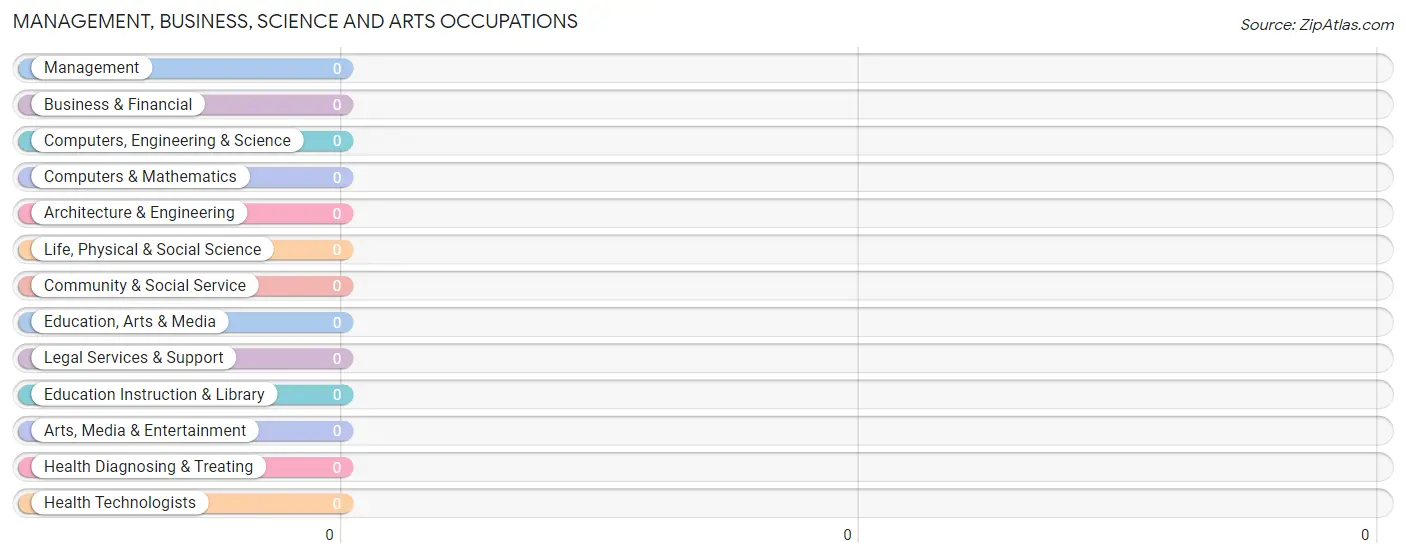
Management, Business, Science and Arts Occupations by Sex
| Occupation | Male | Female |
| Management | 0 (0.0%) | 0 (0.0%) |
| Business & Financial | 0 (0.0%) | 0 (0.0%) |
| Computers, Engineering & Science | 0 (0.0%) | 0 (0.0%) |
| Computers & Mathematics | 0 (0.0%) | 0 (0.0%) |
| Architecture & Engineering | 0 (0.0%) | 0 (0.0%) |
| Life, Physical & Social Science | 0 (0.0%) | 0 (0.0%) |
| Community & Social Service | 0 (0.0%) | 0 (0.0%) |
| Education, Arts & Media | 0 (0.0%) | 0 (0.0%) |
| Legal Services & Support | 0 (0.0%) | 0 (0.0%) |
| Education Instruction & Library | 0 (0.0%) | 0 (0.0%) |
| Arts, Media & Entertainment | 0 (0.0%) | 0 (0.0%) |
| Health Diagnosing & Treating | 0 (0.0%) | 0 (0.0%) |
| Health Technologists | 0 (0.0%) | 0 (0.0%) |
| Total (Category) | 0 (0.0%) | 0 (0.0%) |
| Total (Overall) | 40 (87.0%) | 6 (13.0%) |
Services Occupations
The most common Services occupations in Nelchina are , and Healthcare Support (6 | 13.0%).
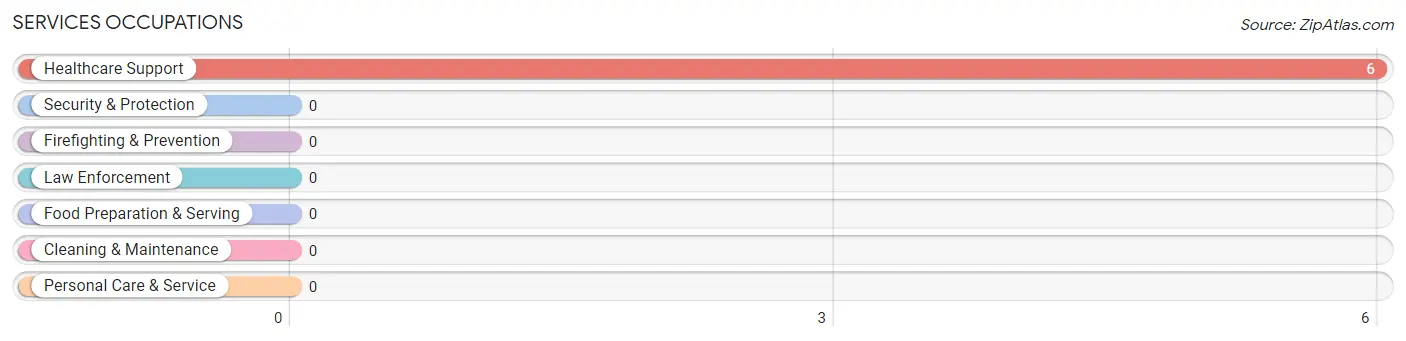
Services Occupations by Sex
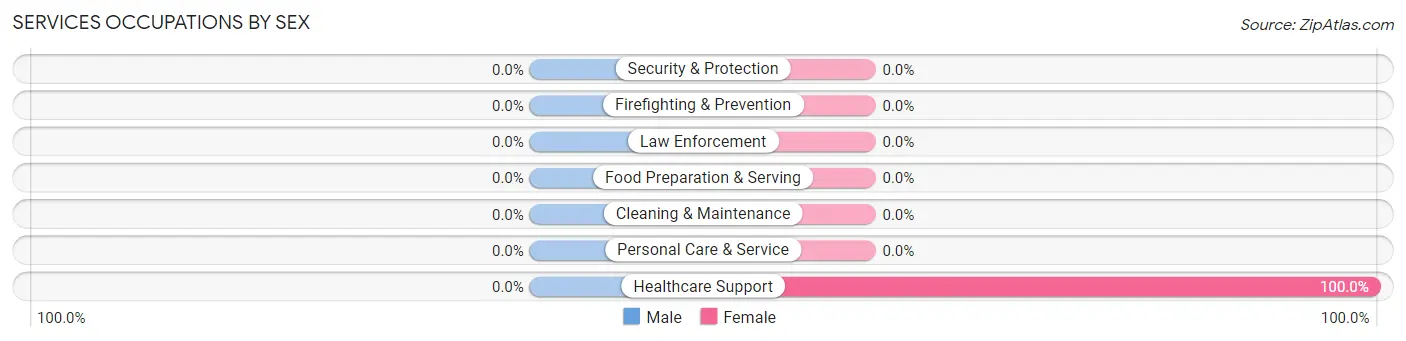
| Occupation | Male | Female |
| Healthcare Support | 0 (0.0%) | 6 (100.0%) |
| Security & Protection | 0 (0.0%) | 0 (0.0%) |
| Firefighting & Prevention | 0 (0.0%) | 0 (0.0%) |
| Law Enforcement | 0 (0.0%) | 0 (0.0%) |
| Food Preparation & Serving | 0 (0.0%) | 0 (0.0%) |
| Cleaning & Maintenance | 0 (0.0%) | 0 (0.0%) |
| Personal Care & Service | 0 (0.0%) | 0 (0.0%) |
| Total (Category) | 0 (0.0%) | 6 (100.0%) |
| Total (Overall) | 40 (87.0%) | 6 (13.0%) |
Sales and Office Occupations
Sales and Office Occupations by Sex
| Occupation | Male | Female |
| Sales & Related | 0 (0.0%) | 0 (0.0%) |
| Office & Administration | 0 (0.0%) | 0 (0.0%) |
| Total (Category) | 0 (0.0%) | 0 (0.0%) |
| Total (Overall) | 40 (87.0%) | 6 (13.0%) |
Natural Resources, Construction and Maintenance Occupations
The most common Natural Resources, Construction and Maintenance occupations in Nelchina are , and Construction & Extraction (40 | 87.0%).
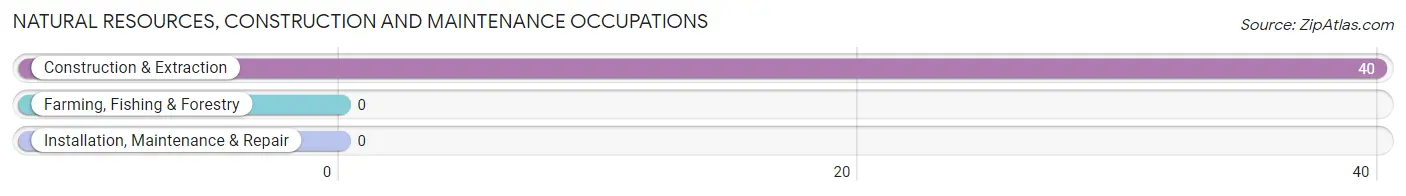
Natural Resources, Construction and Maintenance Occupations by Sex
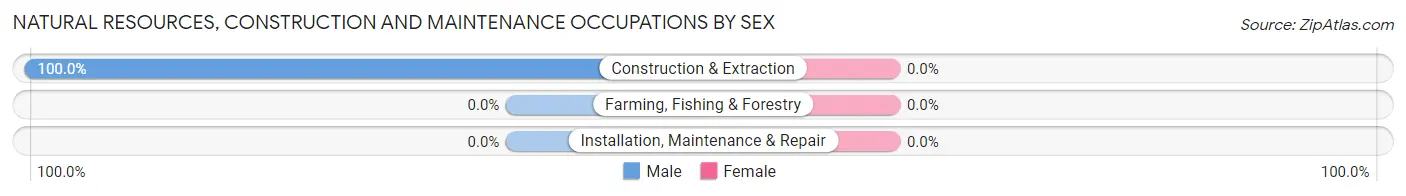
| Occupation | Male | Female |
| Farming, Fishing & Forestry | 0 (0.0%) | 0 (0.0%) |
| Construction & Extraction | 40 (100.0%) | 0 (0.0%) |
| Installation, Maintenance & Repair | 0 (0.0%) | 0 (0.0%) |
| Total (Category) | 40 (100.0%) | 0 (0.0%) |
| Total (Overall) | 40 (87.0%) | 6 (13.0%) |
Production, Transportation and Moving Occupations
Production, Transportation and Moving Occupations by Sex
| Occupation | Male | Female |
| Production | 0 (0.0%) | 0 (0.0%) |
| Transportation | 0 (0.0%) | 0 (0.0%) |
| Material Moving | 0 (0.0%) | 0 (0.0%) |
| Total (Category) | 0 (0.0%) | 0 (0.0%) |
| Total (Overall) | 40 (87.0%) | 6 (13.0%) |
Employment Industries by Sex in Nelchina
Employment Industries in Nelchina
The major employment industries in Nelchina include Manufacturing (40 | 87.0%), and Health Care & Social Assistance (6 | 13.0%).
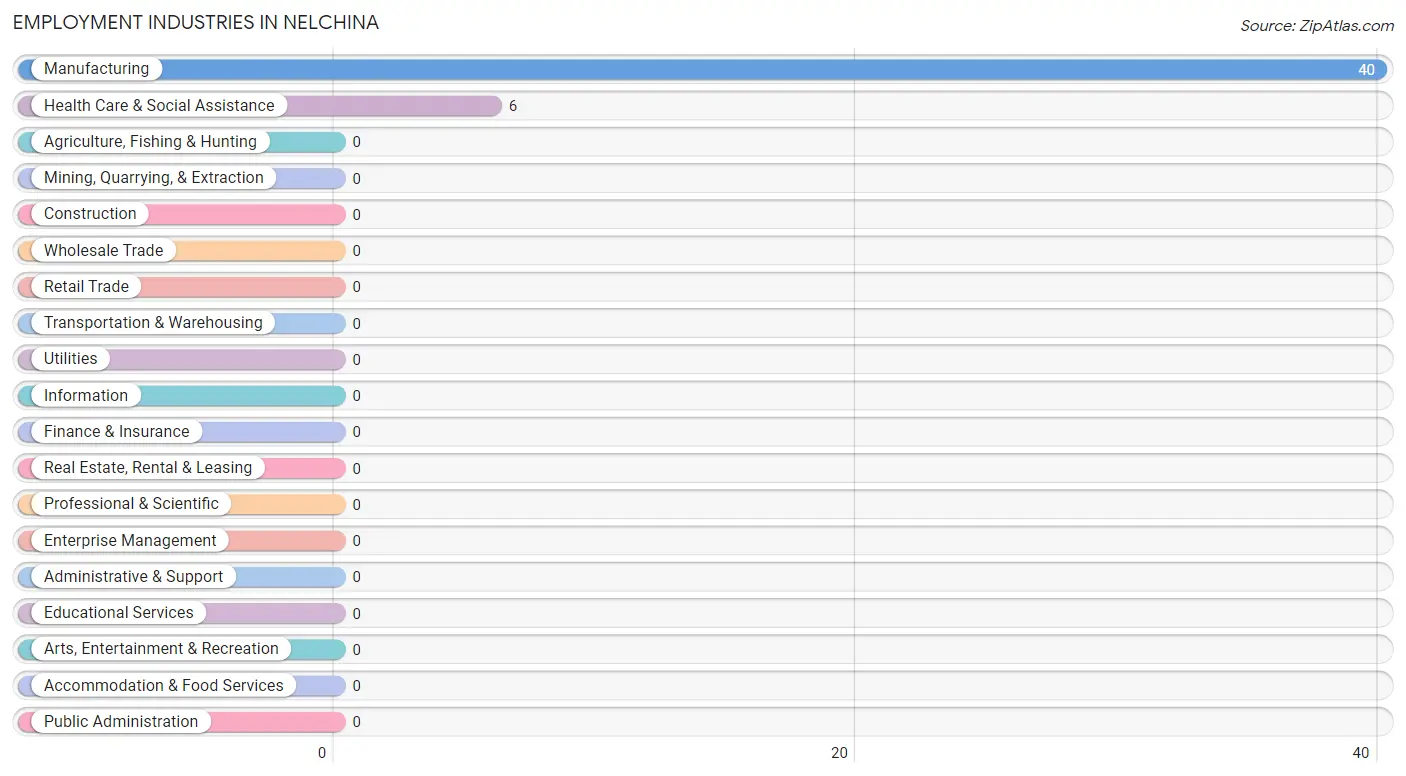
Employment Industries by Sex in Nelchina
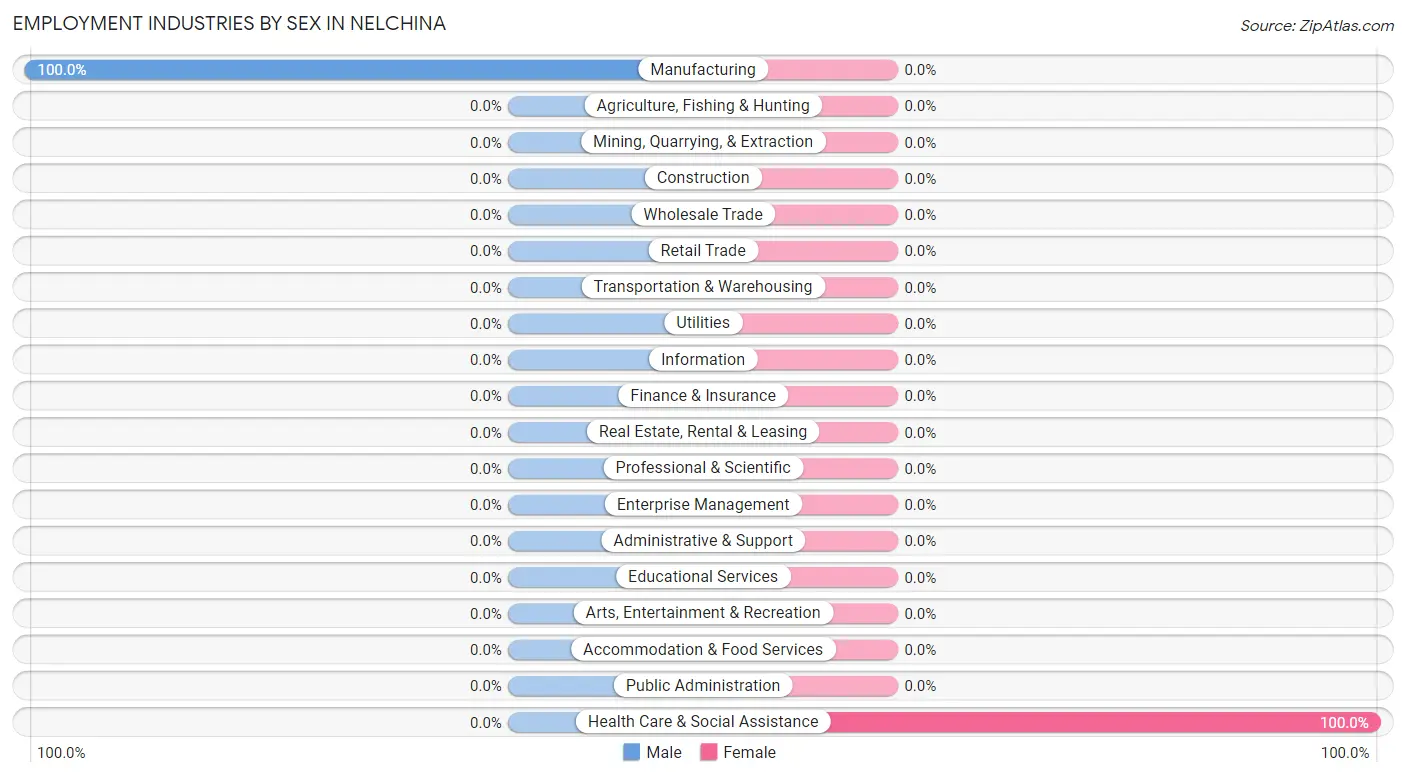
| Industry | Male | Female |
| Agriculture, Fishing & Hunting | 0 (0.0%) | 0 (0.0%) |
| Mining, Quarrying, & Extraction | 0 (0.0%) | 0 (0.0%) |
| Construction | 0 (0.0%) | 0 (0.0%) |
| Manufacturing | 40 (100.0%) | 0 (0.0%) |
| Wholesale Trade | 0 (0.0%) | 0 (0.0%) |
| Retail Trade | 0 (0.0%) | 0 (0.0%) |
| Transportation & Warehousing | 0 (0.0%) | 0 (0.0%) |
| Utilities | 0 (0.0%) | 0 (0.0%) |
| Information | 0 (0.0%) | 0 (0.0%) |
| Finance & Insurance | 0 (0.0%) | 0 (0.0%) |
| Real Estate, Rental & Leasing | 0 (0.0%) | 0 (0.0%) |
| Professional & Scientific | 0 (0.0%) | 0 (0.0%) |
| Enterprise Management | 0 (0.0%) | 0 (0.0%) |
| Administrative & Support | 0 (0.0%) | 0 (0.0%) |
| Educational Services | 0 (0.0%) | 0 (0.0%) |
| Health Care & Social Assistance | 0 (0.0%) | 6 (100.0%) |
| Arts, Entertainment & Recreation | 0 (0.0%) | 0 (0.0%) |
| Accommodation & Food Services | 0 (0.0%) | 0 (0.0%) |
| Public Administration | 0 (0.0%) | 0 (0.0%) |
| Total | 40 (87.0%) | 6 (13.0%) |
Education in Nelchina
School Enrollment in Nelchina
The most common levels of schooling among the 44 students in Nelchina are middle school (27 | 61.4%), and high school (17 | 38.6%).
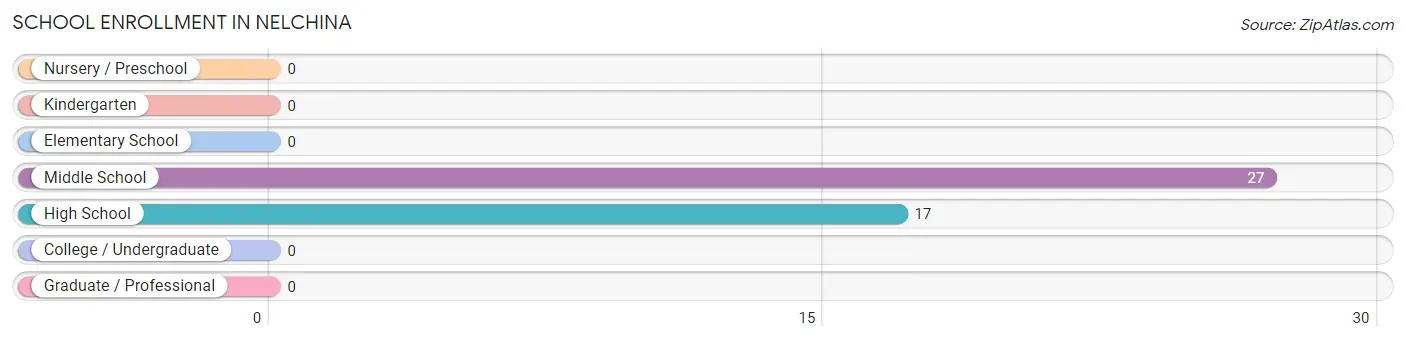
| School Level | # Students | % Students |
| Nursery / Preschool | 0 | 0.0% |
| Kindergarten | 0 | 0.0% |
| Elementary School | 0 | 0.0% |
| Middle School | 27 | 61.4% |
| High School | 17 | 38.6% |
| College / Undergraduate | 0 | 0.0% |
| Graduate / Professional | 0 | 0.0% |
| Total | 44 | 100.0% |
School Enrollment by Age by Funding Source in Nelchina
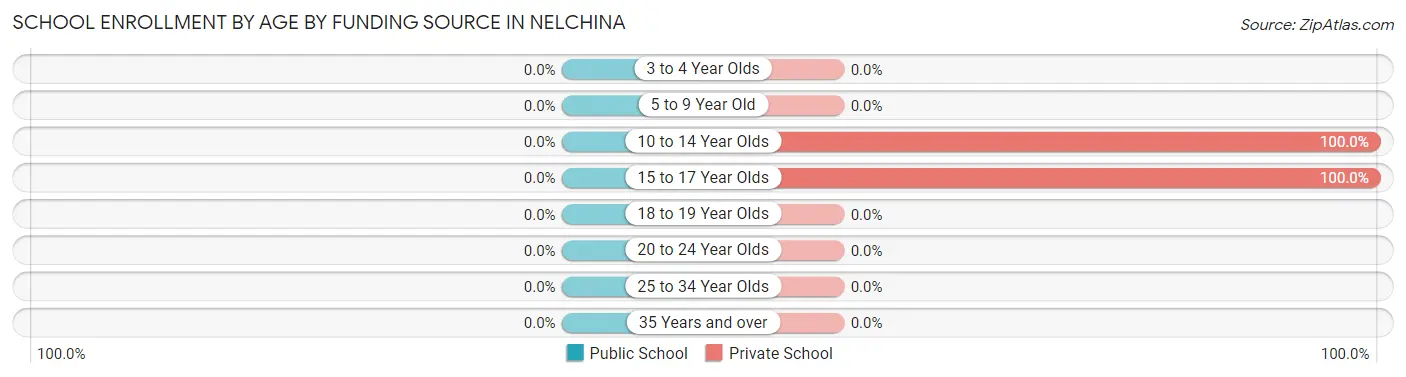
| Age Bracket | Public School | Private School |
| 3 to 4 Year Olds | 0 (0.0%) | 0 (0.0%) |
| 5 to 9 Year Old | 0 (0.0%) | 0 (0.0%) |
| 10 to 14 Year Olds | 0 (0.0%) | 27 (100.0%) |
| 15 to 17 Year Olds | 0 (0.0%) | 17 (100.0%) |
| 18 to 19 Year Olds | 0 (0.0%) | 0 (0.0%) |
| 20 to 24 Year Olds | 0 (0.0%) | 0 (0.0%) |
| 25 to 34 Year Olds | 0 (0.0%) | 0 (0.0%) |
| 35 Years and over | 0 (0.0%) | 0 (0.0%) |
| Total | 0 (0.0%) | 44 (100.0%) |
Educational Attainment by Field of Study in Nelchina
, and education (11 | 100.0%) are the most common fields of study among 11 individuals in Nelchina who have obtained a bachelor's degree or higher.
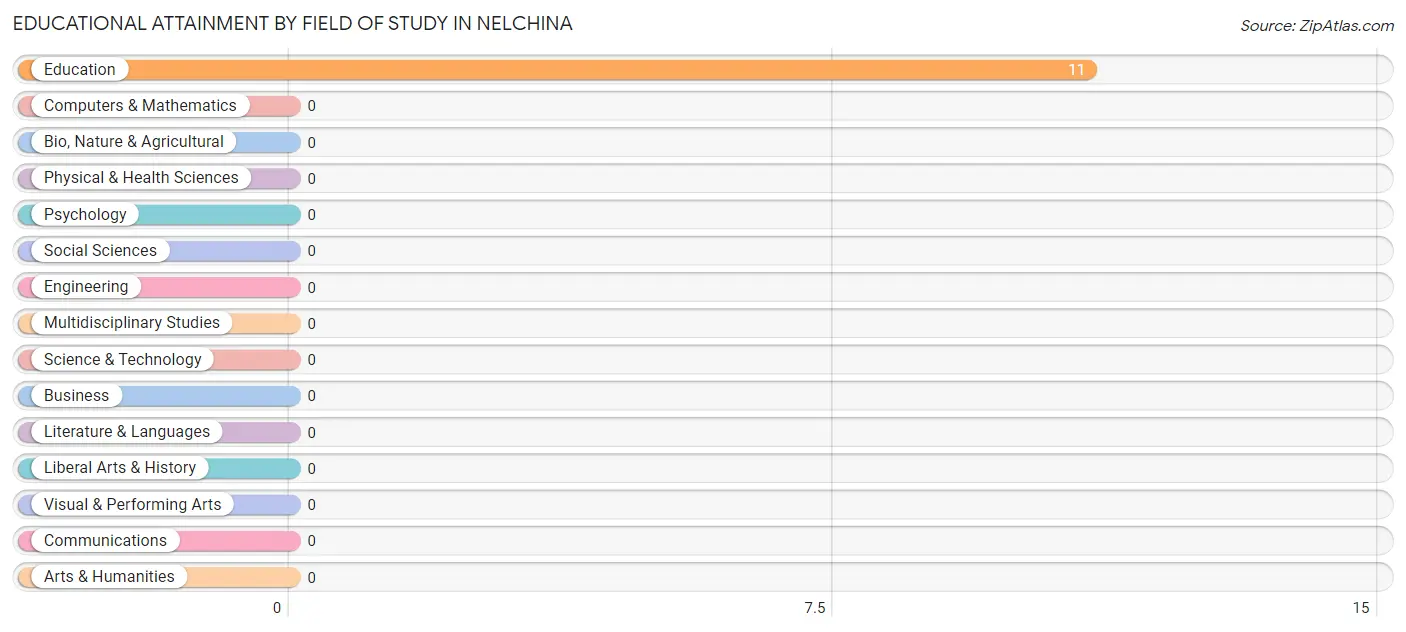
| Field of Study | # Graduates | % Graduates |
| Computers & Mathematics | 0 | 0.0% |
| Bio, Nature & Agricultural | 0 | 0.0% |
| Physical & Health Sciences | 0 | 0.0% |
| Psychology | 0 | 0.0% |
| Social Sciences | 0 | 0.0% |
| Engineering | 0 | 0.0% |
| Multidisciplinary Studies | 0 | 0.0% |
| Science & Technology | 0 | 0.0% |
| Business | 0 | 0.0% |
| Education | 11 | 100.0% |
| Literature & Languages | 0 | 0.0% |
| Liberal Arts & History | 0 | 0.0% |
| Visual & Performing Arts | 0 | 0.0% |
| Communications | 0 | 0.0% |
| Arts & Humanities | 0 | 0.0% |
| Total | 11 | 100.0% |
Transportation & Commute in Nelchina
Vehicle Availability by Sex in Nelchina
The most prevalent vehicle ownership categories in Nelchina are males with 3 vehicles (40, accounting for 100.0%) and females with 3 vehicles (0, making up 666.7%).
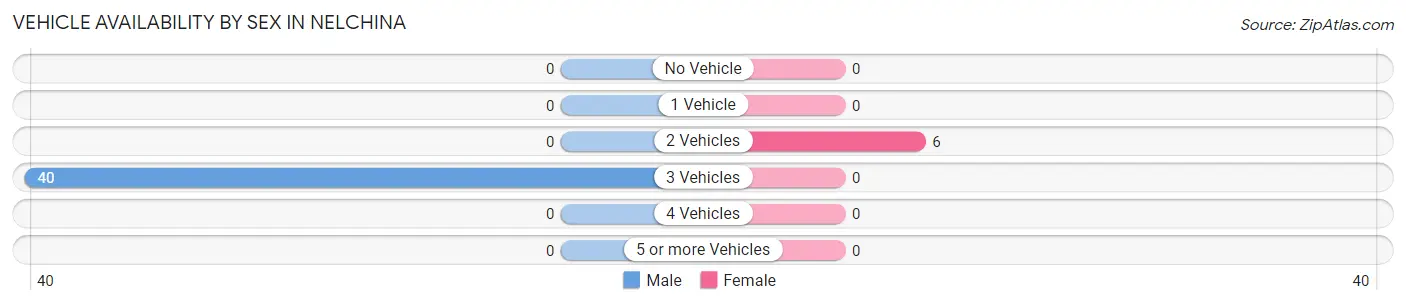
| Vehicles Available | Male | Female |
| No Vehicle | 0 (0.0%) | 0 (0.0%) |
| 1 Vehicle | 0 (0.0%) | 0 (0.0%) |
| 2 Vehicles | 0 (0.0%) | 6 (100.0%) |
| 3 Vehicles | 40 (100.0%) | 0 (0.0%) |
| 4 Vehicles | 0 (0.0%) | 0 (0.0%) |
| 5 or more Vehicles | 0 (0.0%) | 0 (0.0%) |
| Total | 40 (100.0%) | 6 (100.0%) |
Commute Time in Nelchina
The most frequently occuring commute durations in Nelchina are 90 or more minutes (40 commuters, 87.0%), 45 to 59 minutes (6 commuters, 13.0%), and less than 5 minutes (0 commuters, 0.0%).
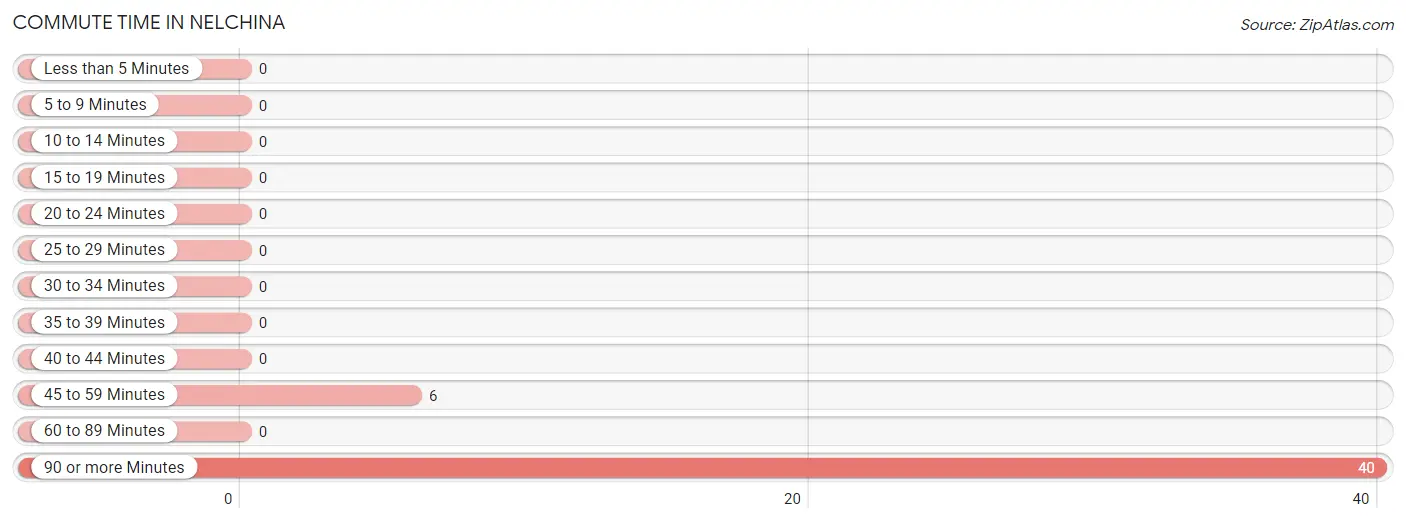
| Commute Time | # Commuters | % Commuters |
| Less than 5 Minutes | 0 | 0.0% |
| 5 to 9 Minutes | 0 | 0.0% |
| 10 to 14 Minutes | 0 | 0.0% |
| 15 to 19 Minutes | 0 | 0.0% |
| 20 to 24 Minutes | 0 | 0.0% |
| 25 to 29 Minutes | 0 | 0.0% |
| 30 to 34 Minutes | 0 | 0.0% |
| 35 to 39 Minutes | 0 | 0.0% |
| 40 to 44 Minutes | 0 | 0.0% |
| 45 to 59 Minutes | 6 | 13.0% |
| 60 to 89 Minutes | 0 | 0.0% |
| 90 or more Minutes | 40 | 87.0% |
Commute Time by Sex in Nelchina
The most common commute times in Nelchina are 90 or more minutes (40 commuters, 100.0%) for males and 45 to 59 minutes (6 commuters, 100.0%) for females.
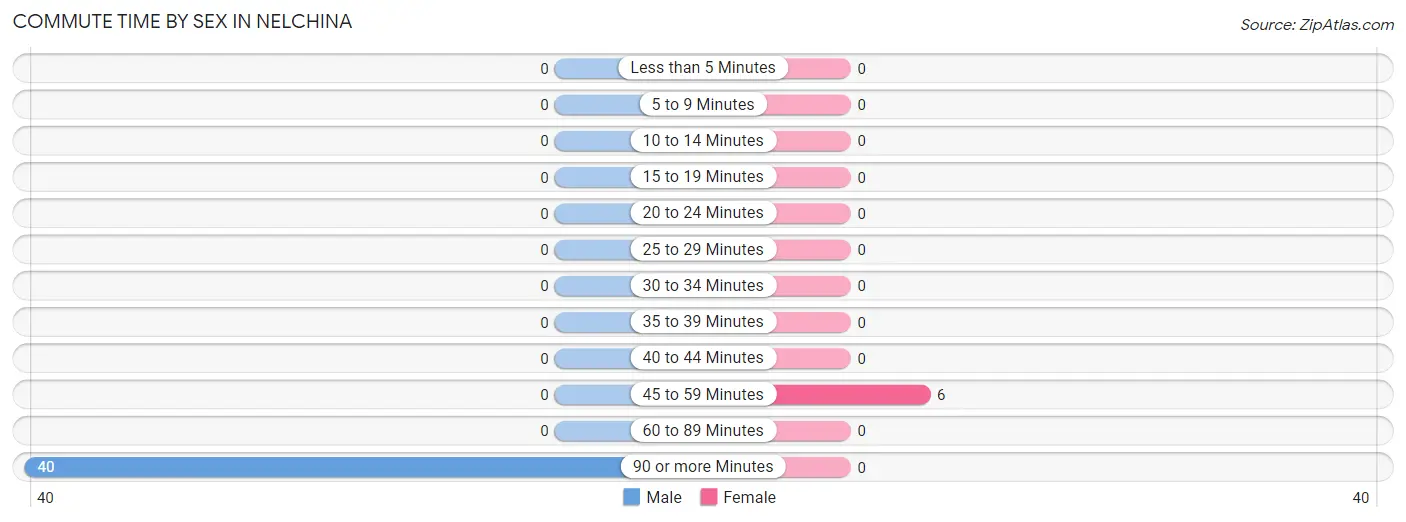
| Commute Time | Male | Female |
| Less than 5 Minutes | 0 (0.0%) | 0 (0.0%) |
| 5 to 9 Minutes | 0 (0.0%) | 0 (0.0%) |
| 10 to 14 Minutes | 0 (0.0%) | 0 (0.0%) |
| 15 to 19 Minutes | 0 (0.0%) | 0 (0.0%) |
| 20 to 24 Minutes | 0 (0.0%) | 0 (0.0%) |
| 25 to 29 Minutes | 0 (0.0%) | 0 (0.0%) |
| 30 to 34 Minutes | 0 (0.0%) | 0 (0.0%) |
| 35 to 39 Minutes | 0 (0.0%) | 0 (0.0%) |
| 40 to 44 Minutes | 0 (0.0%) | 0 (0.0%) |
| 45 to 59 Minutes | 0 (0.0%) | 6 (100.0%) |
| 60 to 89 Minutes | 0 (0.0%) | 0 (0.0%) |
| 90 or more Minutes | 40 (100.0%) | 0 (0.0%) |
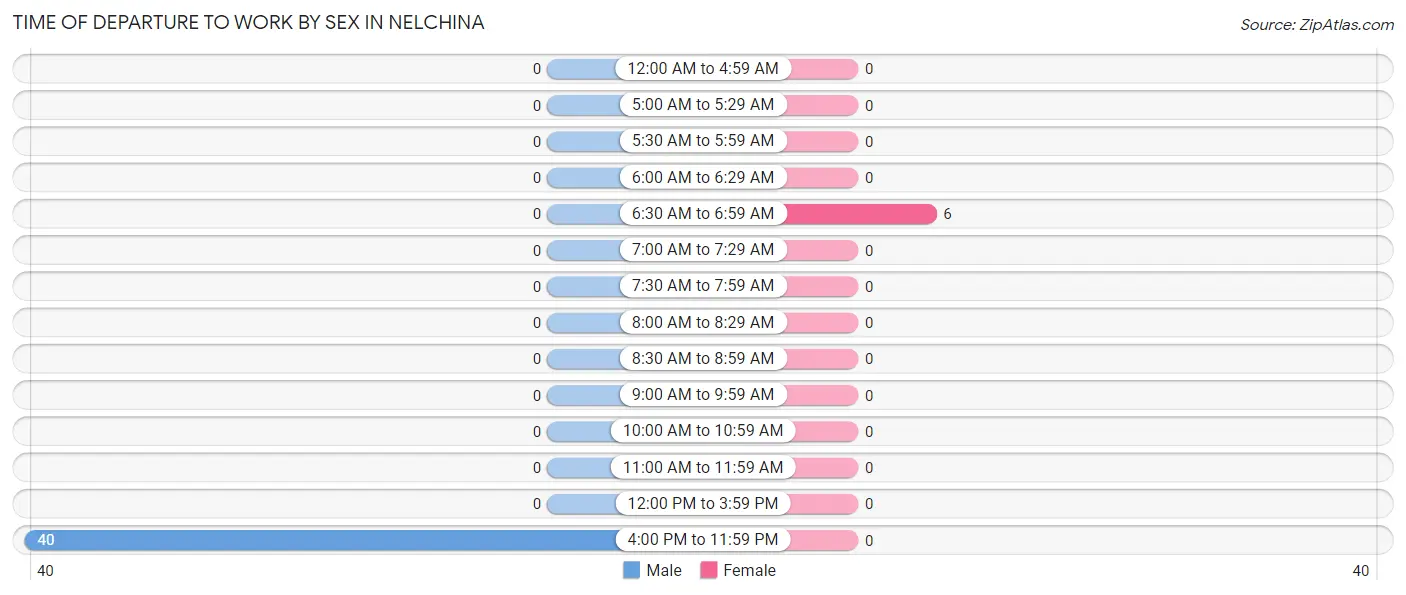
Time of Departure to Work by Sex in Nelchina
The most frequent times of departure to work in Nelchina are 4:00 PM to 11:59 PM (40, 100.0%) for males and 6:30 AM to 6:59 AM (6, 100.0%) for females.
| Time of Departure | Male | Female |
| 12:00 AM to 4:59 AM | 0 (0.0%) | 0 (0.0%) |
| 5:00 AM to 5:29 AM | 0 (0.0%) | 0 (0.0%) |
| 5:30 AM to 5:59 AM | 0 (0.0%) | 0 (0.0%) |
| 6:00 AM to 6:29 AM | 0 (0.0%) | 0 (0.0%) |
| 6:30 AM to 6:59 AM | 0 (0.0%) | 6 (100.0%) |
| 7:00 AM to 7:29 AM | 0 (0.0%) | 0 (0.0%) |
| 7:30 AM to 7:59 AM | 0 (0.0%) | 0 (0.0%) |
| 8:00 AM to 8:29 AM | 0 (0.0%) | 0 (0.0%) |
| 8:30 AM to 8:59 AM | 0 (0.0%) | 0 (0.0%) |
| 9:00 AM to 9:59 AM | 0 (0.0%) | 0 (0.0%) |
| 10:00 AM to 10:59 AM | 0 (0.0%) | 0 (0.0%) |
| 11:00 AM to 11:59 AM | 0 (0.0%) | 0 (0.0%) |
| 12:00 PM to 3:59 PM | 0 (0.0%) | 0 (0.0%) |
| 4:00 PM to 11:59 PM | 40 (100.0%) | 0 (0.0%) |
| Total | 40 (100.0%) | 6 (100.0%) |
Housing Occupancy in Nelchina
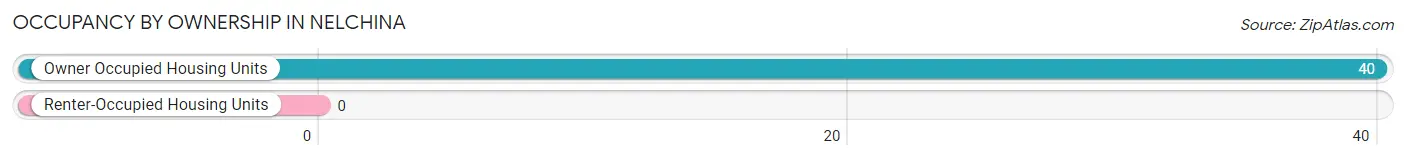
Occupancy by Ownership in Nelchina
Of the total 40 dwellings in Nelchina, owner-occupied units account for 40 (100.0%), while renter-occupied units make up 0 (0.0%).
| Occupancy | # Housing Units | % Housing Units |
| Owner Occupied Housing Units | 40 | 100.0% |
| Renter-Occupied Housing Units | 0 | 0.0% |
| Total Occupied Housing Units | 40 | 100.0% |
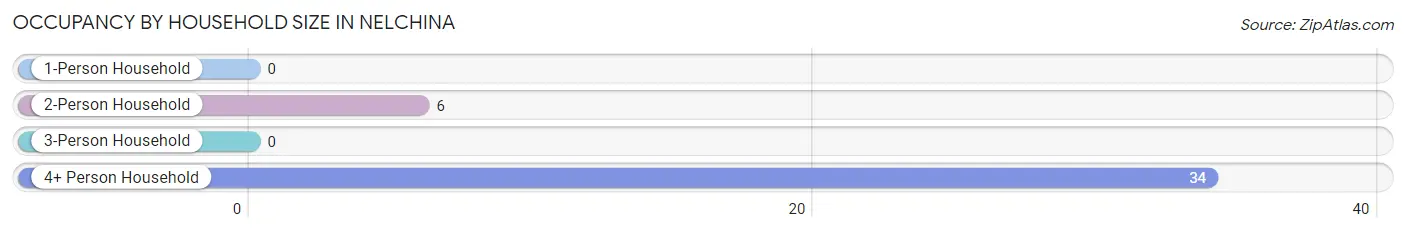
Occupancy by Household Size in Nelchina
| Household Size | # Housing Units | % Housing Units |
| 1-Person Household | 0 | 0.0% |
| 2-Person Household | 6 | 15.0% |
| 3-Person Household | 0 | 0.0% |
| 4+ Person Household | 34 | 85.0% |
| Total Housing Units | 40 | 100.0% |
Occupancy by Ownership by Household Size in Nelchina
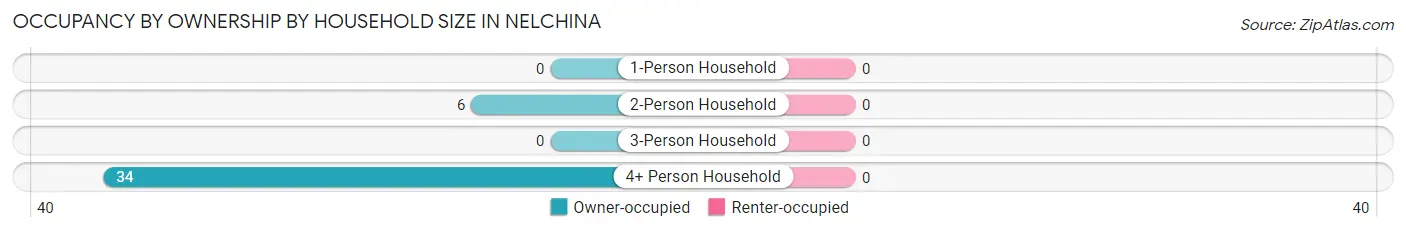
| Household Size | Owner-occupied | Renter-occupied |
| 1-Person Household | 0 (0.0%) | 0 (0.0%) |
| 2-Person Household | 6 (100.0%) | 0 (0.0%) |
| 3-Person Household | 0 (0.0%) | 0 (0.0%) |
| 4+ Person Household | 34 (100.0%) | 0 (0.0%) |
| Total Housing Units | 40 (100.0%) | 0 (0.0%) |
Occupancy by Educational Attainment in Nelchina
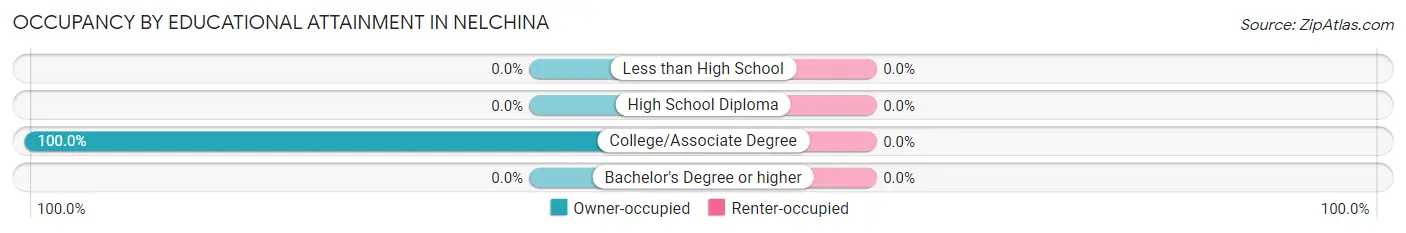
| Household Size | Owner-occupied | Renter-occupied |
| Less than High School | 0 (0.0%) | 0 (0.0%) |
| High School Diploma | 0 (0.0%) | 0 (0.0%) |
| College/Associate Degree | 40 (100.0%) | 0 (0.0%) |
| Bachelor's Degree or higher | 0 (0.0%) | 0 (0.0%) |
Occupancy by Age of Householder in Nelchina
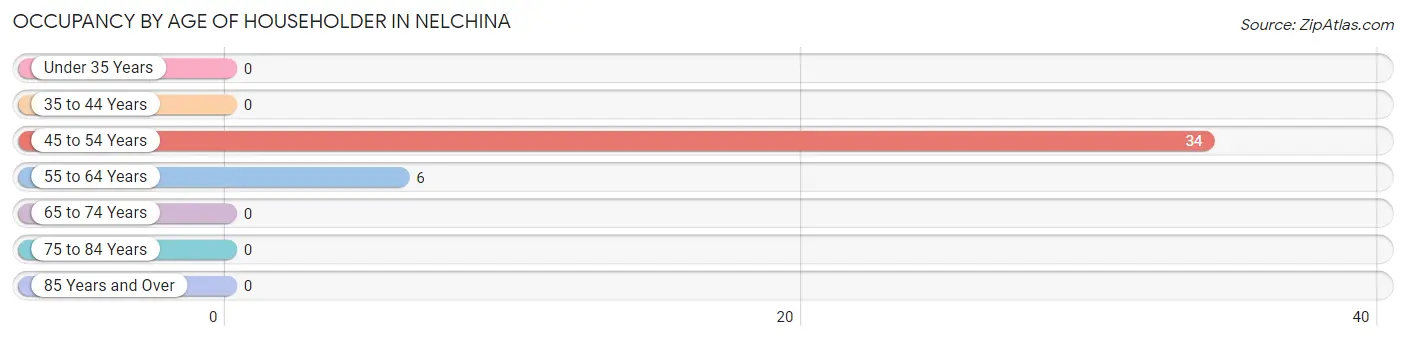
| Age Bracket | # Households | % Households |
| Under 35 Years | 0 | 0.0% |
| 35 to 44 Years | 0 | 0.0% |
| 45 to 54 Years | 34 | 85.0% |
| 55 to 64 Years | 6 | 15.0% |
| 65 to 74 Years | 0 | 0.0% |
| 75 to 84 Years | 0 | 0.0% |
| 85 Years and Over | 0 | 0.0% |
| Total | 40 | 100.0% |
Housing Finances in Nelchina
Median Income by Occupancy in Nelchina
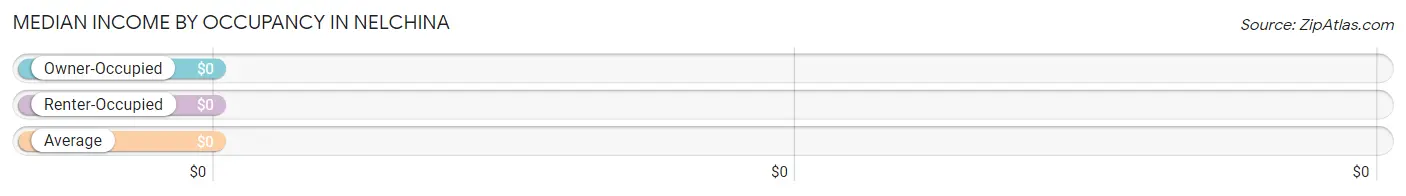
| Occupancy Type | # Households | Median Income |
| Owner-Occupied | 40 (100.0%) | $0 |
| Renter-Occupied | 0 (0.0%) | $0 |
| Average | 40 (100.0%) | $0 |
Occupancy by Householder Income Bracket in Nelchina
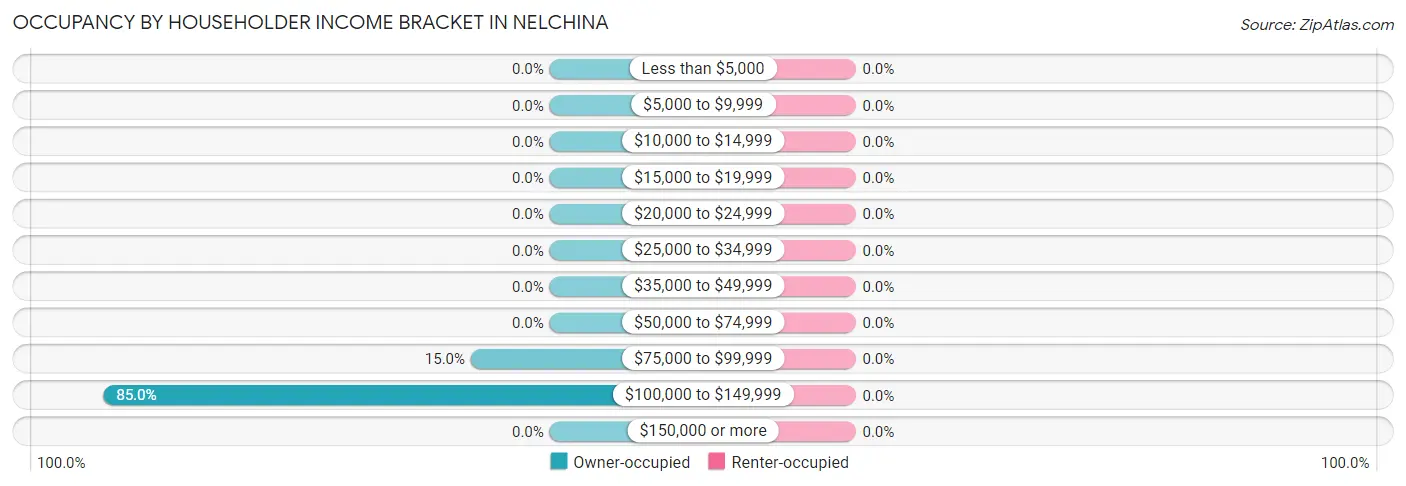
| Income Bracket | Owner-occupied | Renter-occupied |
| Less than $5,000 | 0 (0.0%) | 0 (0.0%) |
| $5,000 to $9,999 | 0 (0.0%) | 0 (0.0%) |
| $10,000 to $14,999 | 0 (0.0%) | 0 (0.0%) |
| $15,000 to $19,999 | 0 (0.0%) | 0 (0.0%) |
| $20,000 to $24,999 | 0 (0.0%) | 0 (0.0%) |
| $25,000 to $34,999 | 0 (0.0%) | 0 (0.0%) |
| $35,000 to $49,999 | 0 (0.0%) | 0 (0.0%) |
| $50,000 to $74,999 | 0 (0.0%) | 0 (0.0%) |
| $75,000 to $99,999 | 6 (15.0%) | 0 (0.0%) |
| $100,000 to $149,999 | 34 (85.0%) | 0 (0.0%) |
| $150,000 or more | 0 (0.0%) | 0 (0.0%) |
| Total | 40 (100.0%) | 0 (0.0%) |
Monthly Housing Cost Tiers in Nelchina
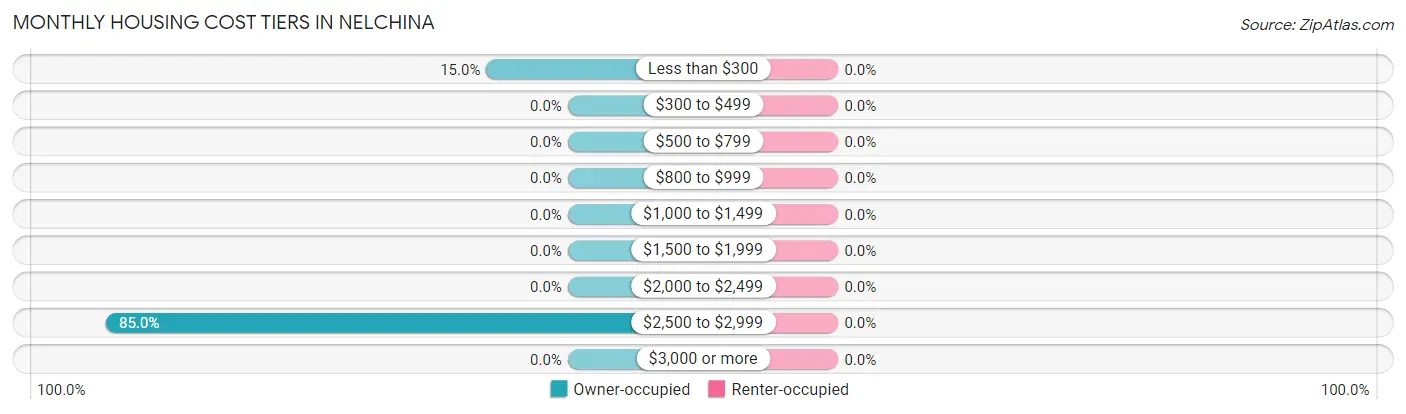
| Monthly Cost | Owner-occupied | Renter-occupied |
| Less than $300 | 6 (15.0%) | 0 (0.0%) |
| $300 to $499 | 0 (0.0%) | 0 (0.0%) |
| $500 to $799 | 0 (0.0%) | 0 (0.0%) |
| $800 to $999 | 0 (0.0%) | 0 (0.0%) |
| $1,000 to $1,499 | 0 (0.0%) | 0 (0.0%) |
| $1,500 to $1,999 | 0 (0.0%) | 0 (0.0%) |
| $2,000 to $2,499 | 0 (0.0%) | 0 (0.0%) |
| $2,500 to $2,999 | 34 (85.0%) | 0 (0.0%) |
| $3,000 or more | 0 (0.0%) | 0 (0.0%) |
| Total | 40 (100.0%) | 0 (0.0%) |
Physical Housing Characteristics in Nelchina
Housing Structures in Nelchina
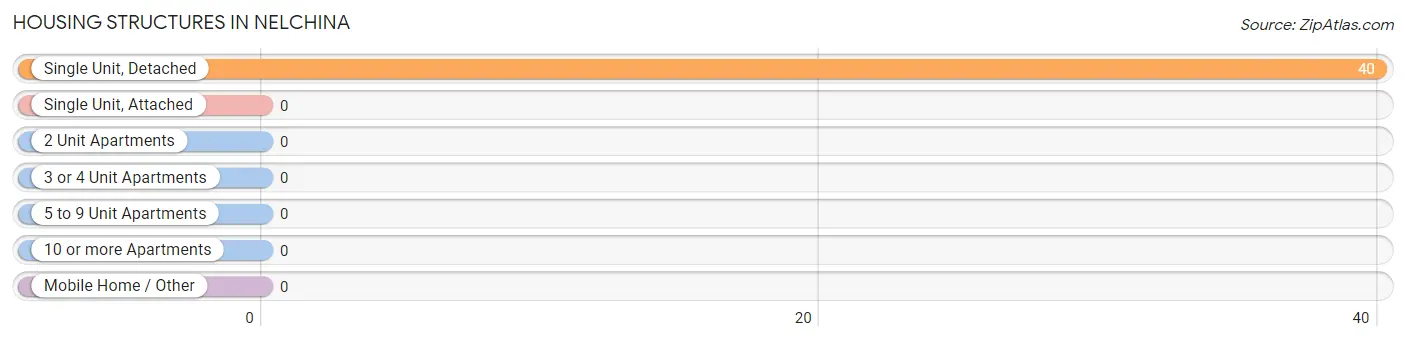
| Structure Type | # Housing Units | % Housing Units |
| Single Unit, Detached | 40 | 100.0% |
| Single Unit, Attached | 0 | 0.0% |
| 2 Unit Apartments | 0 | 0.0% |
| 3 or 4 Unit Apartments | 0 | 0.0% |
| 5 to 9 Unit Apartments | 0 | 0.0% |
| 10 or more Apartments | 0 | 0.0% |
| Mobile Home / Other | 0 | 0.0% |
| Total | 40 | 100.0% |
Housing Structures by Occupancy in Nelchina
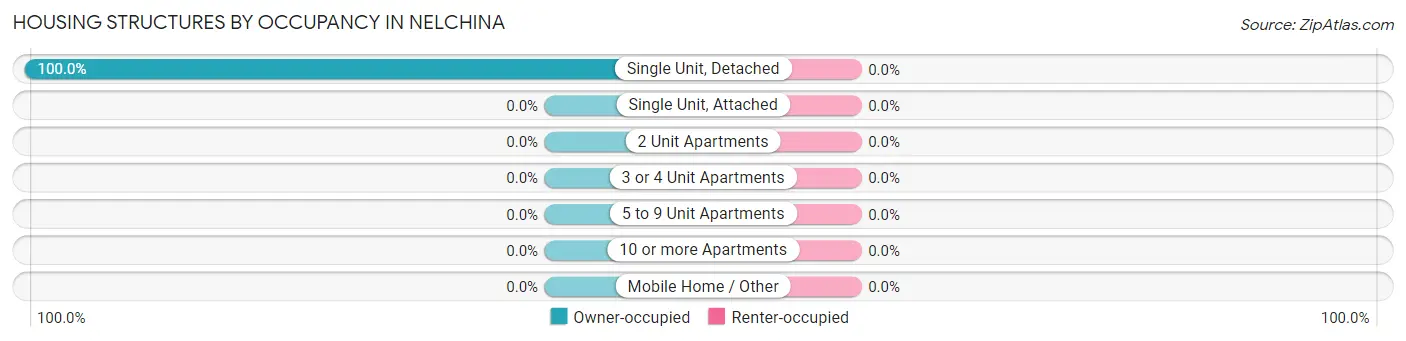
| Structure Type | Owner-occupied | Renter-occupied |
| Single Unit, Detached | 40 (100.0%) | 0 (0.0%) |
| Single Unit, Attached | 0 (0.0%) | 0 (0.0%) |
| 2 Unit Apartments | 0 (0.0%) | 0 (0.0%) |
| 3 or 4 Unit Apartments | 0 (0.0%) | 0 (0.0%) |
| 5 to 9 Unit Apartments | 0 (0.0%) | 0 (0.0%) |
| 10 or more Apartments | 0 (0.0%) | 0 (0.0%) |
| Mobile Home / Other | 0 (0.0%) | 0 (0.0%) |
| Total | 40 (100.0%) | 0 (0.0%) |
Housing Structures by Number of Rooms in Nelchina
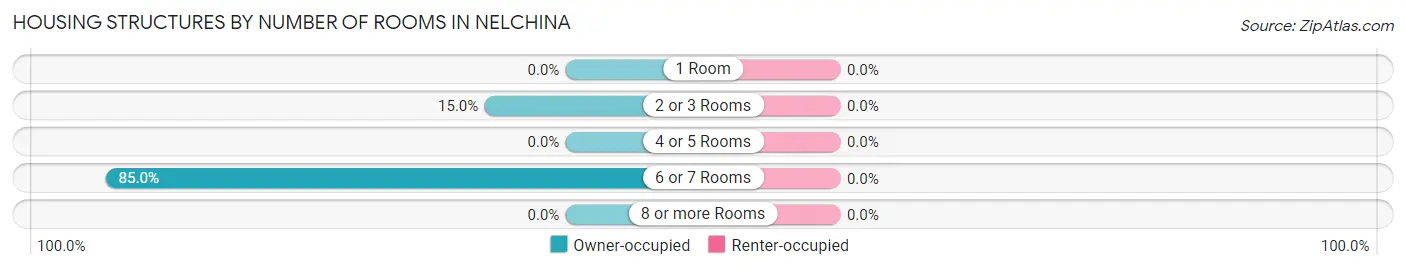
| Number of Rooms | Owner-occupied | Renter-occupied |
| 1 Room | 0 (0.0%) | 0 (0.0%) |
| 2 or 3 Rooms | 6 (15.0%) | 0 (0.0%) |
| 4 or 5 Rooms | 0 (0.0%) | 0 (0.0%) |
| 6 or 7 Rooms | 34 (85.0%) | 0 (0.0%) |
| 8 or more Rooms | 0 (0.0%) | 0 (0.0%) |
| Total | 40 (100.0%) | 0 (0.0%) |
Housing Structure by Heating Type in Nelchina
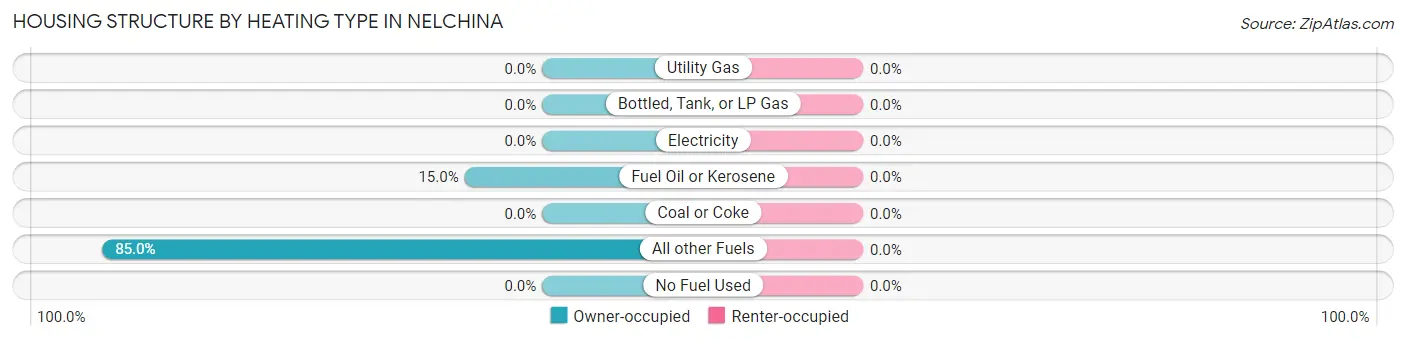
| Heating Type | Owner-occupied | Renter-occupied |
| Utility Gas | 0 (0.0%) | 0 (0.0%) |
| Bottled, Tank, or LP Gas | 0 (0.0%) | 0 (0.0%) |
| Electricity | 0 (0.0%) | 0 (0.0%) |
| Fuel Oil or Kerosene | 6 (15.0%) | 0 (0.0%) |
| Coal or Coke | 0 (0.0%) | 0 (0.0%) |
| All other Fuels | 34 (85.0%) | 0 (0.0%) |
| No Fuel Used | 0 (0.0%) | 0 (0.0%) |
| Total | 40 (100.0%) | 0 (0.0%) |
Household Vehicle Usage in Nelchina
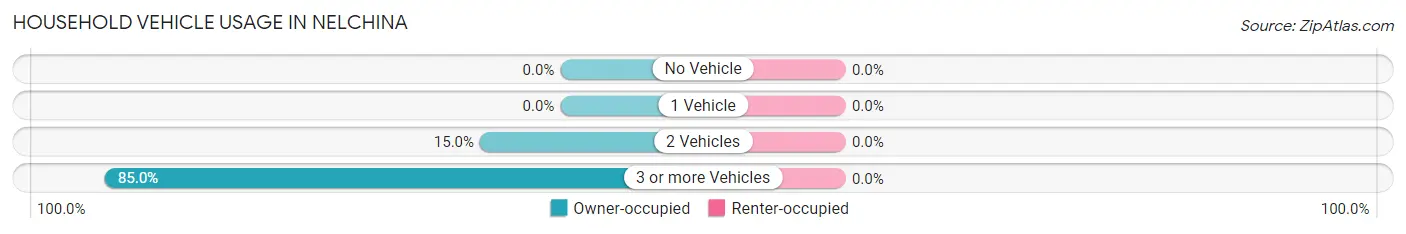
| Vehicles per Household | Owner-occupied | Renter-occupied |
| No Vehicle | 0 (0.0%) | 0 (0.0%) |
| 1 Vehicle | 0 (0.0%) | 0 (0.0%) |
| 2 Vehicles | 6 (15.0%) | 0 (0.0%) |
| 3 or more Vehicles | 34 (85.0%) | 0 (0.0%) |
| Total | 40 (100.0%) | 0 (0.0%) |
Real Estate & Mortgages in Nelchina
Real Estate and Mortgage Overview in Nelchina
| Characteristic | Without Mortgage | With Mortgage |
| Housing Units | 6 | 34 |
| Median Property Value | - | - |
| Median Household Income | - | - |
| Monthly Housing Costs | - | - |
| Real Estate Taxes | - | - |
Property Value by Mortgage Status in Nelchina
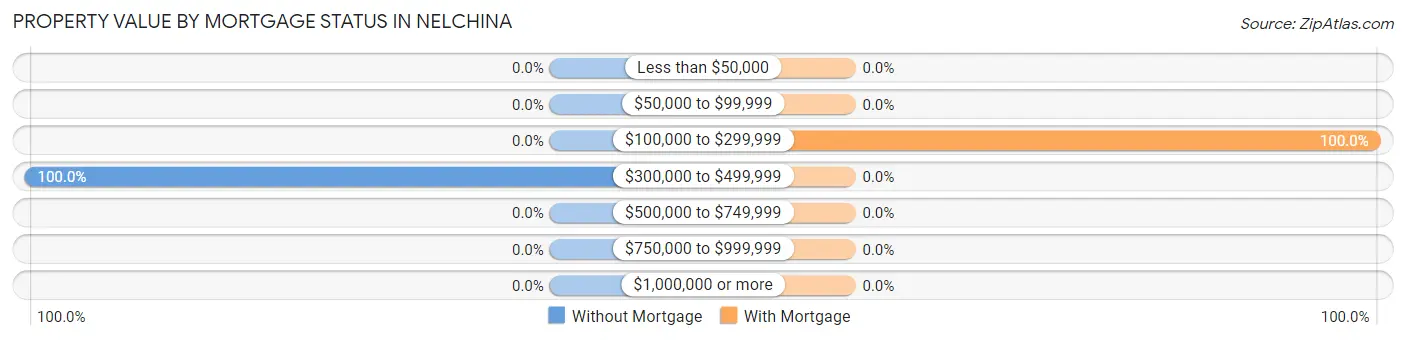
| Property Value | Without Mortgage | With Mortgage |
| Less than $50,000 | 0 (0.0%) | 0 (0.0%) |
| $50,000 to $99,999 | 0 (0.0%) | 0 (0.0%) |
| $100,000 to $299,999 | 0 (0.0%) | 34 (100.0%) |
| $300,000 to $499,999 | 6 (100.0%) | 0 (0.0%) |
| $500,000 to $749,999 | 0 (0.0%) | 0 (0.0%) |
| $750,000 to $999,999 | 0 (0.0%) | 0 (0.0%) |
| $1,000,000 or more | 0 (0.0%) | 0 (0.0%) |
| Total | 6 (100.0%) | 34 (100.0%) |
Household Income by Mortgage Status in Nelchina
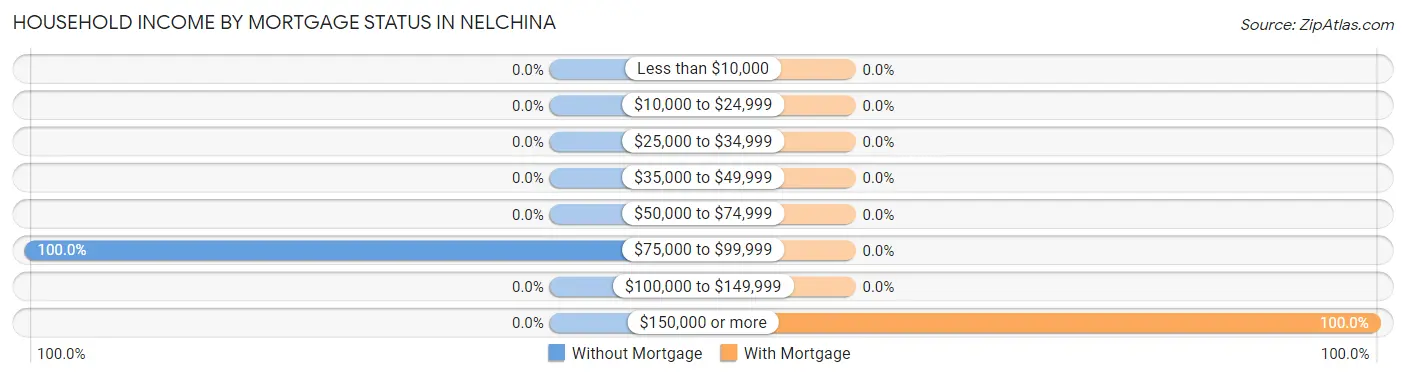
| Household Income | Without Mortgage | With Mortgage |
| Less than $10,000 | 0 (0.0%) | 0 (0.0%) |
| $10,000 to $24,999 | 0 (0.0%) | 0 (0.0%) |
| $25,000 to $34,999 | 0 (0.0%) | 0 (0.0%) |
| $35,000 to $49,999 | 0 (0.0%) | 0 (0.0%) |
| $50,000 to $74,999 | 0 (0.0%) | 0 (0.0%) |
| $75,000 to $99,999 | 6 (100.0%) | 0 (0.0%) |
| $100,000 to $149,999 | 0 (0.0%) | 0 (0.0%) |
| $150,000 or more | 0 (0.0%) | 34 (100.0%) |
| Total | 6 (100.0%) | 34 (100.0%) |
Property Value to Household Income Ratio in Nelchina
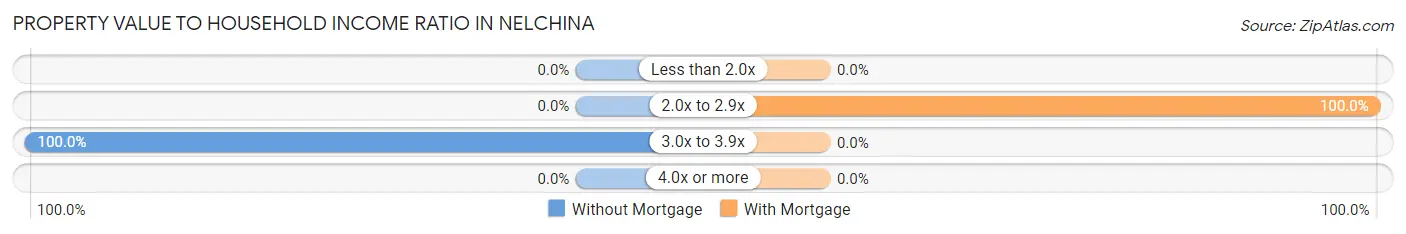
| Value-to-Income Ratio | Without Mortgage | With Mortgage |
| Less than 2.0x | 0 (0.0%) | 0 (0.0%) |
| 2.0x to 2.9x | 0 (0.0%) | 34 (100.0%) |
| 3.0x to 3.9x | 6 (100.0%) | 0 (0.0%) |
| 4.0x or more | 0 (0.0%) | 0 (0.0%) |
| Total | 6 (100.0%) | 34 (100.0%) |
Real Estate Taxes by Mortgage Status in Nelchina
| Property Taxes | Without Mortgage | With Mortgage |
| Less than $800 | 0 (0.0%) | 0 (0.0%) |
| $800 to $1,499 | 0 (0.0%) | 0 (0.0%) |
| $800 to $1,499 | 0 (0.0%) | 0 (0.0%) |
| Total | 6 (100.0%) | 34 (100.0%) |
Health & Disability in Nelchina
Health Insurance Coverage by Age in Nelchina
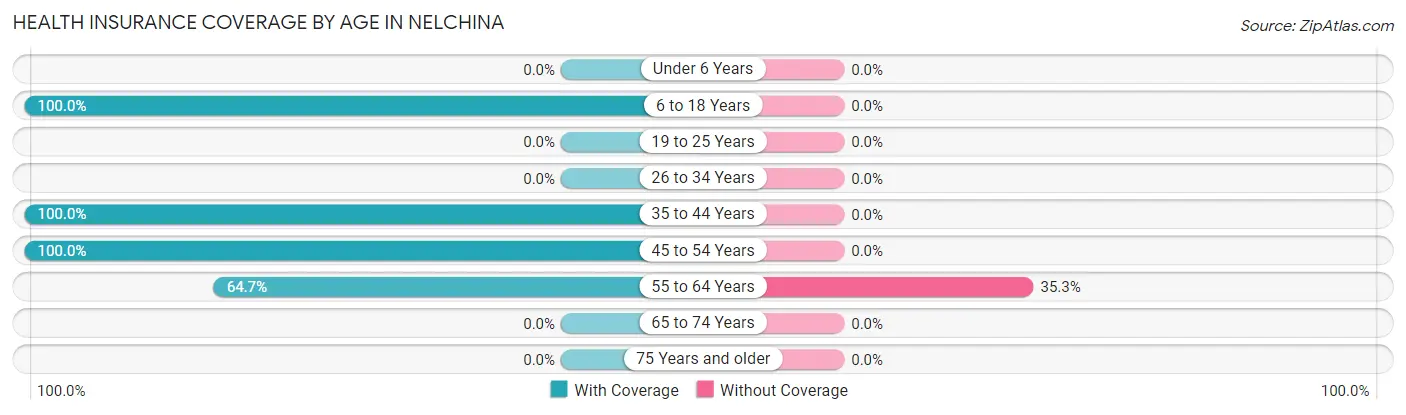
| Age Bracket | With Coverage | Without Coverage |
| Under 6 Years | 0 (0.0%) | 0 (0.0%) |
| 6 to 18 Years | 44 (100.0%) | 0 (0.0%) |
| 19 to 25 Years | 0 (0.0%) | 0 (0.0%) |
| 26 to 34 Years | 0 (0.0%) | 0 (0.0%) |
| 35 to 44 Years | 40 (100.0%) | 0 (0.0%) |
| 45 to 54 Years | 34 (100.0%) | 0 (0.0%) |
| 55 to 64 Years | 11 (64.7%) | 6 (35.3%) |
| 65 to 74 Years | 0 (0.0%) | 0 (0.0%) |
| 75 Years and older | 0 (0.0%) | 0 (0.0%) |
| Total | 129 (95.6%) | 6 (4.4%) |
Health Insurance Coverage by Citizenship Status in Nelchina
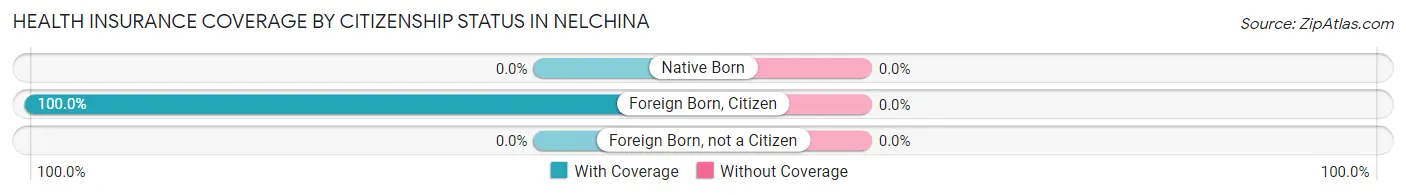
| Citizenship Status | With Coverage | Without Coverage |
| Native Born | 0 (0.0%) | 0 (0.0%) |
| Foreign Born, Citizen | 44 (100.0%) | 0 (0.0%) |
| Foreign Born, not a Citizen | 0 (0.0%) | 0 (0.0%) |
Health Insurance Coverage by Household Income in Nelchina
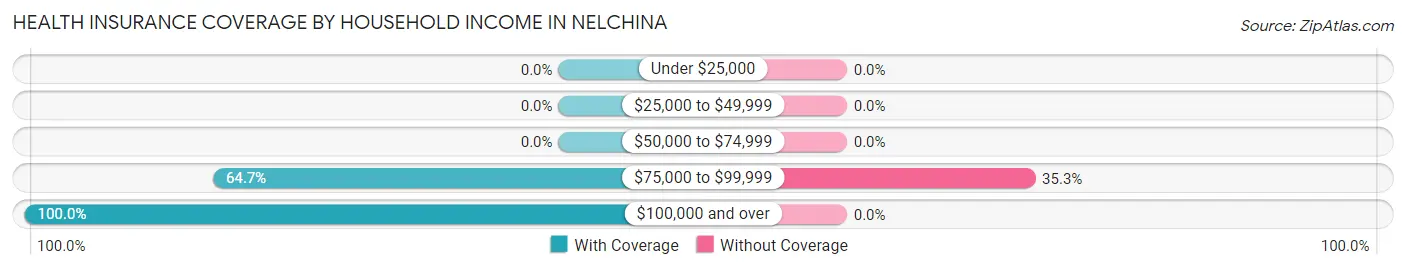
| Household Income | With Coverage | Without Coverage |
| Under $25,000 | 0 (0.0%) | 0 (0.0%) |
| $25,000 to $49,999 | 0 (0.0%) | 0 (0.0%) |
| $50,000 to $74,999 | 0 (0.0%) | 0 (0.0%) |
| $75,000 to $99,999 | 11 (64.7%) | 6 (35.3%) |
| $100,000 and over | 118 (100.0%) | 0 (0.0%) |
Public vs Private Health Insurance Coverage by Age in Nelchina
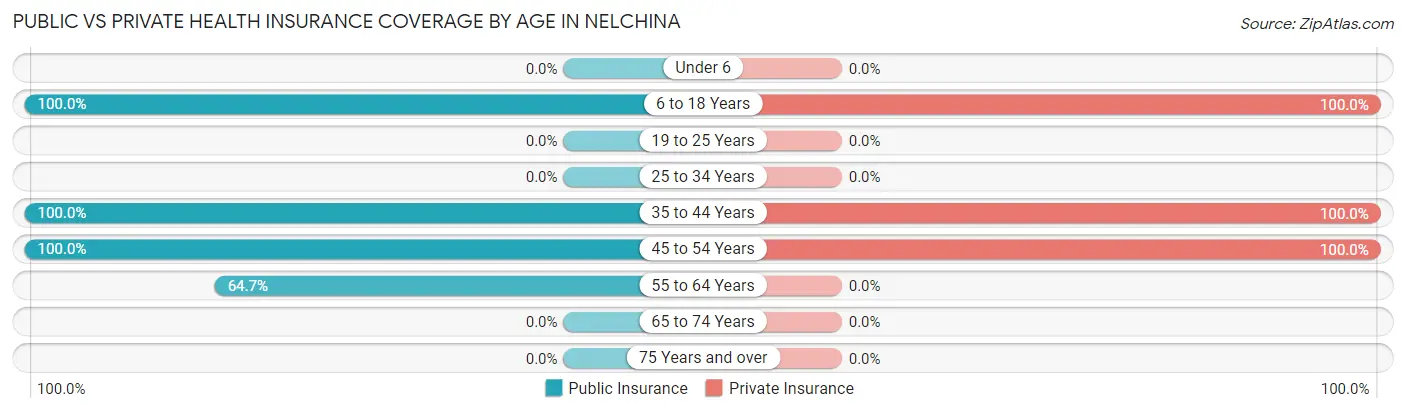
| Age Bracket | Public Insurance | Private Insurance |
| Under 6 | 0 (0.0%) | 0 (0.0%) |
| 6 to 18 Years | 44 (100.0%) | 44 (100.0%) |
| 19 to 25 Years | 0 (0.0%) | 0 (0.0%) |
| 25 to 34 Years | 0 (0.0%) | 0 (0.0%) |
| 35 to 44 Years | 40 (100.0%) | 40 (100.0%) |
| 45 to 54 Years | 34 (100.0%) | 34 (100.0%) |
| 55 to 64 Years | 11 (64.7%) | 0 (0.0%) |
| 65 to 74 Years | 0 (0.0%) | 0 (0.0%) |
| 75 Years and over | 0 (0.0%) | 0 (0.0%) |
| Total | 129 (95.6%) | 118 (87.4%) |
Disability Status by Sex by Age in Nelchina
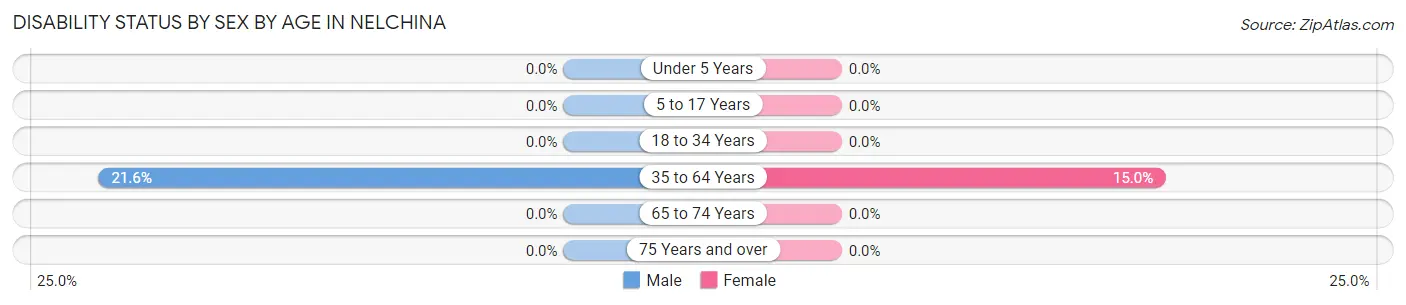
| Age Bracket | Male | Female |
| Under 5 Years | 0 (0.0%) | 0 (0.0%) |
| 5 to 17 Years | 0 (0.0%) | 0 (0.0%) |
| 18 to 34 Years | 0 (0.0%) | 0 (0.0%) |
| 35 to 64 Years | 11 (21.6%) | 6 (15.0%) |
| 65 to 74 Years | 0 (0.0%) | 0 (0.0%) |
| 75 Years and over | 0 (0.0%) | 0 (0.0%) |
Disability Class by Sex by Age in Nelchina
Disability Class: Hearing Difficulty
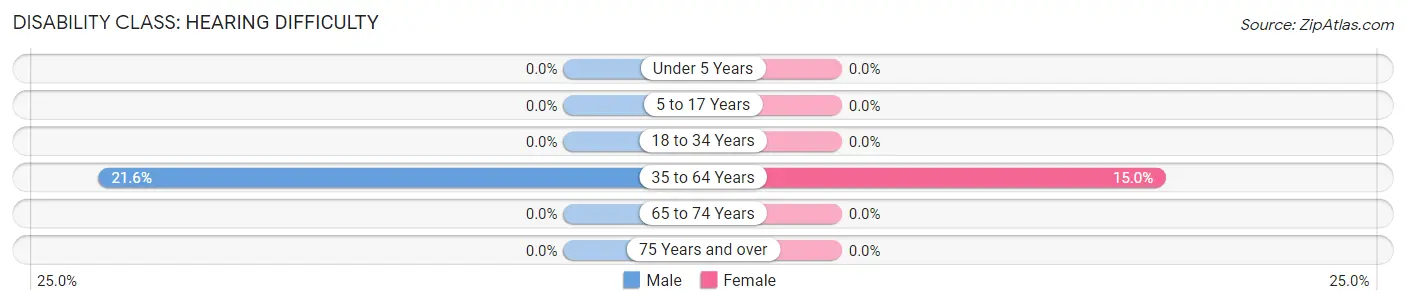
| Age Bracket | Male | Female |
| Under 5 Years | 0 (0.0%) | 0 (0.0%) |
| 5 to 17 Years | 0 (0.0%) | 0 (0.0%) |
| 18 to 34 Years | 0 (0.0%) | 0 (0.0%) |
| 35 to 64 Years | 11 (21.6%) | 6 (15.0%) |
| 65 to 74 Years | 0 (0.0%) | 0 (0.0%) |
| 75 Years and over | 0 (0.0%) | 0 (0.0%) |
Disability Class: Vision Difficulty
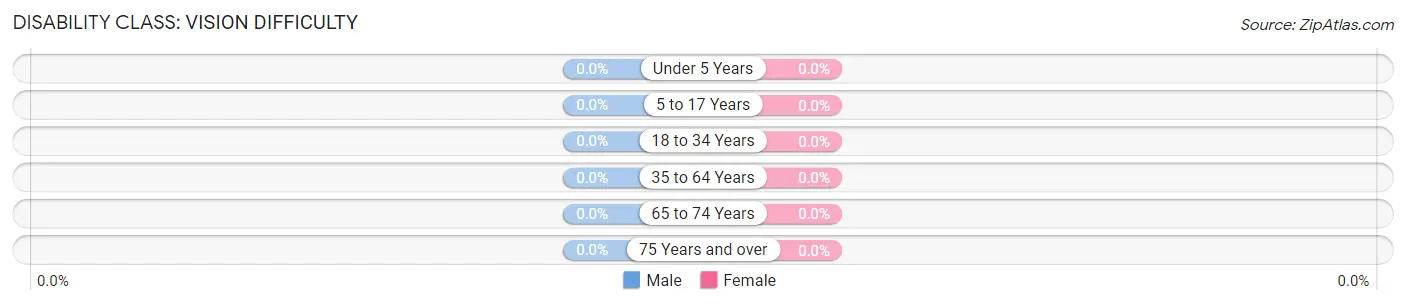
| Age Bracket | Male | Female |
| Under 5 Years | 0 (0.0%) | 0 (0.0%) |
| 5 to 17 Years | 0 (0.0%) | 0 (0.0%) |
| 18 to 34 Years | 0 (0.0%) | 0 (0.0%) |
| 35 to 64 Years | 0 (0.0%) | 0 (0.0%) |
| 65 to 74 Years | 0 (0.0%) | 0 (0.0%) |
| 75 Years and over | 0 (0.0%) | 0 (0.0%) |
Disability Class: Cognitive Difficulty
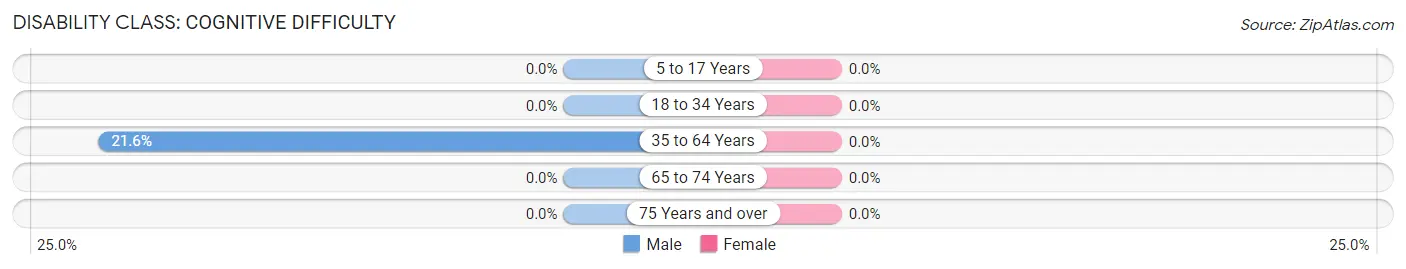
| Age Bracket | Male | Female |
| 5 to 17 Years | 0 (0.0%) | 0 (0.0%) |
| 18 to 34 Years | 0 (0.0%) | 0 (0.0%) |
| 35 to 64 Years | 11 (21.6%) | 0 (0.0%) |
| 65 to 74 Years | 0 (0.0%) | 0 (0.0%) |
| 75 Years and over | 0 (0.0%) | 0 (0.0%) |
Disability Class: Ambulatory Difficulty
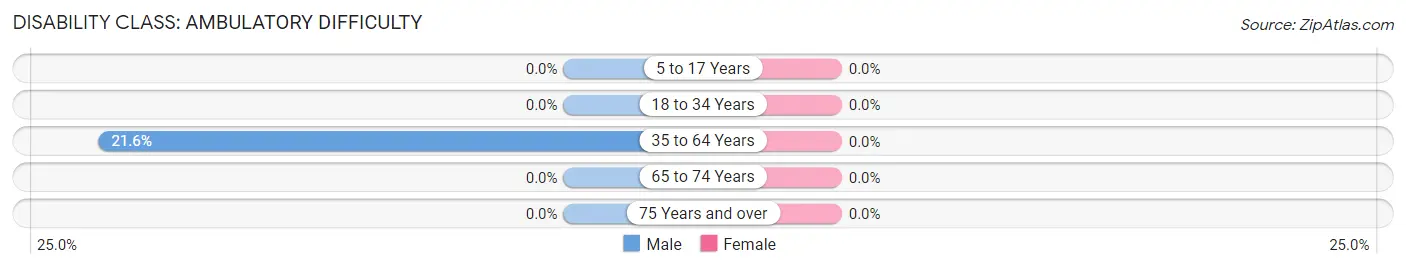
| Age Bracket | Male | Female |
| 5 to 17 Years | 0 (0.0%) | 0 (0.0%) |
| 18 to 34 Years | 0 (0.0%) | 0 (0.0%) |
| 35 to 64 Years | 11 (21.6%) | 0 (0.0%) |
| 65 to 74 Years | 0 (0.0%) | 0 (0.0%) |
| 75 Years and over | 0 (0.0%) | 0 (0.0%) |
Disability Class: Self-Care Difficulty
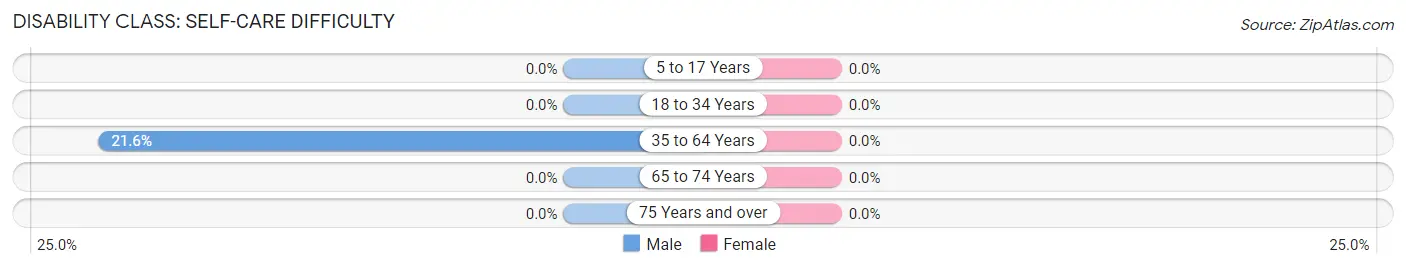
| Age Bracket | Male | Female |
| 5 to 17 Years | 0 (0.0%) | 0 (0.0%) |
| 18 to 34 Years | 0 (0.0%) | 0 (0.0%) |
| 35 to 64 Years | 11 (21.6%) | 0 (0.0%) |
| 65 to 74 Years | 0 (0.0%) | 0 (0.0%) |
| 75 Years and over | 0 (0.0%) | 0 (0.0%) |
Technology Access in Nelchina
Computing Device Access in Nelchina
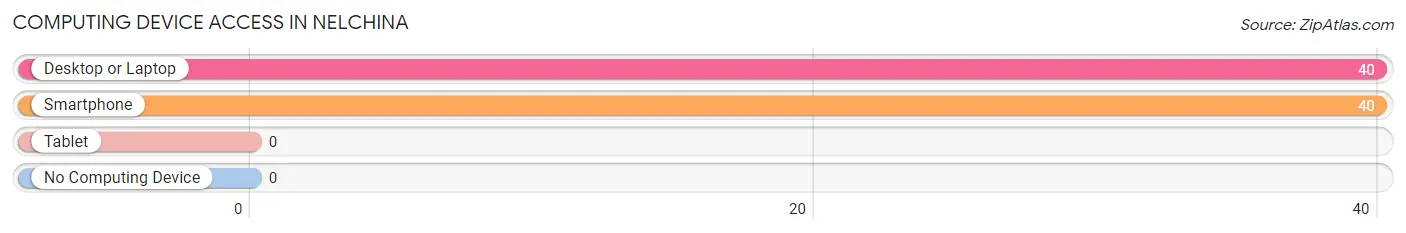
| Device Type | # Households | % Households |
| Desktop or Laptop | 40 | 100.0% |
| Smartphone | 40 | 100.0% |
| Tablet | 0 | 0.0% |
| No Computing Device | 0 | 0.0% |
| Total | 40 | 100.0% |
Internet Access in Nelchina
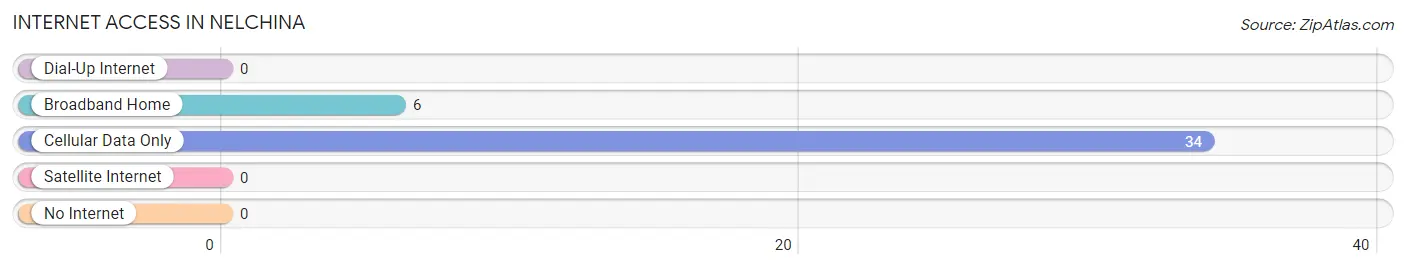
| Internet Type | # Households | % Households |
| Dial-Up Internet | 0 | 0.0% |
| Broadband Home | 6 | 15.0% |
| Cellular Data Only | 34 | 85.0% |
| Satellite Internet | 0 | 0.0% |
| No Internet | 0 | 0.0% |
| Total | 40 | 100.0% |
Nelchina Summary
Nelchina, Alaska is a small unincorporated community located in the Copper River Valley of the Chugach Mountains in the south-central part of the state. It is situated on the banks of the Nelchina River, approximately 40 miles east of Glennallen and about 100 miles northeast of Anchorage. The community is home to approximately 200 people, most of whom are of Athabascan descent.
History
The Nelchina area has been inhabited by the Ahtna Athabascan people for thousands of years. The name “Nelchina” is derived from the Ahtna word “Nelch’in”, which means “river of the people”. The area was first explored by Europeans in the late 19th century, when prospectors and miners began to arrive in search of gold and other minerals. The first permanent settlement in the area was established in the early 1900s, when a trading post was built at the confluence of the Nelchina and Copper Rivers.
The area was opened to homesteading in the early 1920s, and many of the original settlers were of Athabascan descent. The community was officially incorporated in 1945, and the population grew steadily throughout the mid-20th century. In the late 1970s, the Alaska Native Claims Settlement Act (ANCSA) was passed, which allowed for the formation of Native Corporations in Alaska. The Nelchina Native Corporation was formed in 1981, and it has since become the largest employer in the area.
Geography
Nelchina is located in the Copper River Valley of the Chugach Mountains in south-central Alaska. The community is situated on the banks of the Nelchina River, approximately 40 miles east of Glennallen and about 100 miles northeast of Anchorage. The area is characterized by rugged mountains, deep valleys, and numerous rivers and streams. The climate is generally cold and dry, with temperatures ranging from -20°F in the winter to 70°F in the summer.
Economy
The economy of Nelchina is largely based on subsistence activities, such as hunting, fishing, and gathering. The Nelchina Native Corporation is the largest employer in the area, and it operates a number of businesses, including a sawmill, a fish processing plant, and a general store. The corporation also owns and manages a large tract of land in the area, which is used for timber harvesting and other activities. Other local businesses include a gas station, a restaurant, and a small grocery store.
Demographics
As of the 2010 census, the population of Nelchina was estimated to be approximately 200 people. The majority of the population is of Athabascan descent, and the primary language spoken is Ahtna. The median household income is approximately $50,000, and the median age is 35. The unemployment rate is relatively low, at around 5%.
Conclusion
Nelchina, Alaska is a small unincorporated community located in the Copper River Valley of the Chugach Mountains in south-central Alaska. It has a long history of settlement by the Ahtna Athabascan people, and it has been home to a diverse population for many years. The economy of Nelchina is largely based on subsistence activities, and the Nelchina Native Corporation is the largest employer in the area. The population of Nelchina is estimated to be approximately 200 people, and the majority of the population is of Athabascan descent.
Common Questions
What is Per Capita Income in Nelchina?
Per Capita income in Nelchina is $45,579.
What is Inequality or Gini Index in Nelchina?
Inequality or Gini Index in Nelchina is 0.04.
What is the Total Population of Nelchina?
Total Population of Nelchina is 135.
What is the Total Male Population of Nelchina?
Total Male Population of Nelchina is 68.
What is the Total Female Population of Nelchina?
Total Female Population of Nelchina is 67.
What is the Ratio of Males per 100 Females in Nelchina?
There are 101.49 Males per 100 Females in Nelchina.
What is the Ratio of Females per 100 Males in Nelchina?
There are 98.53 Females per 100 Males in Nelchina.
What is the Median Population Age in Nelchina?
Median Population Age in Nelchina is 39.6 Years.
What is the Average Family Size in Nelchina
Average Family Size in Nelchina is 3.4 People.
What is the Average Household Size in Nelchina
Average Household Size in Nelchina is 3.4 People.
How Large is the Labor Force in Nelchina?
There are 46 People in the Labor Forcein in Nelchina.
What is the Percentage of People in the Labor Force in Nelchina?
50.5% of People are in the Labor Force in Nelchina.