Zip Codes with the Highest Percentage of Households with Income Above $200,000 in Seattle, WA
RELATED REPORTS & OPTIONS
Household Income | $200k+
Seattle
Compare Zip Codes
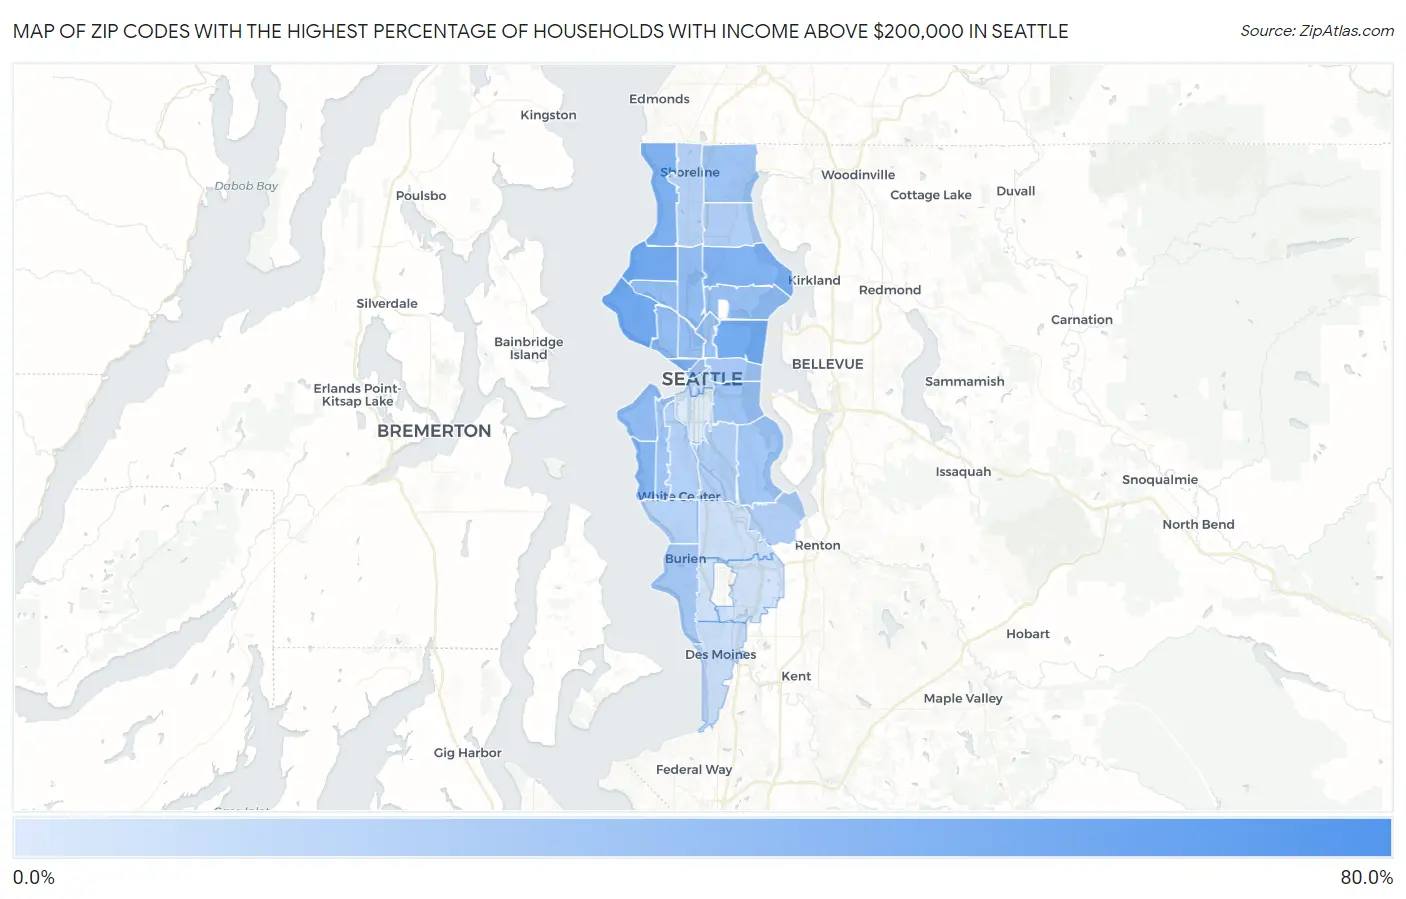
Map of Zip Codes with the Highest Percentage of Households with Income Above $200,000 in Seattle
3.2%
60.4%
Zip Codes with the Highest Percentage of Households with Income Above $200,000 in Seattle, WA
| Zip Code | Households with Income > $200k | vs State | vs National | |
| 1. | 98164 | 60.4% | 15.4%(+45.0)#3 | 11.4%(+49.0)#114 |
| 2. | 98117 | 41.3% | 15.4%(+25.9)#13 | 11.4%(+29.9)#581 |
| 3. | 98199 | 40.8% | 15.4%(+25.4)#14 | 11.4%(+29.4)#611 |
| 4. | 98112 | 40.2% | 15.4%(+24.8)#15 | 11.4%(+28.8)#639 |
| 5. | 98115 | 35.4% | 15.4%(+20.0)#27 | 11.4%(+24.0)#947 |
| 6. | 98177 | 35.2% | 15.4%(+19.8)#28 | 11.4%(+23.8)#964 |
| 7. | 98121 | 35.0% | 15.4%(+19.6)#30 | 11.4%(+23.6)#978 |
| 8. | 98136 | 32.5% | 15.4%(+17.1)#34 | 11.4%(+21.1)#1,209 |
| 9. | 98116 | 29.4% | 15.4%(+14.0)#41 | 11.4%(+18.0)#1,531 |
| 10. | 98103 | 28.4% | 15.4%(+13.0)#43 | 11.4%(+17.0)#1,660 |
| 11. | 98119 | 28.4% | 15.4%(+13.0)#44 | 11.4%(+17.0)#1,666 |
| 12. | 98107 | 28.1% | 15.4%(+12.7)#47 | 11.4%(+16.7)#1,704 |
| 13. | 98109 | 27.5% | 15.4%(+12.1)#50 | 11.4%(+16.1)#1,795 |
| 14. | 98105 | 26.9% | 15.4%(+11.5)#52 | 11.4%(+15.5)#1,891 |
| 15. | 98102 | 25.6% | 15.4%(+10.2)#57 | 11.4%(+14.2)#2,082 |
| 16. | 98155 | 24.2% | 15.4%(+8.80)#61 | 11.4%(+12.8)#2,330 |
| 17. | 98144 | 24.2% | 15.4%(+8.80)#62 | 11.4%(+12.8)#2,331 |
| 18. | 98101 | 24.2% | 15.4%(+8.80)#63 | 11.4%(+12.8)#2,335 |
| 19. | 98126 | 22.8% | 15.4%(+7.40)#68 | 11.4%(+11.4)#2,604 |
| 20. | 98118 | 22.5% | 15.4%(+7.10)#69 | 11.4%(+11.1)#2,674 |
| 21. | 98122 | 21.7% | 15.4%(+6.30)#72 | 11.4%(+10.3)#2,841 |
| 22. | 98166 | 21.1% | 15.4%(+5.70)#75 | 11.4%(+9.70)#2,999 |
| 23. | 98178 | 18.1% | 15.4%(+2.70)#94 | 11.4%(+6.70)#3,814 |
| 24. | 98125 | 17.9% | 15.4%(+2.50)#97 | 11.4%(+6.50)#3,871 |
| 25. | 98108 | 17.4% | 15.4%(+2.00)#99 | 11.4%(+6.00)#4,040 |
| 26. | 98106 | 16.5% | 15.4%(+1.10)#105 | 11.4%(+5.10)#4,373 |
| 27. | 98146 | 16.2% | 15.4%(+0.800)#109 | 11.4%(+4.80)#4,485 |
| 28. | 98133 | 15.7% | 15.4%(+0.300)#115 | 11.4%(+4.30)#4,681 |
| 29. | 98104 | 9.9% | 15.4%(-5.50)#222 | 11.4%(-1.50)#8,363 |
| 30. | 98198 | 9.2% | 15.4%(-6.20)#243 | 11.4%(-2.20)#9,032 |
| 31. | 98168 | 8.1% | 15.4%(-7.30)#273 | 11.4%(-3.30)#10,227 |
| 32. | 98148 | 6.9% | 15.4%(-8.50)#313 | 11.4%(-4.50)#11,945 |
| 33. | 98188 | 6.6% | 15.4%(-8.80)#326 | 11.4%(-4.80)#12,410 |
| 34. | 98134 | 3.2% | 15.4%(-12.2)#438 | 11.4%(-8.20)#20,506 |
1
Common Questions
What are the Top 10 Zip Codes with the Highest Percentage of Households with Income Above $200,000 in Seattle, WA?
Top 10 Zip Codes with the Highest Percentage of Households with Income Above $200,000 in Seattle, WA are:
What zip code has the Highest Percentage of Households with Income Above $200,000 in Seattle, WA?
98164 has the Highest Percentage of Households with Income Above $200,000 in Seattle, WA with 60.4%.
What is the Percentage of Households with Income Above $200,000 in Seattle, WA?
Percentage of Households with Income Above $200,000 in Seattle is 27.0%.
What is the Percentage of Households with Income Above $200,000 in Washington?
Percentage of Households with Income Above $200,000 in Washington is 15.4%.
What is the Percentage of Households with Income Above $200,000 in the United States?
Percentage of Households with Income Above $200,000 in the United States is 11.4%.