Zip Codes with the Highest Percentage of Households with Income Above $200,000 in Sammamish, WA
RELATED REPORTS & OPTIONS
Household Income | $200k+
Sammamish
Compare Zip Codes
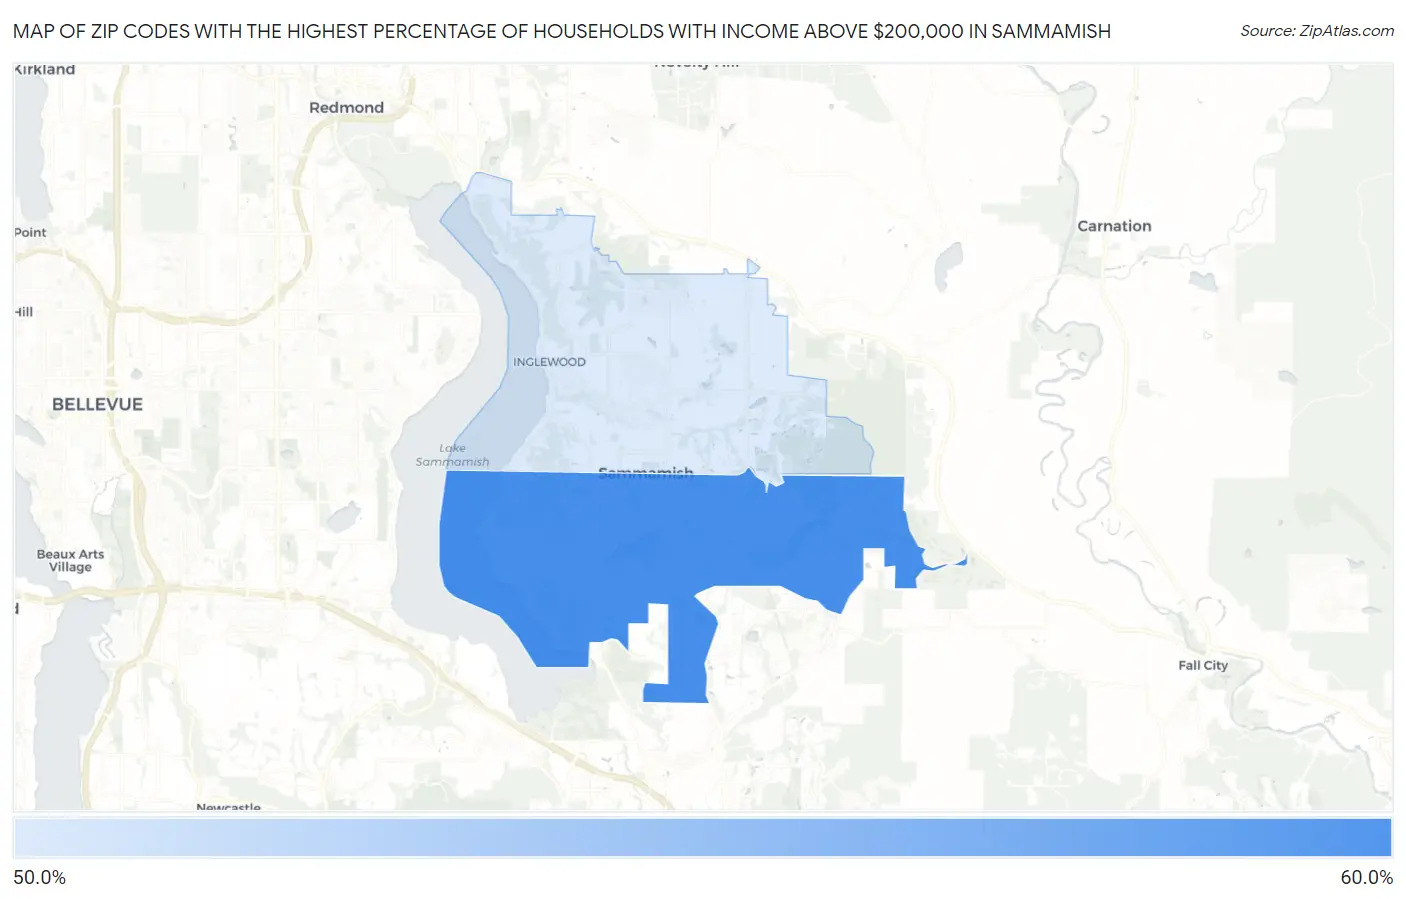
Map of Zip Codes with the Highest Percentage of Households with Income Above $200,000 in Sammamish
56.0%
60.0%
Zip Codes with the Highest Percentage of Households with Income Above $200,000 in Sammamish, WA
| Zip Code | Households with Income > $200k | vs State | vs National | |
| 1. | 98075 | 60.0% | 15.4%(+44.6)#4 | 11.4%(+48.6)#116 |
| 2. | 98074 | 56.0% | 15.4%(+40.6)#6 | 11.4%(+44.6)#159 |
1
Common Questions
What are the Top Zip Codes with the Highest Percentage of Households with Income Above $200,000 in Sammamish, WA?
Top Zip Codes with the Highest Percentage of Households with Income Above $200,000 in Sammamish, WA are:
What zip code has the Highest Percentage of Households with Income Above $200,000 in Sammamish, WA?
98075 has the Highest Percentage of Households with Income Above $200,000 in Sammamish, WA with 60.0%.
What is the Percentage of Households with Income Above $200,000 in Sammamish, WA?
Percentage of Households with Income Above $200,000 in Sammamish is 54.0%.
What is the Percentage of Households with Income Above $200,000 in Washington?
Percentage of Households with Income Above $200,000 in Washington is 15.4%.
What is the Percentage of Households with Income Above $200,000 in the United States?
Percentage of Households with Income Above $200,000 in the United States is 11.4%.