Zip Codes with the Highest Percentage of Population with a Degree in Social Sciences in Seattle, WA
RELATED REPORTS & OPTIONS
Social Sciences
Seattle
Compare Zip Codes
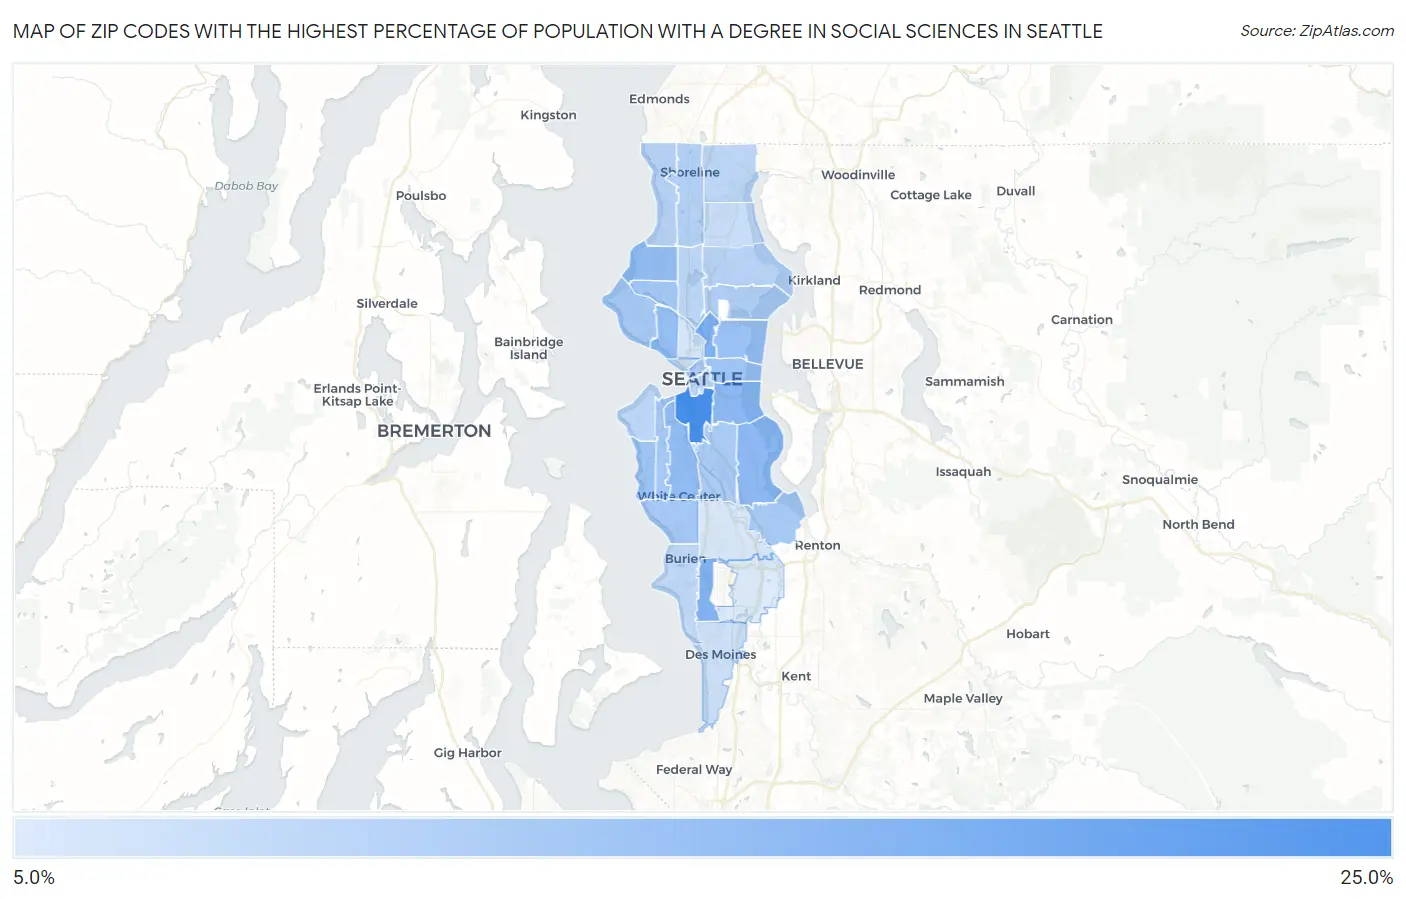
Map of Zip Codes with the Highest Percentage of Population with a Degree in Social Sciences in Seattle
8.5%
21.2%
Zip Codes with the Highest Percentage of Population with a Degree in Social Sciences in Seattle, WA
| Zip Code | % Graduates | vs State | vs National | |
| 1. | 98134 | 21.2% | 9.3%(+11.9)#15 | 8.1%(+13.1)#865 |
| 2. | 98102 | 16.3% | 9.3%(+6.96)#26 | 8.1%(+8.18)#1,571 |
| 3. | 98148 | 16.0% | 9.3%(+6.67)#29 | 8.1%(+7.90)#1,646 |
| 4. | 98118 | 15.2% | 9.3%(+5.89)#35 | 8.1%(+7.11)#1,891 |
| 5. | 98144 | 15.1% | 9.3%(+5.78)#37 | 8.1%(+7.00)#1,924 |
| 6. | 98106 | 14.7% | 9.3%(+5.41)#39 | 8.1%(+6.63)#2,059 |
| 7. | 98117 | 14.6% | 9.3%(+5.34)#41 | 8.1%(+6.57)#2,087 |
| 8. | 98119 | 14.3% | 9.3%(+4.99)#44 | 8.1%(+6.21)#2,244 |
| 9. | 98112 | 13.8% | 9.3%(+4.48)#48 | 8.1%(+5.70)#2,449 |
| 10. | 98136 | 13.6% | 9.3%(+4.27)#51 | 8.1%(+5.49)#2,561 |
| 11. | 98122 | 13.6% | 9.3%(+4.26)#52 | 8.1%(+5.48)#2,564 |
| 12. | 98107 | 13.2% | 9.3%(+3.91)#55 | 8.1%(+5.14)#2,726 |
| 13. | 98146 | 13.1% | 9.3%(+3.80)#56 | 8.1%(+5.03)#2,777 |
| 14. | 98199 | 13.0% | 9.3%(+3.69)#60 | 8.1%(+4.91)#2,839 |
| 15. | 98126 | 12.9% | 9.3%(+3.64)#62 | 8.1%(+4.86)#2,865 |
| 16. | 98178 | 12.7% | 9.3%(+3.45)#65 | 8.1%(+4.68)#2,979 |
| 17. | 98101 | 12.6% | 9.3%(+3.29)#70 | 8.1%(+4.52)#3,070 |
| 18. | 98108 | 12.5% | 9.3%(+3.25)#71 | 8.1%(+4.47)#3,095 |
| 19. | 98105 | 12.2% | 9.3%(+2.95)#77 | 8.1%(+4.18)#3,320 |
| 20. | 98133 | 11.7% | 9.3%(+2.36)#90 | 8.1%(+3.58)#3,777 |
| 21. | 98177 | 11.6% | 9.3%(+2.26)#96 | 8.1%(+3.48)#3,876 |
| 22. | 98115 | 11.5% | 9.3%(+2.21)#99 | 8.1%(+3.44)#3,911 |
| 23. | 98155 | 11.2% | 9.3%(+1.89)#107 | 8.1%(+3.11)#4,190 |
| 24. | 98104 | 11.1% | 9.3%(+1.81)#108 | 8.1%(+3.03)#4,292 |
| 25. | 98103 | 11.1% | 9.3%(+1.79)#109 | 8.1%(+3.02)#4,297 |
| 26. | 98116 | 11.0% | 9.3%(+1.74)#112 | 8.1%(+2.97)#4,343 |
| 27. | 98166 | 10.8% | 9.3%(+1.49)#126 | 8.1%(+2.72)#4,601 |
| 28. | 98125 | 10.2% | 9.3%(+0.915)#145 | 8.1%(+2.14)#5,290 |
| 29. | 98121 | 9.7% | 9.3%(+0.382)#165 | 8.1%(+1.60)#5,981 |
| 30. | 98198 | 9.6% | 9.3%(+0.278)#168 | 8.1%(+1.50)#6,121 |
| 31. | 98109 | 9.3% | 9.3%(+0.018)#177 | 8.1%(+1.24)#6,476 |
| 32. | 98164 | 9.1% | 9.3%(-0.154)#183 | 8.1%(+1.07)#6,725 |
| 33. | 98168 | 8.8% | 9.3%(-0.515)#202 | 8.1%(+0.708)#7,306 |
| 34. | 98188 | 8.5% | 9.3%(-0.801)#224 | 8.1%(+0.422)#7,822 |
1
Common Questions
What are the Top 10 Zip Codes with the Highest Percentage of Population with a Degree in Social Sciences in Seattle, WA?
Top 10 Zip Codes with the Highest Percentage of Population with a Degree in Social Sciences in Seattle, WA are:
What zip code has the Highest Percentage of Population with a Degree in Social Sciences in Seattle, WA?
98134 has the Highest Percentage of Population with a Degree in Social Sciences in Seattle, WA with 21.2%.
What is the Percentage of Population with a Degree in Social Sciences in Seattle, WA?
Percentage of Population with a Degree in Social Sciences in Seattle is 12.7%.
What is the Percentage of Population with a Degree in Social Sciences in Washington?
Percentage of Population with a Degree in Social Sciences in Washington is 9.3%.
What is the Percentage of Population with a Degree in Social Sciences in the United States?
Percentage of Population with a Degree in Social Sciences in the United States is 8.1%.