Zip Codes with the Most Immigrants from Eastern Asia in Seattle, WA
RELATED REPORTS & OPTIONS
Eastern Asia
Seattle
Compare Zip Codes
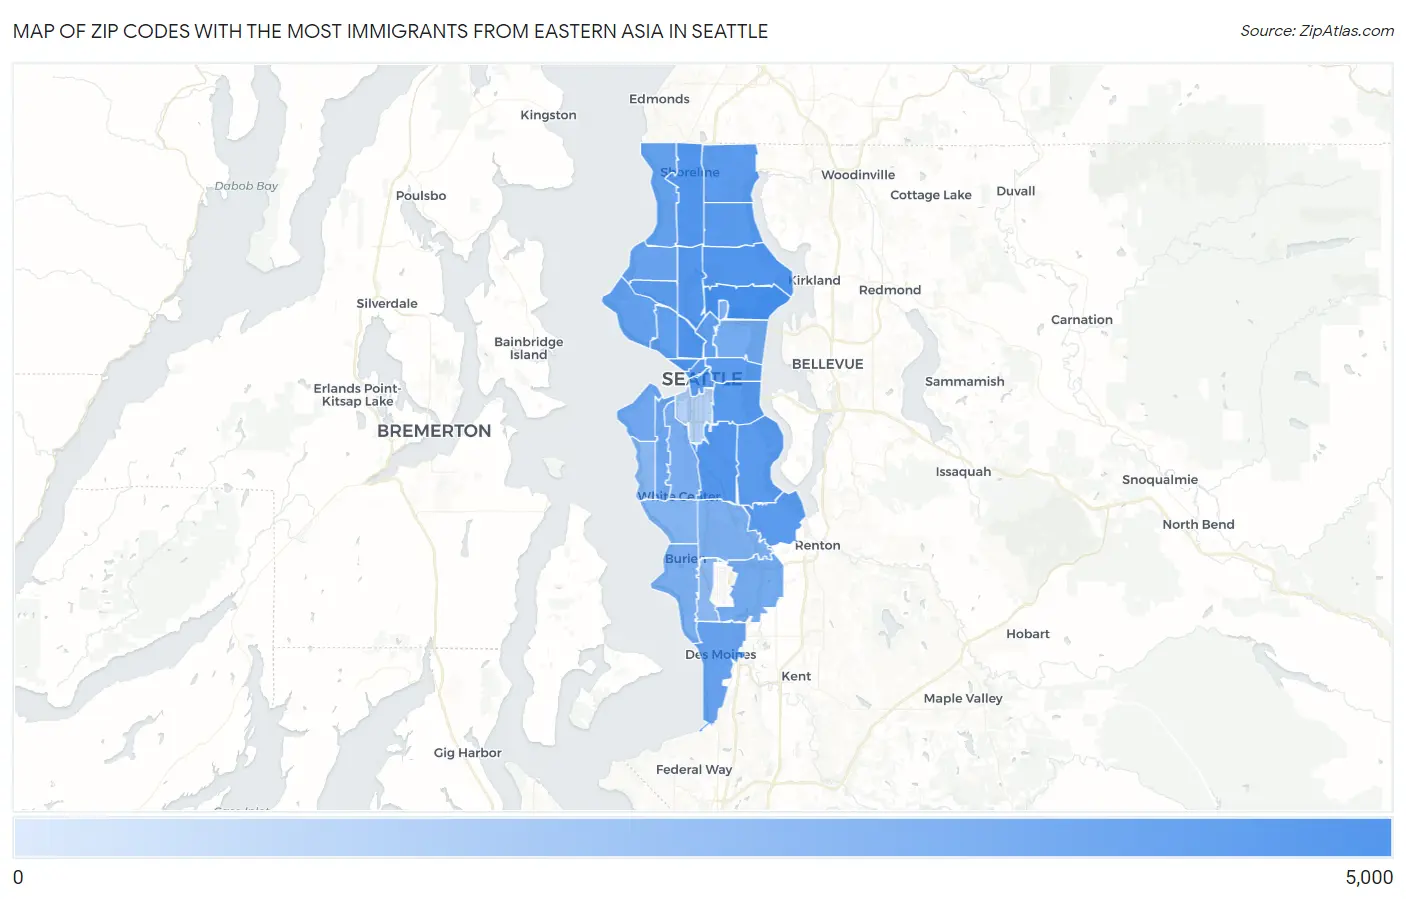
Map of Zip Codes with the Most Immigrants from Eastern Asia in Seattle
10
4,990
Zip Codes with the Most Immigrants from Eastern Asia in Seattle, WA
| Zip Code | Eastern Asia | vs State | vs National | |
| 1. | 98105 | 4,990 | 177,658(2.81%)#4 | 4,223,726(0.12%)#108 |
| 2. | 98109 | 2,899 | 177,658(1.63%)#7 | 4,223,726(0.07%)#246 |
| 3. | 98133 | 2,752 | 177,658(1.55%)#11 | 4,223,726(0.07%)#264 |
| 4. | 98115 | 2,719 | 177,658(1.53%)#13 | 4,223,726(0.06%)#271 |
| 5. | 98121 | 2,626 | 177,658(1.48%)#15 | 4,223,726(0.06%)#283 |
| 6. | 98108 | 2,417 | 177,658(1.36%)#19 | 4,223,726(0.06%)#325 |
| 7. | 98103 | 2,236 | 177,658(1.26%)#20 | 4,223,726(0.05%)#349 |
| 8. | 98125 | 2,005 | 177,658(1.13%)#25 | 4,223,726(0.05%)#409 |
| 9. | 98104 | 1,998 | 177,658(1.12%)#26 | 4,223,726(0.05%)#413 |
| 10. | 98144 | 1,901 | 177,658(1.07%)#31 | 4,223,726(0.05%)#441 |
| 11. | 98118 | 1,753 | 177,658(0.99%)#35 | 4,223,726(0.04%)#496 |
| 12. | 98101 | 1,735 | 177,658(0.98%)#36 | 4,223,726(0.04%)#505 |
| 13. | 98155 | 1,488 | 177,658(0.84%)#40 | 4,223,726(0.04%)#581 |
| 14. | 98178 | 1,479 | 177,658(0.83%)#41 | 4,223,726(0.04%)#584 |
| 15. | 98107 | 1,459 | 177,658(0.82%)#42 | 4,223,726(0.03%)#593 |
| 16. | 98122 | 1,449 | 177,658(0.82%)#43 | 4,223,726(0.03%)#597 |
| 17. | 98119 | 1,053 | 177,658(0.59%)#53 | 4,223,726(0.02%)#844 |
| 18. | 98102 | 1,015 | 177,658(0.57%)#54 | 4,223,726(0.02%)#873 |
| 19. | 98199 | 1,001 | 177,658(0.56%)#55 | 4,223,726(0.02%)#884 |
| 20. | 98177 | 910 | 177,658(0.51%)#58 | 4,223,726(0.02%)#975 |
| 21. | 98198 | 763 | 177,658(0.43%)#65 | 4,223,726(0.02%)#1,150 |
| 22. | 98117 | 716 | 177,658(0.40%)#68 | 4,223,726(0.02%)#1,235 |
| 23. | 98126 | 515 | 177,658(0.29%)#87 | 4,223,726(0.01%)#1,683 |
| 24. | 98116 | 479 | 177,658(0.27%)#89 | 4,223,726(0.01%)#1,798 |
| 25. | 98112 | 362 | 177,658(0.20%)#96 | 4,223,726(0.01%)#2,259 |
| 26. | 98188 | 355 | 177,658(0.20%)#97 | 4,223,726(0.01%)#2,285 |
| 27. | 98195 | 289 | 177,658(0.16%)#114 | 4,223,726(0.01%)#2,704 |
| 28. | 98106 | 286 | 177,658(0.16%)#115 | 4,223,726(0.01%)#2,720 |
| 29. | 98168 | 250 | 177,658(0.14%)#124 | 4,223,726(0.01%)#3,036 |
| 30. | 98166 | 243 | 177,658(0.14%)#127 | 4,223,726(0.01%)#3,123 |
| 31. | 98146 | 171 | 177,658(0.10%)#154 | 4,223,726(0.00%)#3,947 |
| 32. | 98136 | 127 | 177,658(0.07%)#168 | 4,223,726(0.00%)#4,766 |
| 33. | 98148 | 103 | 177,658(0.06%)#184 | 4,223,726(0.00%)#5,310 |
| 34. | 98134 | 10 | 177,658(0.01%)#301 | 4,223,726(0.00%)#11,195 |
1
Common Questions
What are the Top 10 Zip Codes with the Most Immigrants from Eastern Asia in Seattle, WA?
Top 10 Zip Codes with the Most Immigrants from Eastern Asia in Seattle, WA are:
What zip code has the Most Immigrants from Eastern Asia in Seattle, WA?
98105 has the Most Immigrants from Eastern Asia in Seattle, WA with 4,990.
What is the Total Immigrants from Eastern Asia in Seattle, WA?
Total Immigrants from Eastern Asia in Seattle is 38,430.
What is the Total Immigrants from Eastern Asia in Washington?
Total Immigrants from Eastern Asia in Washington is 177,658.
What is the Total Immigrants from Eastern Asia in the United States?
Total Immigrants from Eastern Asia in the United States is 4,223,726.