Zip Codes with the Highest Percentage of Population Employed in Firefighting & Prevention in Seattle, WA
RELATED REPORTS & OPTIONS
Firefighting & Prevention
Seattle
Compare Zip Codes
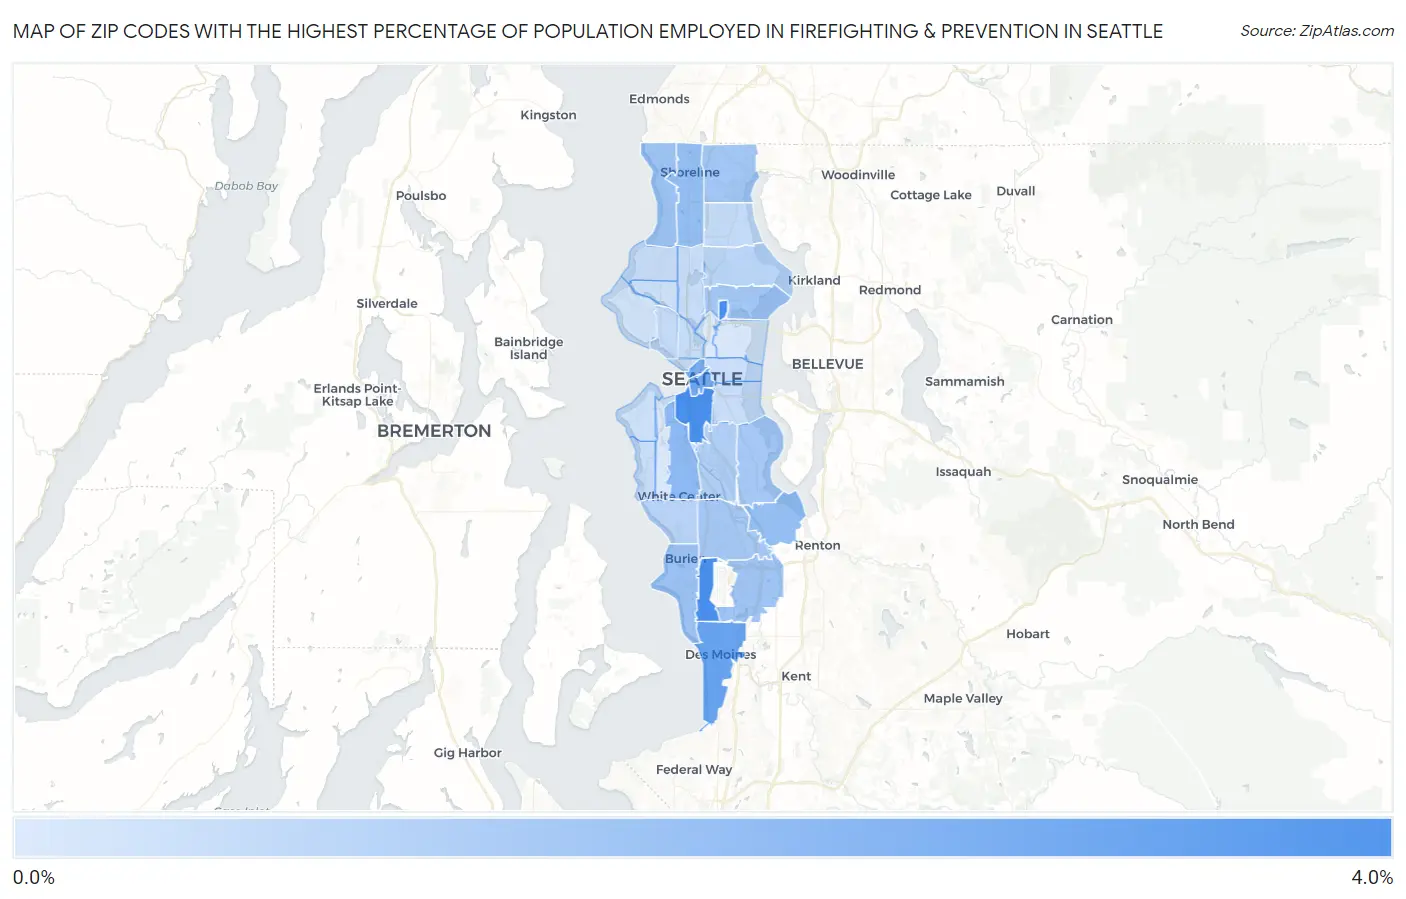
Map of Zip Codes with the Highest Percentage of Population Employed in Firefighting & Prevention in Seattle
0.065%
3.4%
Zip Codes with the Highest Percentage of Population Employed in Firefighting & Prevention in Seattle, WA
| Zip Code | % Employed | vs State | vs National | |
| 1. | 98195 | 3.4% | 1.1%(+2.25)#35 | 1.2%(+2.20)#1,824 |
| 2. | 98148 | 3.3% | 1.1%(+2.18)#36 | 1.2%(+2.13)#1,889 |
| 3. | 98134 | 3.3% | 1.1%(+2.18)#37 | 1.2%(+2.13)#1,890 |
| 4. | 98198 | 2.6% | 1.1%(+1.50)#60 | 1.2%(+1.45)#2,827 |
| 5. | 98104 | 2.4% | 1.1%(+1.24)#73 | 1.2%(+1.19)#3,383 |
| 6. | 98101 | 2.2% | 1.1%(+1.06)#86 | 1.2%(+1.01)#3,869 |
| 7. | 98106 | 1.8% | 1.1%(+0.638)#130 | 1.2%(+0.587)#5,485 |
| 8. | 98178 | 1.7% | 1.1%(+0.519)#139 | 1.2%(+0.468)#6,070 |
| 9. | 98133 | 1.7% | 1.1%(+0.517)#140 | 1.2%(+0.467)#6,075 |
| 10. | 98166 | 1.5% | 1.1%(+0.371)#156 | 1.2%(+0.321)#6,922 |
| 11. | 98177 | 1.4% | 1.1%(+0.300)#170 | 1.2%(+0.250)#7,397 |
| 12. | 98188 | 1.4% | 1.1%(+0.247)#175 | 1.2%(+0.197)#7,755 |
| 13. | 98155 | 1.3% | 1.1%(+0.189)#184 | 1.2%(+0.138)#8,162 |
| 14. | 98105 | 1.3% | 1.1%(+0.171)#188 | 1.2%(+0.121)#8,297 |
| 15. | 98118 | 1.3% | 1.1%(+0.145)#194 | 1.2%(+0.095)#8,499 |
| 16. | 98168 | 1.3% | 1.1%(+0.120)#200 | 1.2%(+0.070)#8,701 |
| 17. | 98108 | 1.0% | 1.1%(-0.106)#251 | 1.2%(-0.156)#10,788 |
| 18. | 98146 | 0.89% | 1.1%(-0.247)#277 | 1.2%(-0.297)#12,287 |
| 19. | 98115 | 0.83% | 1.1%(-0.309)#288 | 1.2%(-0.359)#12,896 |
| 20. | 98125 | 0.63% | 1.1%(-0.509)#334 | 1.2%(-0.559)#15,139 |
| 21. | 98119 | 0.61% | 1.1%(-0.521)#336 | 1.2%(-0.571)#15,257 |
| 22. | 98109 | 0.58% | 1.1%(-0.552)#342 | 1.2%(-0.602)#15,589 |
| 23. | 98144 | 0.54% | 1.1%(-0.595)#352 | 1.2%(-0.645)#16,060 |
| 24. | 98103 | 0.51% | 1.1%(-0.628)#361 | 1.2%(-0.678)#16,460 |
| 25. | 98117 | 0.50% | 1.1%(-0.635)#362 | 1.2%(-0.685)#16,541 |
| 26. | 98136 | 0.50% | 1.1%(-0.638)#364 | 1.2%(-0.688)#16,565 |
| 27. | 98122 | 0.47% | 1.1%(-0.663)#367 | 1.2%(-0.713)#16,855 |
| 28. | 98107 | 0.43% | 1.1%(-0.710)#378 | 1.2%(-0.760)#17,367 |
| 29. | 98121 | 0.42% | 1.1%(-0.719)#380 | 1.2%(-0.769)#17,455 |
| 30. | 98116 | 0.40% | 1.1%(-0.732)#386 | 1.2%(-0.782)#17,609 |
| 31. | 98199 | 0.32% | 1.1%(-0.818)#401 | 1.2%(-0.868)#18,562 |
| 32. | 98112 | 0.19% | 1.1%(-0.948)#413 | 1.2%(-0.998)#19,776 |
| 33. | 98126 | 0.19% | 1.1%(-0.949)#414 | 1.2%(-0.999)#19,787 |
| 34. | 98102 | 0.065% | 1.1%(-1.07)#420 | 1.2%(-1.12)#20,462 |
1
Common Questions
What are the Top 10 Zip Codes with the Highest Percentage of Population Employed in Firefighting & Prevention in Seattle, WA?
Top 10 Zip Codes with the Highest Percentage of Population Employed in Firefighting & Prevention in Seattle, WA are:
What zip code has the Highest Percentage of Population Employed in Firefighting & Prevention in Seattle, WA?
98195 has the Highest Percentage of Population Employed in Firefighting & Prevention in Seattle, WA with 3.4%.
What is the Percentage of Population Employed in Firefighting & Prevention in Seattle, WA?
Percentage of Population Employed in Firefighting & Prevention in Seattle is 0.74%.
What is the Percentage of Population Employed in Firefighting & Prevention in Washington?
Percentage of Population Employed in Firefighting & Prevention in Washington is 1.1%.
What is the Percentage of Population Employed in Firefighting & Prevention in the United States?
Percentage of Population Employed in Firefighting & Prevention in the United States is 1.2%.