Zip Codes with the Highest Percentage of Households with Income Below $10,000 in Seattle, WA
RELATED REPORTS & OPTIONS
Household Income | $0-10k
Seattle
Compare Zip Codes
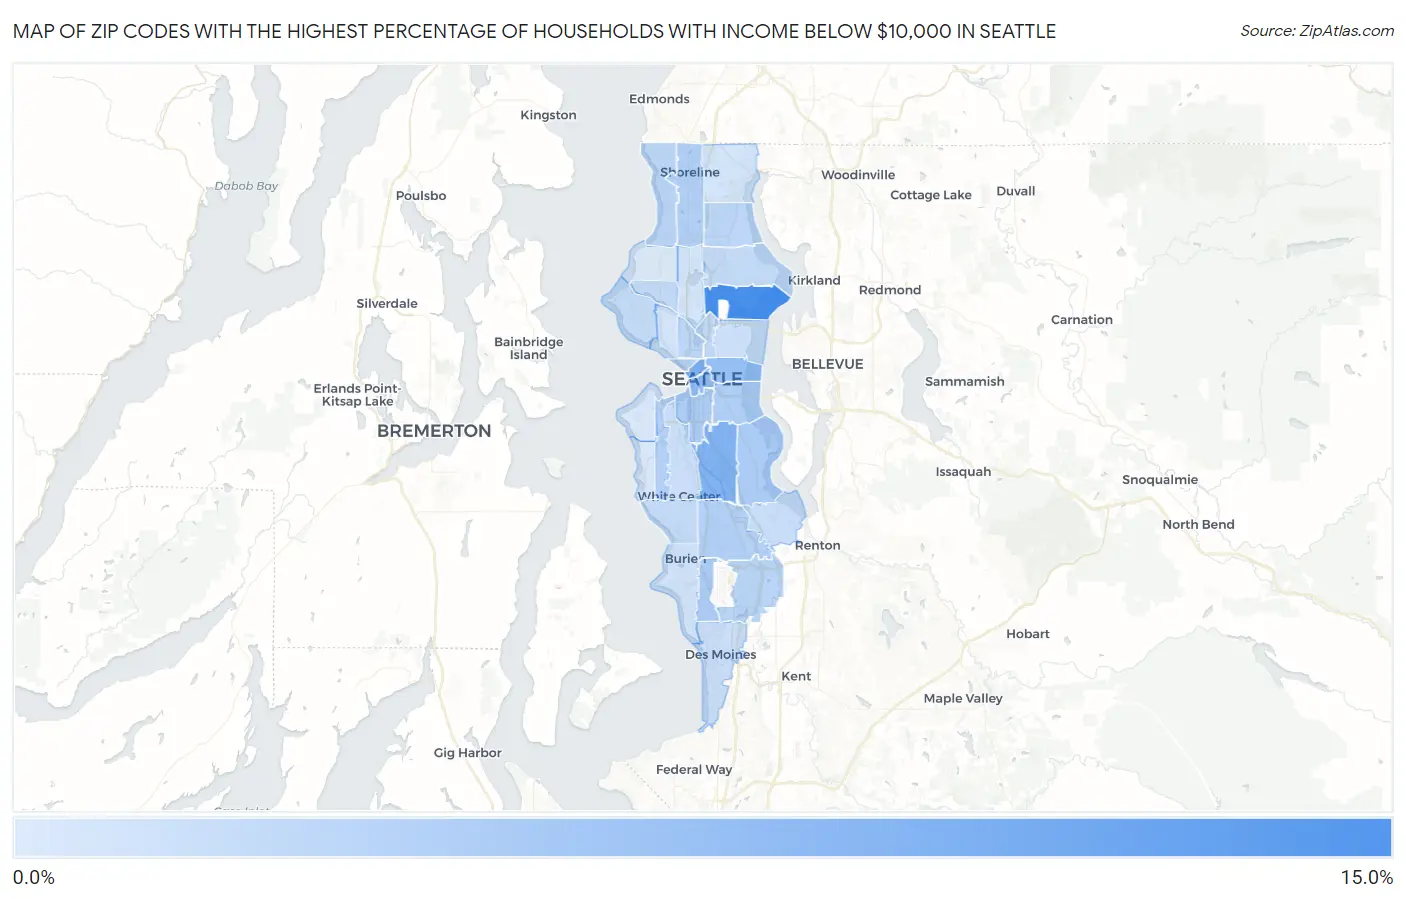
Map of Zip Codes with the Highest Percentage of Households with Income Below $10,000 in Seattle
1.3%
12.8%
Zip Codes with the Highest Percentage of Households with Income Below $10,000 in Seattle, WA
| Zip Code | Households with Income < $10k | vs State | vs National | |
| 1. | 98105 | 12.8% | 3.7%(+9.10)#20 | 4.9%(+7.90)#2,152 |
| 2. | 98101 | 8.4% | 3.7%(+4.70)#53 | 4.9%(+3.50)#5,043 |
| 3. | 98108 | 8.3% | 3.7%(+4.60)#56 | 4.9%(+3.40)#5,170 |
| 4. | 98104 | 7.1% | 3.7%(+3.40)#76 | 4.9%(+2.20)#6,810 |
| 5. | 98122 | 6.7% | 3.7%(+3.00)#86 | 4.9%(+1.80)#7,524 |
| 6. | 98148 | 4.9% | 3.7%(+1.20)#156 | 4.9%(=0.000)#12,096 |
| 7. | 98118 | 4.8% | 3.7%(+1.10)#158 | 4.9%(-0.100)#12,275 |
| 8. | 98134 | 4.8% | 3.7%(+1.10)#164 | 4.9%(-0.100)#12,550 |
| 9. | 98144 | 4.6% | 3.7%(+0.900)#182 | 4.9%(-0.300)#13,010 |
| 10. | 98168 | 4.4% | 3.7%(+0.700)#198 | 4.9%(-0.500)#13,691 |
| 11. | 98133 | 4.3% | 3.7%(+0.600)#205 | 4.9%(-0.600)#14,033 |
| 12. | 98126 | 4.3% | 3.7%(+0.600)#208 | 4.9%(-0.600)#14,119 |
| 13. | 98121 | 4.1% | 3.7%(+0.400)#220 | 4.9%(-0.800)#14,898 |
| 14. | 98188 | 3.8% | 3.7%(+0.100)#235 | 4.9%(-1.10)#16,036 |
| 15. | 98125 | 3.7% | 3.7%(=0.000)#238 | 4.9%(-1.20)#16,391 |
| 16. | 98109 | 3.7% | 3.7%(=0.000)#240 | 4.9%(-1.20)#16,418 |
| 17. | 98177 | 3.7% | 3.7%(=0.000)#243 | 4.9%(-1.20)#16,463 |
| 18. | 98102 | 3.4% | 3.7%(-0.300)#273 | 4.9%(-1.50)#17,692 |
| 19. | 98115 | 3.2% | 3.7%(-0.500)#290 | 4.9%(-1.70)#18,447 |
| 20. | 98107 | 3.1% | 3.7%(-0.600)#304 | 4.9%(-1.80)#18,924 |
| 21. | 98146 | 3.1% | 3.7%(-0.600)#305 | 4.9%(-1.80)#18,925 |
| 22. | 98199 | 3.0% | 3.7%(-0.700)#321 | 4.9%(-1.90)#19,394 |
| 23. | 98178 | 2.8% | 3.7%(-0.900)#344 | 4.9%(-2.10)#20,296 |
| 24. | 98106 | 2.7% | 3.7%(-1.00)#351 | 4.9%(-2.20)#20,716 |
| 25. | 98198 | 2.6% | 3.7%(-1.10)#355 | 4.9%(-2.30)#21,078 |
| 26. | 98112 | 2.4% | 3.7%(-1.30)#381 | 4.9%(-2.50)#22,057 |
| 27. | 98119 | 2.2% | 3.7%(-1.50)#398 | 4.9%(-2.70)#22,880 |
| 28. | 98166 | 2.2% | 3.7%(-1.50)#399 | 4.9%(-2.70)#22,889 |
| 29. | 98103 | 2.0% | 3.7%(-1.70)#411 | 4.9%(-2.90)#23,565 |
| 30. | 98155 | 1.9% | 3.7%(-1.80)#426 | 4.9%(-3.00)#23,987 |
| 31. | 98116 | 1.7% | 3.7%(-2.00)#439 | 4.9%(-3.20)#24,716 |
| 32. | 98136 | 1.6% | 3.7%(-2.10)#451 | 4.9%(-3.30)#25,117 |
| 33. | 98117 | 1.3% | 3.7%(-2.40)#466 | 4.9%(-3.60)#26,004 |
1
Common Questions
What are the Top 10 Zip Codes with the Highest Percentage of Households with Income Below $10,000 in Seattle, WA?
Top 10 Zip Codes with the Highest Percentage of Households with Income Below $10,000 in Seattle, WA are:
What zip code has the Highest Percentage of Households with Income Below $10,000 in Seattle, WA?
98105 has the Highest Percentage of Households with Income Below $10,000 in Seattle, WA with 12.8%.
What is the Percentage of Households with Income Below $10,000 in Seattle, WA?
Percentage of Households with Income Below $10,000 in Seattle is 4.3%.
What is the Percentage of Households with Income Below $10,000 in Washington?
Percentage of Households with Income Below $10,000 in Washington is 3.7%.
What is the Percentage of Households with Income Below $10,000 in the United States?
Percentage of Households with Income Below $10,000 in the United States is 4.9%.