Concrete, WA Map & Demographics
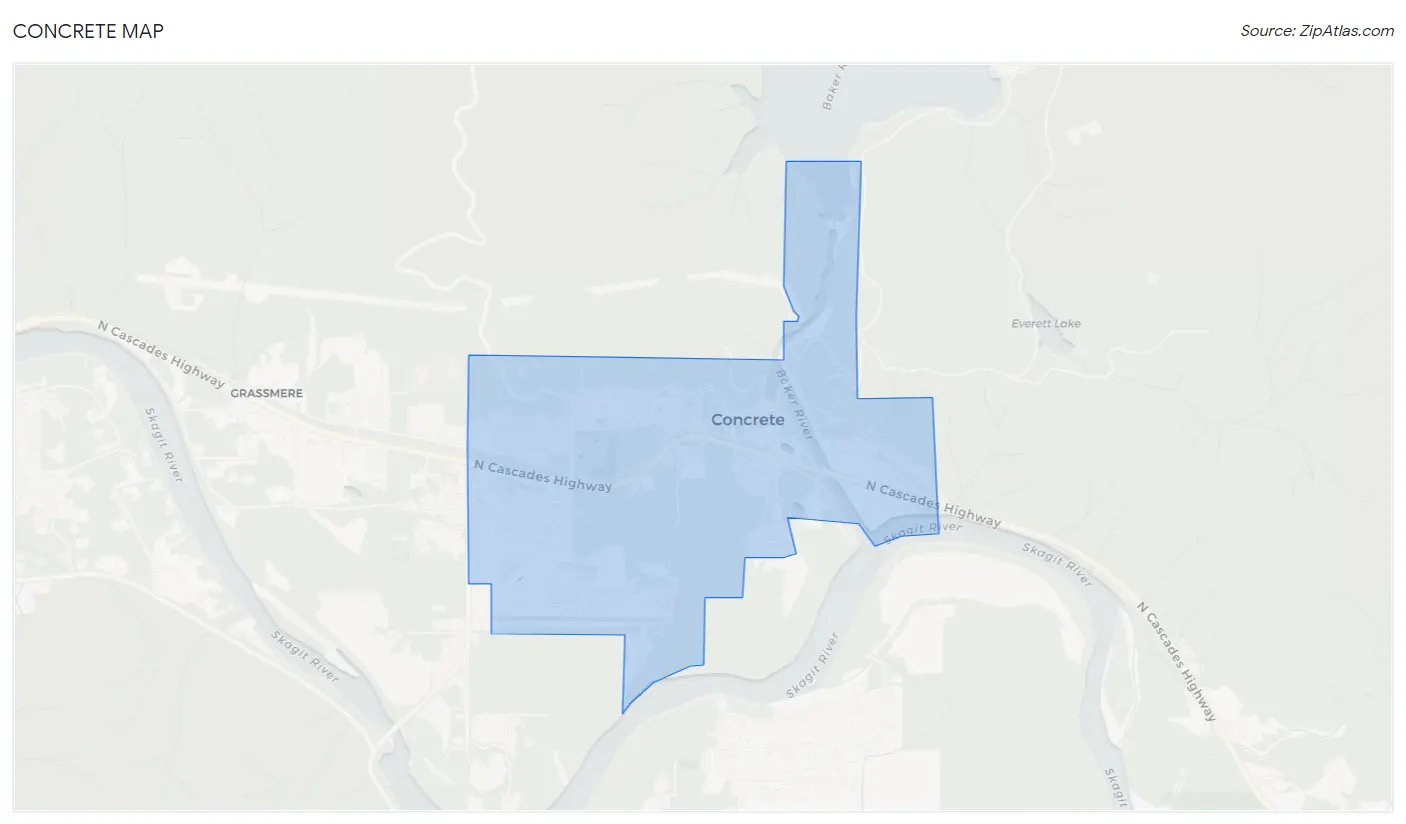
Concrete Map
Concrete Overview
$37,834
PER CAPITA INCOME
$78,713
AVG FAMILY INCOME
$82,375
AVG HOUSEHOLD INCOME
54.8%
WAGE / INCOME GAP [ % ]
45.2¢/ $1
WAGE / INCOME GAP [ $ ]
0.40
INEQUALITY / GINI INDEX
792
TOTAL POPULATION
418
MALE POPULATION
374
FEMALE POPULATION
111.76
MALES / 100 FEMALES
89.47
FEMALES / 100 MALES
34.1
MEDIAN AGE
2.6
AVG FAMILY SIZE
2.2
AVG HOUSEHOLD SIZE
318
LABOR FORCE [ PEOPLE ]
52.0%
PERCENT IN LABOR FORCE
3.8%
UNEMPLOYMENT RATE
Concrete Zip Codes
Concrete Area Codes
Income in Concrete
Income Overview in Concrete
Per Capita Income in Concrete is $37,834, while median incomes of families and households are $78,713 and $82,375 respectively.
| Characteristic | Number | Measure |
| Per Capita Income | 792 | $37,834 |
| Median Family Income | 219 | $78,713 |
| Mean Family Income | 219 | $87,500 |
| Median Household Income | 351 | $82,375 |
| Mean Household Income | 351 | $82,755 |
| Income Deficit | 219 | $0 |
| Wage / Income Gap (%) | 792 | 54.75% |
| Wage / Income Gap ($) | 792 | 45.25¢ per $1 |
| Gini / Inequality Index | 792 | 0.40 |
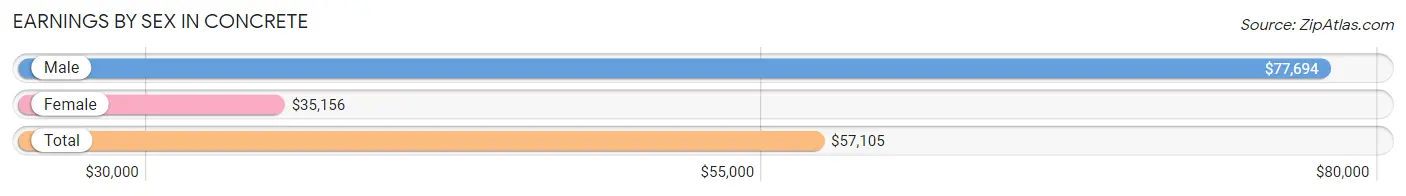
Earnings by Sex in Concrete
Average Earnings in Concrete are $57,105, $77,694 for men and $35,156 for women, a difference of 54.7%.
| Sex | Number | Average Earnings |
| Male | 237 (56.2%) | $77,694 |
| Female | 185 (43.8%) | $35,156 |
| Total | 422 (100.0%) | $57,105 |
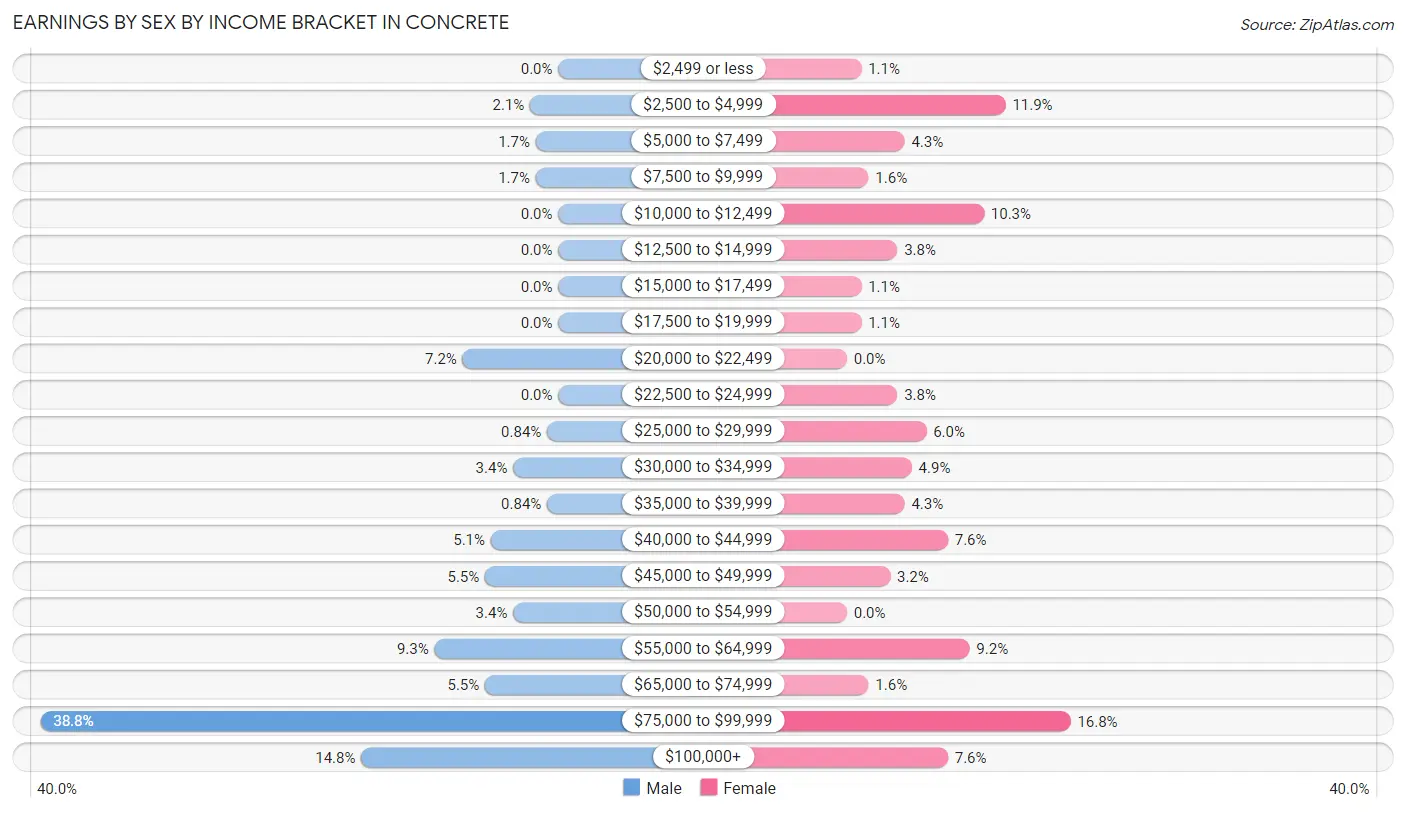
Earnings by Sex by Income Bracket in Concrete
The most common earnings brackets in Concrete are $75,000 to $99,999 for men (92 | 38.8%) and $75,000 to $99,999 for women (31 | 16.8%).
| Income | Male | Female |
| $2,499 or less | 0 (0.0%) | 2 (1.1%) |
| $2,500 to $4,999 | 5 (2.1%) | 22 (11.9%) |
| $5,000 to $7,499 | 4 (1.7%) | 8 (4.3%) |
| $7,500 to $9,999 | 4 (1.7%) | 3 (1.6%) |
| $10,000 to $12,499 | 0 (0.0%) | 19 (10.3%) |
| $12,500 to $14,999 | 0 (0.0%) | 7 (3.8%) |
| $15,000 to $17,499 | 0 (0.0%) | 2 (1.1%) |
| $17,500 to $19,999 | 0 (0.0%) | 2 (1.1%) |
| $20,000 to $22,499 | 17 (7.2%) | 0 (0.0%) |
| $22,500 to $24,999 | 0 (0.0%) | 7 (3.8%) |
| $25,000 to $29,999 | 2 (0.8%) | 11 (5.9%) |
| $30,000 to $34,999 | 8 (3.4%) | 9 (4.9%) |
| $35,000 to $39,999 | 2 (0.8%) | 8 (4.3%) |
| $40,000 to $44,999 | 12 (5.1%) | 14 (7.6%) |
| $45,000 to $49,999 | 13 (5.5%) | 6 (3.2%) |
| $50,000 to $54,999 | 8 (3.4%) | 0 (0.0%) |
| $55,000 to $64,999 | 22 (9.3%) | 17 (9.2%) |
| $65,000 to $74,999 | 13 (5.5%) | 3 (1.6%) |
| $75,000 to $99,999 | 92 (38.8%) | 31 (16.8%) |
| $100,000+ | 35 (14.8%) | 14 (7.6%) |
| Total | 237 (100.0%) | 185 (100.0%) |
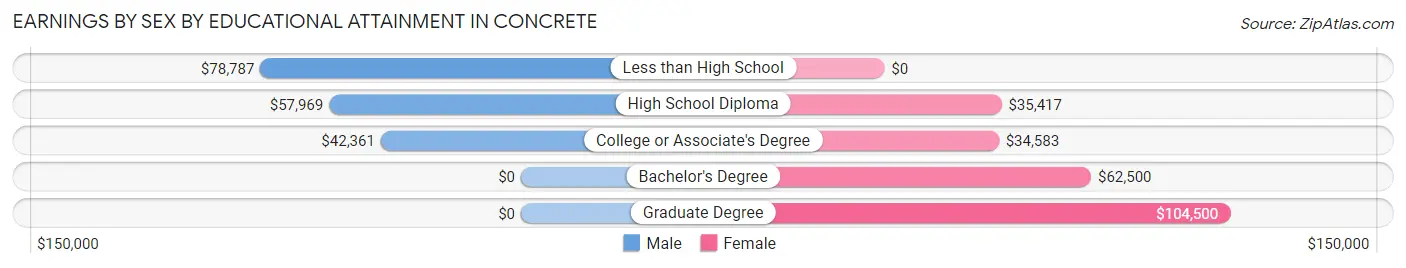
Earnings by Sex by Educational Attainment in Concrete
Average earnings in Concrete are $77,905 for men and $37,031 for women, a difference of 52.5%. Men with an educational attainment of less than high school enjoy the highest average annual earnings of $78,787, while those with college or associate's degree education earn the least with $42,361. Women with an educational attainment of graduate degree earn the most with the average annual earnings of $104,500, while those with college or associate's degree education have the smallest earnings of $34,583.
| Educational Attainment | Male Income | Female Income |
| Less than High School | $78,787 | $0 |
| High School Diploma | $57,969 | $35,417 |
| College or Associate's Degree | $42,361 | $34,583 |
| Bachelor's Degree | - | - |
| Graduate Degree | - | - |
| Total | $77,905 | $37,031 |
Family Income in Concrete
Family Income Brackets in Concrete
According to the Concrete family income data, there are 76 families falling into the $75,000 to $99,999 income range, which is the most common income bracket and makes up 34.7% of all families. Conversely, the $10,000 to $14,999 income bracket is the least frequent group with only 2 families (0.9%) belonging to this category.
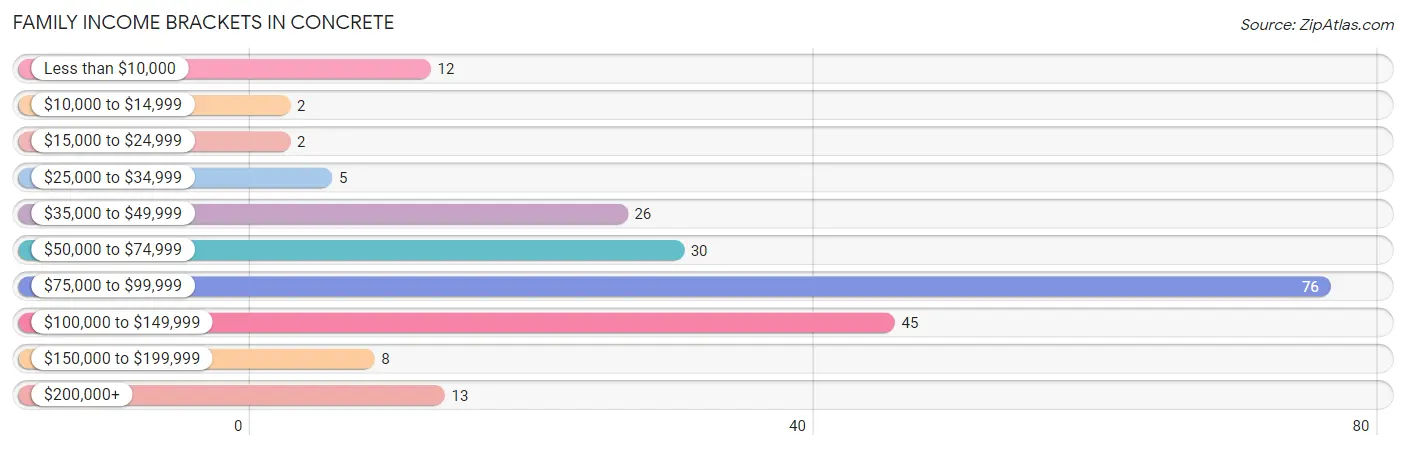
| Income Bracket | # Families | % Families |
| Less than $10,000 | 12 | 5.5% |
| $10,000 to $14,999 | 2 | 0.9% |
| $15,000 to $24,999 | 2 | 0.9% |
| $25,000 to $34,999 | 5 | 2.3% |
| $35,000 to $49,999 | 26 | 11.9% |
| $50,000 to $74,999 | 30 | 13.7% |
| $75,000 to $99,999 | 76 | 34.7% |
| $100,000 to $149,999 | 45 | 20.5% |
| $150,000 to $199,999 | 8 | 3.7% |
| $200,000+ | 13 | 5.9% |
Family Income by Famaliy Size in Concrete
4-person families (21 | 9.6%) account for the highest median family income in Concrete with $103,250 per family, while 3-person families (109 | 49.8%) have the highest median income of $26,300 per family member.
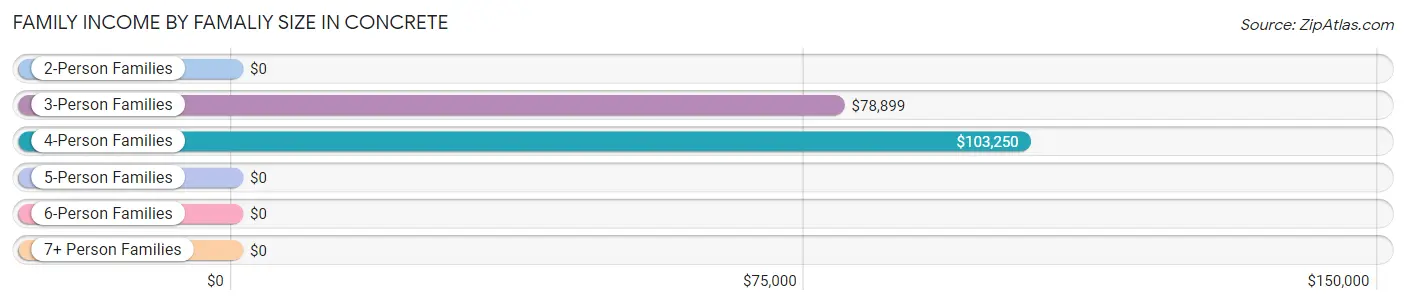
| Income Bracket | # Families | Median Income |
| 2-Person Families | 77 (35.2%) | $0 |
| 3-Person Families | 109 (49.8%) | $78,899 |
| 4-Person Families | 21 (9.6%) | $103,250 |
| 5-Person Families | 8 (3.6%) | $0 |
| 6-Person Families | 4 (1.8%) | $0 |
| 7+ Person Families | 0 (0.0%) | $0 |
| Total | 219 (100.0%) | $78,713 |
Family Income by Number of Earners in Concrete
The median family income in Concrete is $78,713, with families comprising 3+ earners (11) having the highest median family income of $158,125, while families with no earners (21) have the lowest median family income of $2,499, accounting for 5.0% and 9.6% of families, respectively.
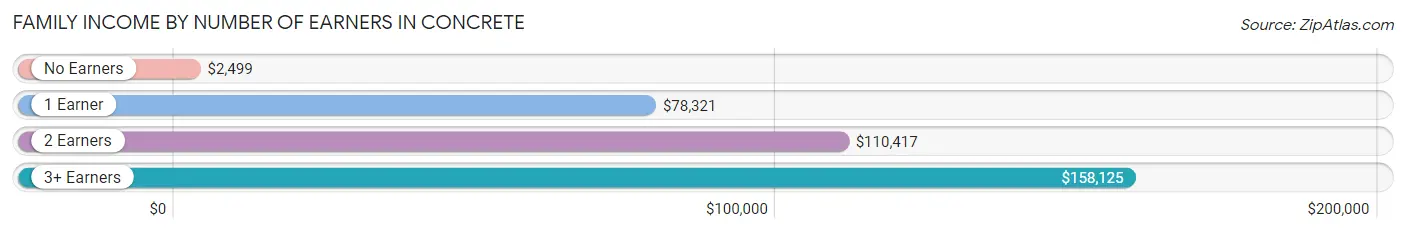
| Number of Earners | # Families | Median Income |
| No Earners | 21 (9.6%) | $2,499 |
| 1 Earner | 116 (53.0%) | $78,321 |
| 2 Earners | 71 (32.4%) | $110,417 |
| 3+ Earners | 11 (5.0%) | $158,125 |
| Total | 219 (100.0%) | $78,713 |
Household Income in Concrete
Household Income Brackets in Concrete
With 86 households falling in the category, the $75,000 to $99,999 income range is the most frequent in Concrete, accounting for 24.5% of all households. In contrast, only 5 households (1.4%) fall into the $25,000 to $34,999 income bracket, making it the least populous group.
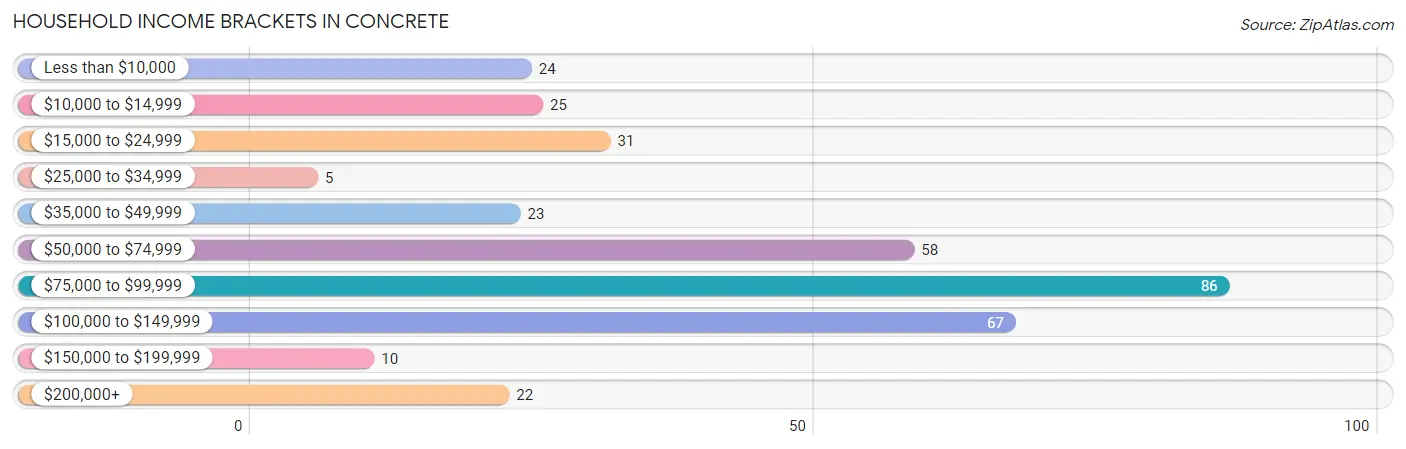
| Income Bracket | # Households | % Households |
| Less than $10,000 | 24 | 6.8% |
| $10,000 to $14,999 | 25 | 7.1% |
| $15,000 to $24,999 | 31 | 8.8% |
| $25,000 to $34,999 | 5 | 1.4% |
| $35,000 to $49,999 | 23 | 6.6% |
| $50,000 to $74,999 | 58 | 16.5% |
| $75,000 to $99,999 | 86 | 24.5% |
| $100,000 to $149,999 | 67 | 19.1% |
| $150,000 to $199,999 | 10 | 2.8% |
| $200,000+ | 22 | 6.3% |
Household Income by Householder Age in Concrete
The median household income in Concrete is $82,375, with the highest median household income of $91,660 found in the 25 to 44 years age bracket for the primary householder. A total of 153 households (43.6%) fall into this category. Meanwhile, the 15 to 24 years age bracket for the primary householder has the lowest median household income of $0, with 1 households (0.3%) in this group.
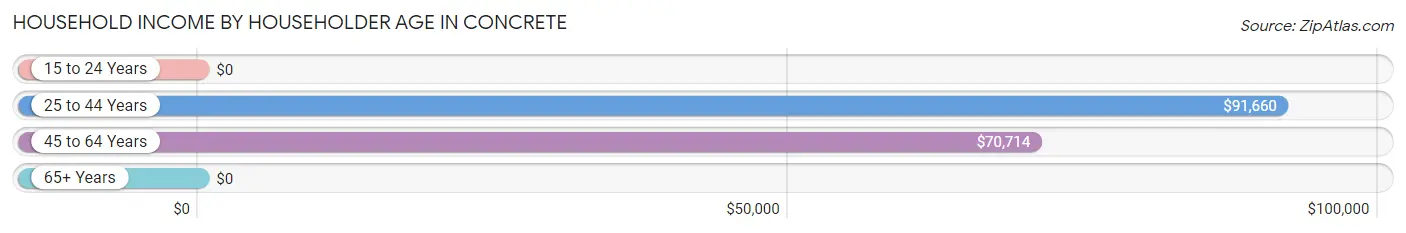
| Income Bracket | # Households | Median Income |
| 15 to 24 Years | 1 (0.3%) | $0 |
| 25 to 44 Years | 153 (43.6%) | $91,660 |
| 45 to 64 Years | 120 (34.2%) | $70,714 |
| 65+ Years | 77 (21.9%) | $0 |
| Total | 351 (100.0%) | $82,375 |
Poverty in Concrete
Income Below Poverty by Sex and Age in Concrete
With 8.6% poverty level for males and 21.9% for females among the residents of Concrete, 55 to 64 year old males and 25 to 34 year old females are the most vulnerable to poverty, with 23 males (32.9%) and 30 females (49.2%) in their respective age groups living below the poverty level.
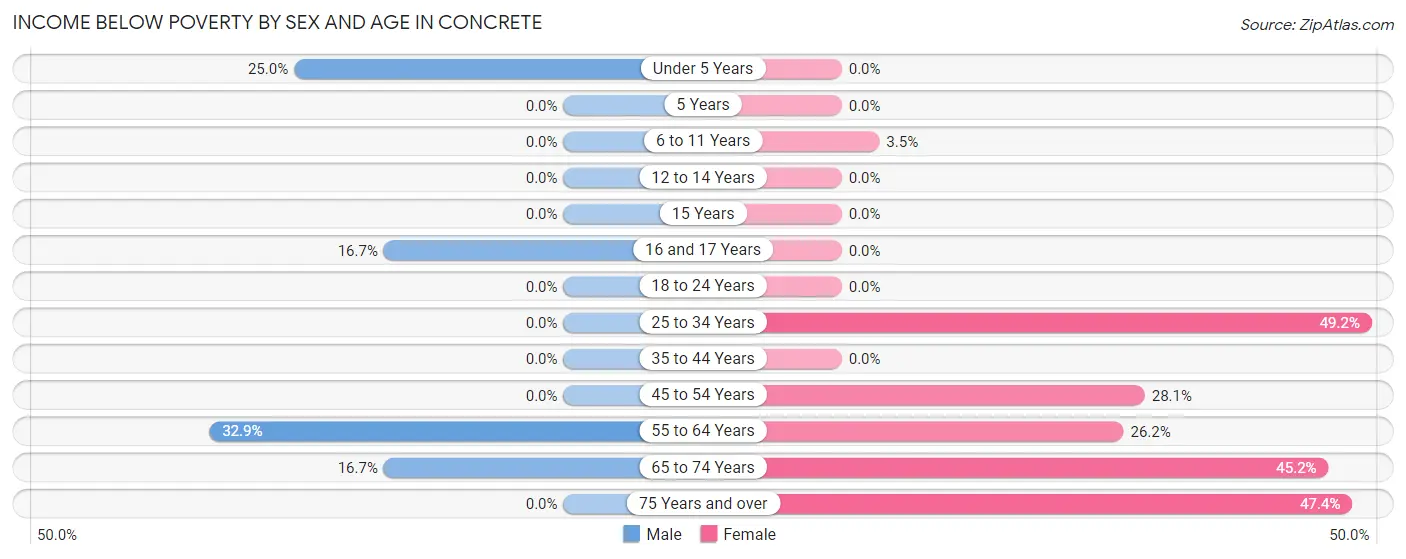
| Age Bracket | Male | Female |
| Under 5 Years | 5 (25.0%) | 0 (0.0%) |
| 5 Years | 0 (0.0%) | 0 (0.0%) |
| 6 to 11 Years | 0 (0.0%) | 3 (3.5%) |
| 12 to 14 Years | 0 (0.0%) | 0 (0.0%) |
| 15 Years | 0 (0.0%) | 0 (0.0%) |
| 16 and 17 Years | 2 (16.7%) | 0 (0.0%) |
| 18 to 24 Years | 0 (0.0%) | 0 (0.0%) |
| 25 to 34 Years | 0 (0.0%) | 30 (49.2%) |
| 35 to 44 Years | 0 (0.0%) | 0 (0.0%) |
| 45 to 54 Years | 0 (0.0%) | 9 (28.1%) |
| 55 to 64 Years | 23 (32.9%) | 17 (26.2%) |
| 65 to 74 Years | 6 (16.7%) | 14 (45.2%) |
| 75 Years and over | 0 (0.0%) | 9 (47.4%) |
| Total | 36 (8.6%) | 82 (21.9%) |
Income Above Poverty by Sex and Age in Concrete
According to the poverty statistics in Concrete, males aged 5 years and females aged under 5 years are the age groups that are most secure financially, with 100.0% of males and 100.0% of females in these age groups living above the poverty line.
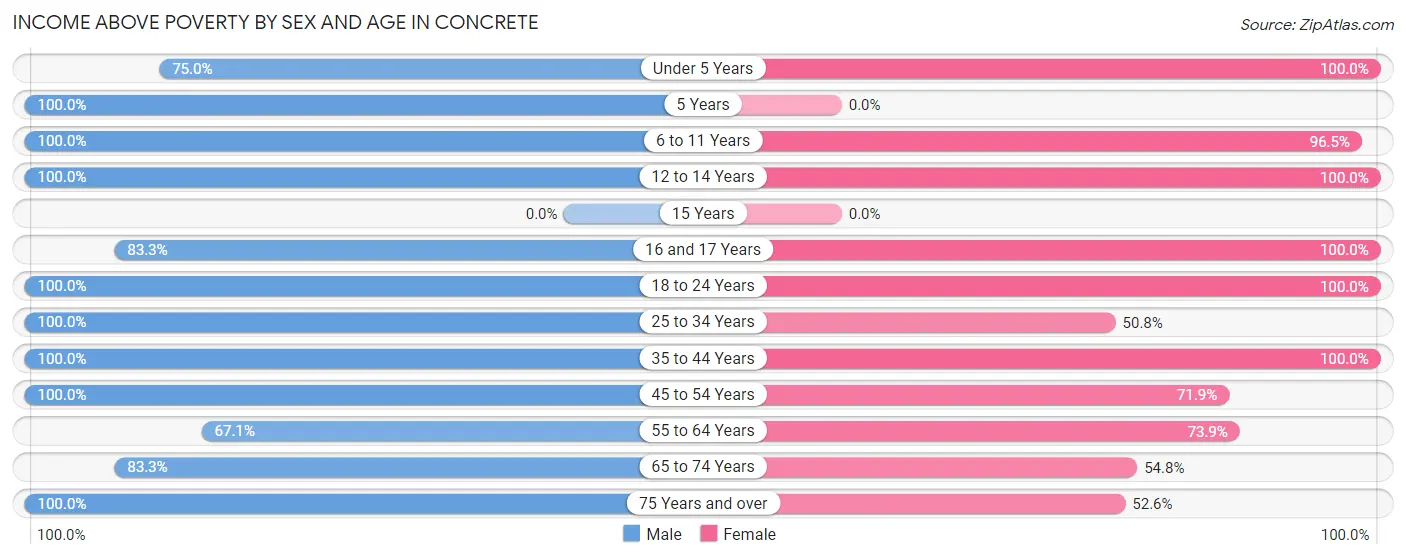
| Age Bracket | Male | Female |
| Under 5 Years | 15 (75.0%) | 18 (100.0%) |
| 5 Years | 8 (100.0%) | 0 (0.0%) |
| 6 to 11 Years | 41 (100.0%) | 83 (96.5%) |
| 12 to 14 Years | 2 (100.0%) | 6 (100.0%) |
| 15 Years | 0 (0.0%) | 0 (0.0%) |
| 16 and 17 Years | 10 (83.3%) | 4 (100.0%) |
| 18 to 24 Years | 20 (100.0%) | 15 (100.0%) |
| 25 to 34 Years | 127 (100.0%) | 31 (50.8%) |
| 35 to 44 Years | 37 (100.0%) | 37 (100.0%) |
| 45 to 54 Years | 37 (100.0%) | 23 (71.9%) |
| 55 to 64 Years | 47 (67.1%) | 48 (73.9%) |
| 65 to 74 Years | 30 (83.3%) | 17 (54.8%) |
| 75 Years and over | 8 (100.0%) | 10 (52.6%) |
| Total | 382 (91.4%) | 292 (78.1%) |
Income Below Poverty Among Married-Couple Families in Concrete
The poverty statistics for married-couple families in Concrete show that 9.1% or 9 of the total 99 families live below the poverty line. Families with no children have the highest poverty rate of 14.1%, comprising of 9 families. On the other hand, families with 1 or 2 children have the lowest poverty rate of 0.0%, which includes 0 families.
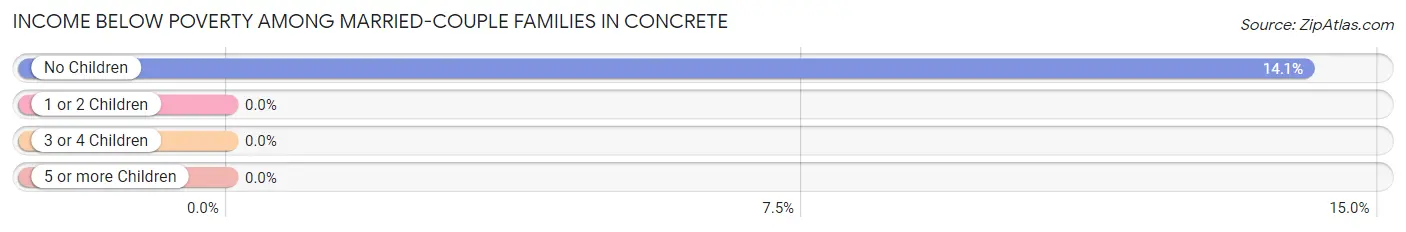
| Children | Above Poverty | Below Poverty |
| No Children | 55 (85.9%) | 9 (14.1%) |
| 1 or 2 Children | 33 (100.0%) | 0 (0.0%) |
| 3 or 4 Children | 2 (100.0%) | 0 (0.0%) |
| 5 or more Children | 0 (0.0%) | 0 (0.0%) |
| Total | 90 (90.9%) | 9 (9.1%) |
Income Below Poverty Among Single-Parent Households in Concrete
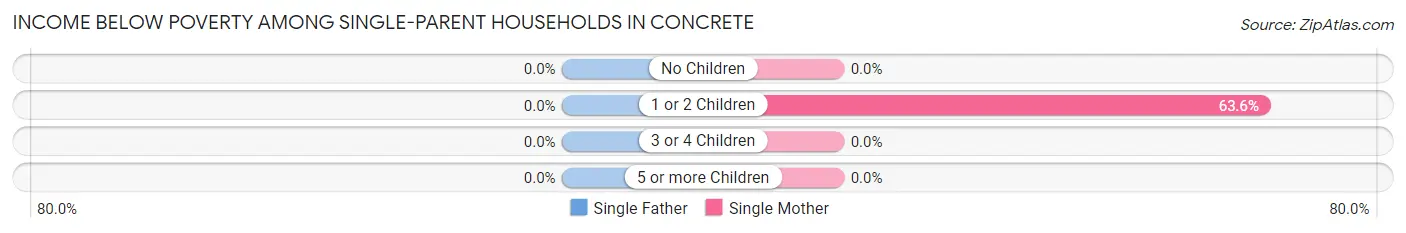
| Children | Single Father | Single Mother |
| No Children | 0 (0.0%) | 0 (0.0%) |
| 1 or 2 Children | 0 (0.0%) | 7 (63.6%) |
| 3 or 4 Children | 0 (0.0%) | 0 (0.0%) |
| 5 or more Children | 0 (0.0%) | 0 (0.0%) |
| Total | 0 (0.0%) | 7 (50.0%) |
Income Below Poverty Among Married-Couple vs Single-Parent Households in Concrete
The poverty data for Concrete shows that 9 of the married-couple family households (9.1%) and 7 of the single-parent households (5.8%) are living below the poverty level. Within the married-couple family households, those with no children have the highest poverty rate, with 9 households (14.1%) falling below the poverty line. Among the single-parent households, those with 1 or 2 children have the highest poverty rate, with 7 household (6.1%) living below poverty.
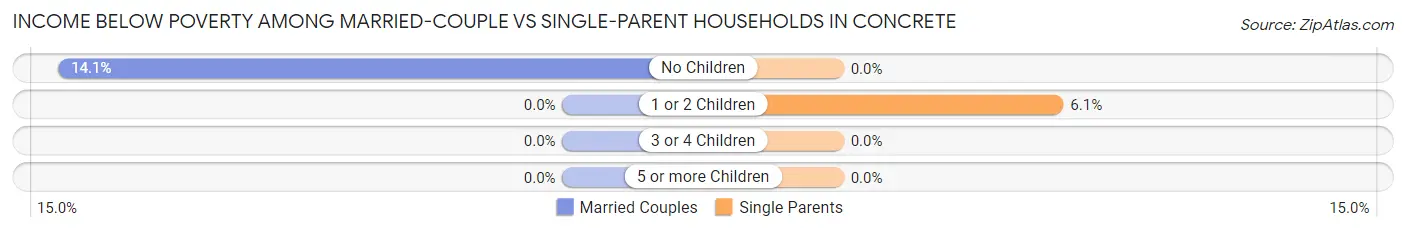
| Children | Married-Couple Families | Single-Parent Households |
| No Children | 9 (14.1%) | 0 (0.0%) |
| 1 or 2 Children | 0 (0.0%) | 7 (6.1%) |
| 3 or 4 Children | 0 (0.0%) | 0 (0.0%) |
| 5 or more Children | 0 (0.0%) | 0 (0.0%) |
| Total | 9 (9.1%) | 7 (5.8%) |
Race in Concrete
The most populous races in Concrete are White / Caucasian (542 | 68.4%), Two or more Races (192 | 24.2%), and Hispanic or Latino (168 | 21.2%).
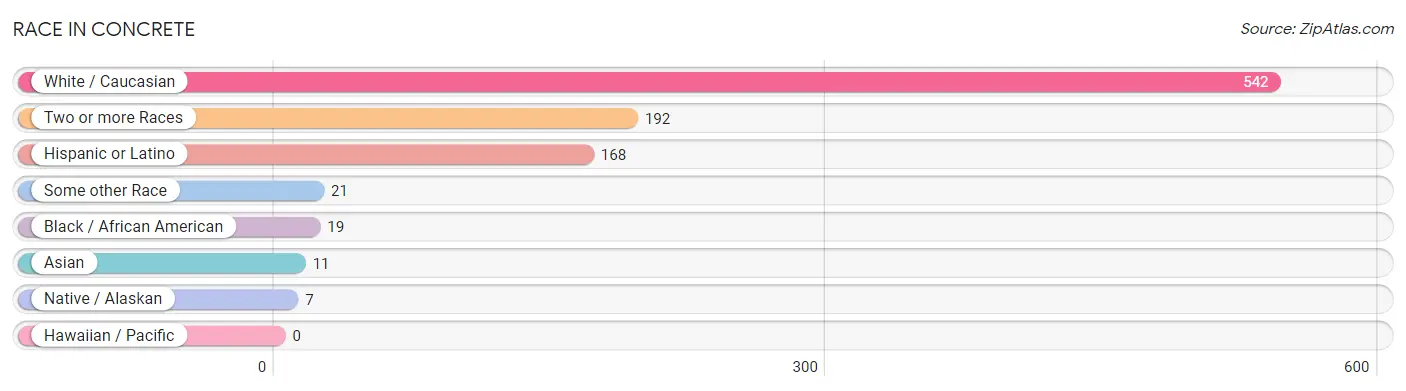
| Race | # Population | % Population |
| Asian | 11 | 1.4% |
| Black / African American | 19 | 2.4% |
| Hawaiian / Pacific | 0 | 0.0% |
| Hispanic or Latino | 168 | 21.2% |
| Native / Alaskan | 7 | 0.9% |
| White / Caucasian | 542 | 68.4% |
| Two or more Races | 192 | 24.2% |
| Some other Race | 21 | 2.6% |
| Total | 792 | 100.0% |
Ancestry in Concrete
The most populous ancestries reported in Concrete are Irish (119 | 15.0%), German (109 | 13.8%), Puerto Rican (99 | 12.5%), Norwegian (71 | 9.0%), and Italian (69 | 8.7%), together accounting for 59.0% of all Concrete residents.
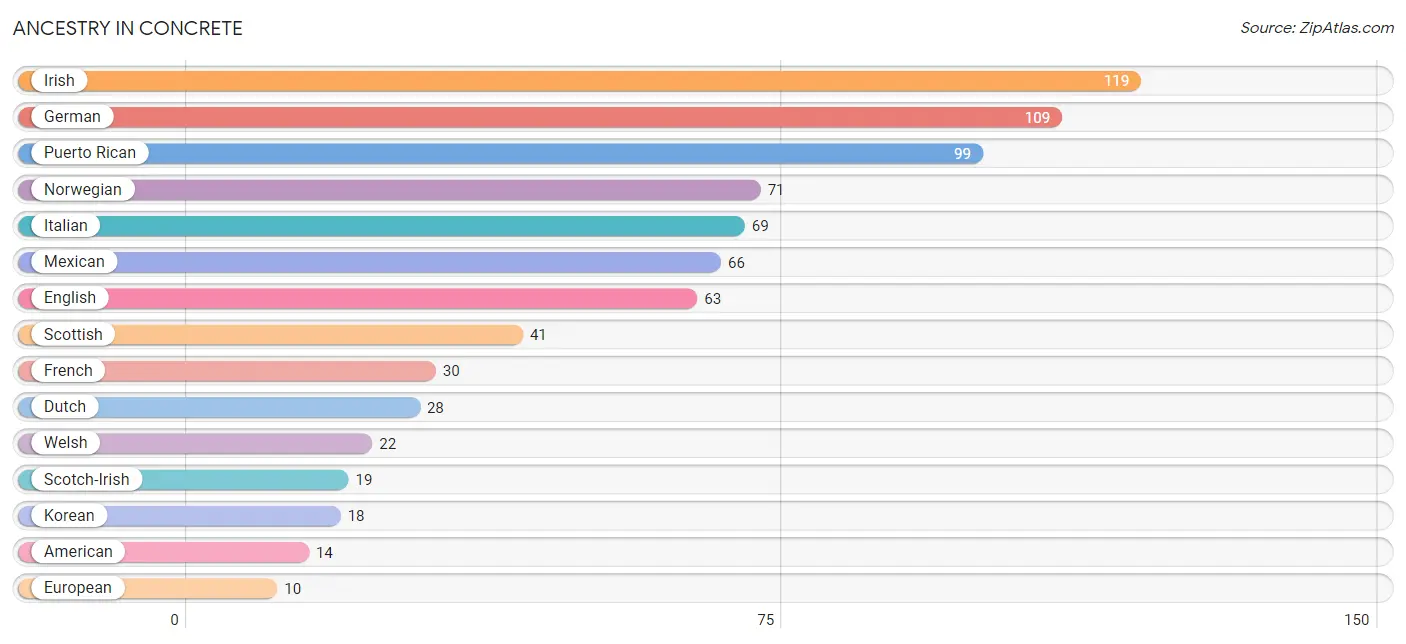
| Ancestry | # Population | % Population |
| American | 14 | 1.8% |
| Austrian | 7 | 0.9% |
| Canadian | 7 | 0.9% |
| Central American | 3 | 0.4% |
| Cherokee | 4 | 0.5% |
| Chippewa | 3 | 0.4% |
| Czech | 2 | 0.3% |
| Danish | 4 | 0.5% |
| Dutch | 28 | 3.5% |
| English | 63 | 8.0% |
| European | 10 | 1.3% |
| French | 30 | 3.8% |
| French Canadian | 6 | 0.8% |
| German | 109 | 13.8% |
| Icelander | 2 | 0.3% |
| Irish | 119 | 15.0% |
| Italian | 69 | 8.7% |
| Korean | 18 | 2.3% |
| Mexican | 66 | 8.3% |
| Norwegian | 71 | 9.0% |
| Polish | 6 | 0.8% |
| Puerto Rican | 99 | 12.5% |
| Romanian | 3 | 0.4% |
| Salvadoran | 3 | 0.4% |
| Scandinavian | 1 | 0.1% |
| Scotch-Irish | 19 | 2.4% |
| Scottish | 41 | 5.2% |
| Swedish | 10 | 1.3% |
| Swiss | 6 | 0.8% |
| Welsh | 22 | 2.8% |
| Yup'ik | 1 | 0.1% | View All 31 Rows |
Immigrants in Concrete
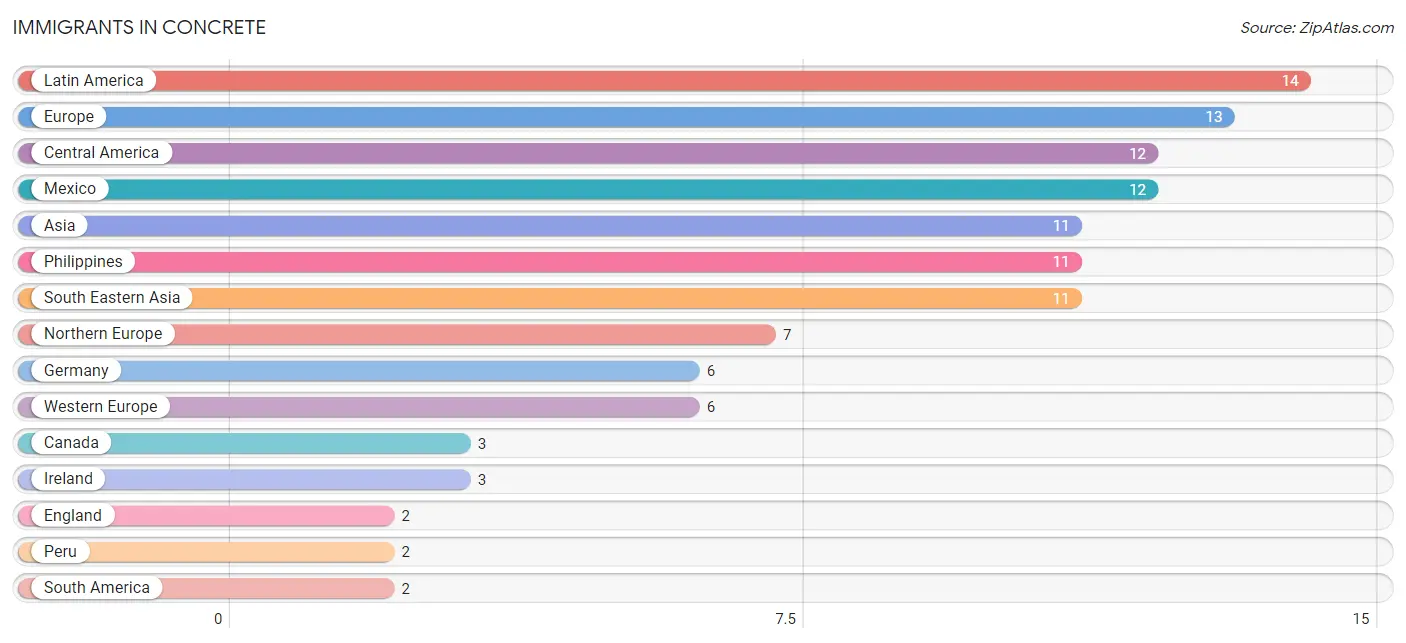
The most numerous immigrant groups reported in Concrete came from Latin America (14 | 1.8%), Europe (13 | 1.6%), Central America (12 | 1.5%), Mexico (12 | 1.5%), and Asia (11 | 1.4%), together accounting for 7.8% of all Concrete residents.
| Immigration Origin | # Population | % Population |
| Asia | 11 | 1.4% |
| Canada | 3 | 0.4% |
| Central America | 12 | 1.5% |
| England | 2 | 0.3% |
| Europe | 13 | 1.6% |
| Germany | 6 | 0.8% |
| Ireland | 3 | 0.4% |
| Latin America | 14 | 1.8% |
| Mexico | 12 | 1.5% |
| Northern Europe | 7 | 0.9% |
| Peru | 2 | 0.3% |
| Philippines | 11 | 1.4% |
| South America | 2 | 0.3% |
| South Eastern Asia | 11 | 1.4% |
| Western Europe | 6 | 0.8% | View All 15 Rows |
Sex and Age in Concrete
Sex and Age in Concrete
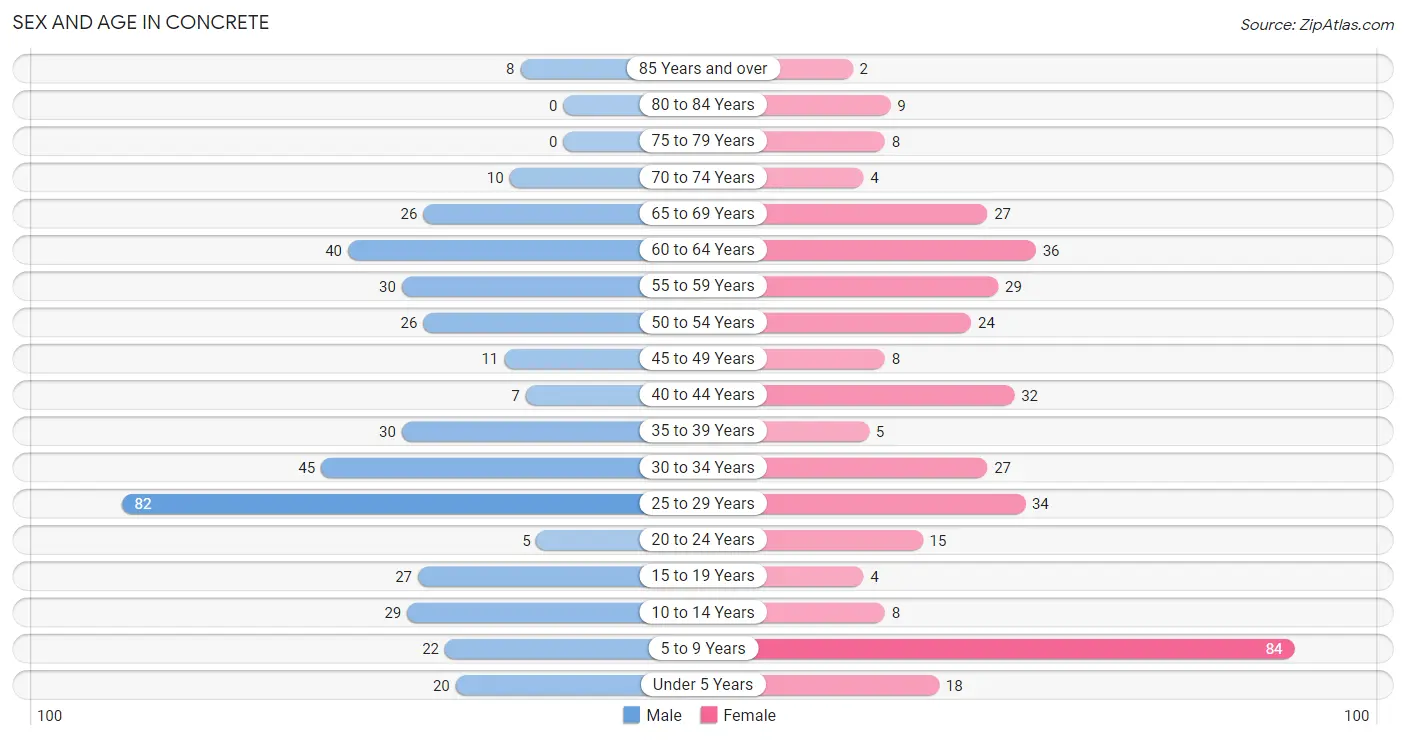
The most populous age groups in Concrete are 25 to 29 Years (82 | 19.6%) for men and 5 to 9 Years (84 | 22.5%) for women.
| Age Bracket | Male | Female |
| Under 5 Years | 20 (4.8%) | 18 (4.8%) |
| 5 to 9 Years | 22 (5.3%) | 84 (22.5%) |
| 10 to 14 Years | 29 (6.9%) | 8 (2.1%) |
| 15 to 19 Years | 27 (6.5%) | 4 (1.1%) |
| 20 to 24 Years | 5 (1.2%) | 15 (4.0%) |
| 25 to 29 Years | 82 (19.6%) | 34 (9.1%) |
| 30 to 34 Years | 45 (10.8%) | 27 (7.2%) |
| 35 to 39 Years | 30 (7.2%) | 5 (1.3%) |
| 40 to 44 Years | 7 (1.7%) | 32 (8.6%) |
| 45 to 49 Years | 11 (2.6%) | 8 (2.1%) |
| 50 to 54 Years | 26 (6.2%) | 24 (6.4%) |
| 55 to 59 Years | 30 (7.2%) | 29 (7.7%) |
| 60 to 64 Years | 40 (9.6%) | 36 (9.6%) |
| 65 to 69 Years | 26 (6.2%) | 27 (7.2%) |
| 70 to 74 Years | 10 (2.4%) | 4 (1.1%) |
| 75 to 79 Years | 0 (0.0%) | 8 (2.1%) |
| 80 to 84 Years | 0 (0.0%) | 9 (2.4%) |
| 85 Years and over | 8 (1.9%) | 2 (0.5%) |
| Total | 418 (100.0%) | 374 (100.0%) |
Families and Households in Concrete
Median Family Size in Concrete
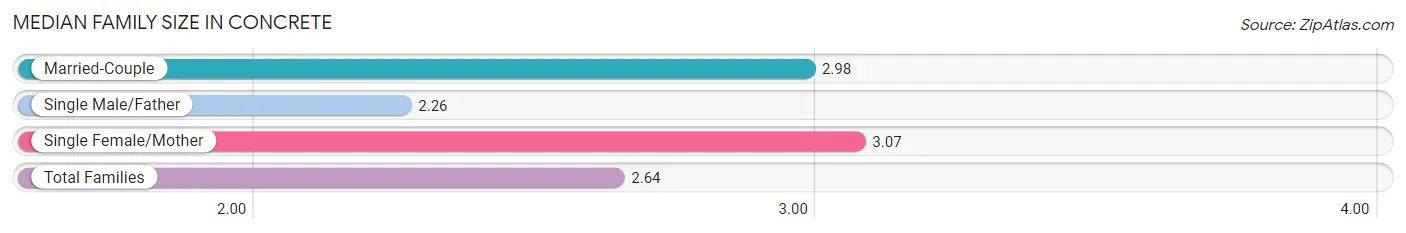
The median family size in Concrete is 2.64 persons per family, with single female/mother families (14 | 6.4%) accounting for the largest median family size of 3.07 persons per family. On the other hand, single male/father families (106 | 48.4%) represent the smallest median family size with 2.26 persons per family.
| Family Type | # Families | Family Size |
| Married-Couple | 99 (45.2%) | 2.98 |
| Single Male/Father | 106 (48.4%) | 2.26 |
| Single Female/Mother | 14 (6.4%) | 3.07 |
| Total Families | 219 (100.0%) | 2.64 |
Median Household Size in Concrete
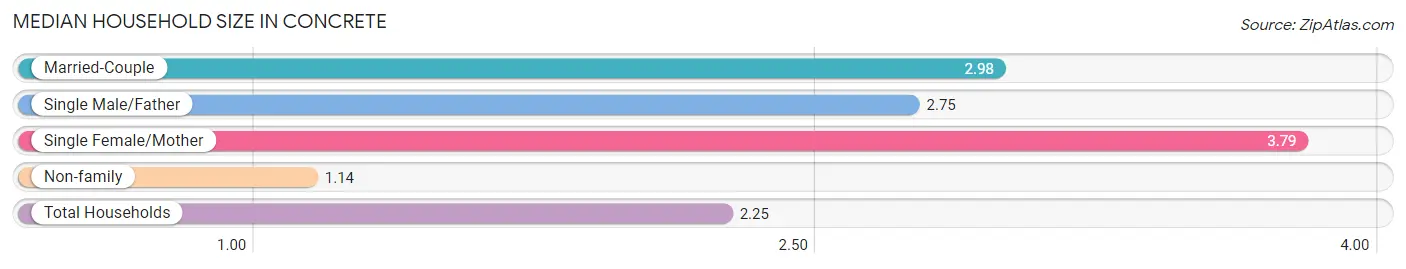
The median household size in Concrete is 2.25 persons per household, with single female/mother households (14 | 4.0%) accounting for the largest median household size of 3.79 persons per household. non-family households (132 | 37.6%) represent the smallest median household size with 1.14 persons per household.
| Household Type | # Households | Household Size |
| Married-Couple | 99 (28.2%) | 2.98 |
| Single Male/Father | 106 (30.2%) | 2.75 |
| Single Female/Mother | 14 (4.0%) | 3.79 |
| Non-family | 132 (37.6%) | 1.14 |
| Total Households | 351 (100.0%) | 2.25 |
Household Size by Marriage Status in Concrete
Out of a total of 351 households in Concrete, 219 (62.4%) are family households, while 132 (37.6%) are nonfamily households. The most numerous type of family households are 4-person households, comprising 92, and the most common type of nonfamily households are 1-person households, comprising 114.
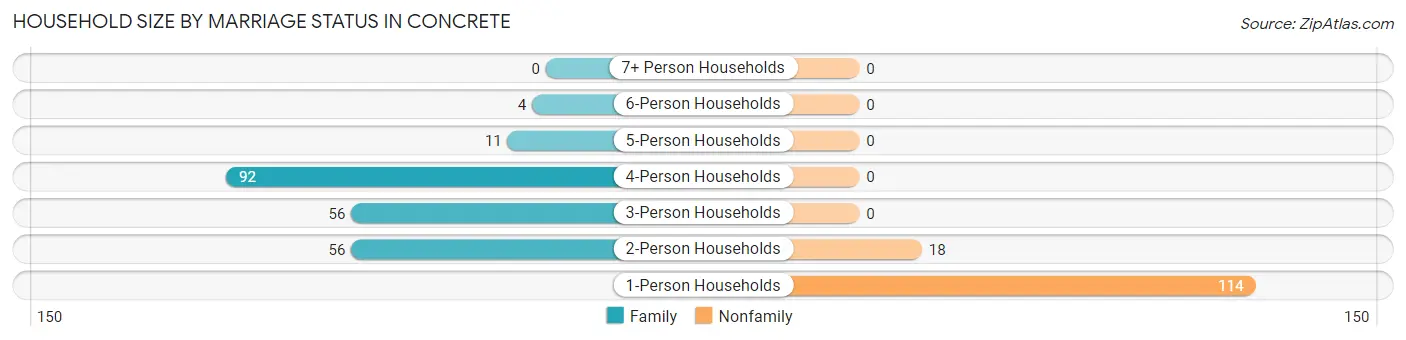
| Household Size | Family Households | Nonfamily Households |
| 1-Person Households | - | 114 (32.5%) |
| 2-Person Households | 56 (16.0%) | 18 (5.1%) |
| 3-Person Households | 56 (16.0%) | 0 (0.0%) |
| 4-Person Households | 92 (26.2%) | 0 (0.0%) |
| 5-Person Households | 11 (3.1%) | 0 (0.0%) |
| 6-Person Households | 4 (1.1%) | 0 (0.0%) |
| 7+ Person Households | 0 (0.0%) | 0 (0.0%) |
| Total | 219 (62.4%) | 132 (37.6%) |
Female Fertility in Concrete
Fertility by Age in Concrete
Average fertility rate in Concrete is 16.0 births per 1,000 women. Women in the age bracket of 35 to 50 years have the highest fertility rate with 44.0 births per 1,000 women. Women in the age bracket of 35 to 50 years acount for 100.0% of all women with births.
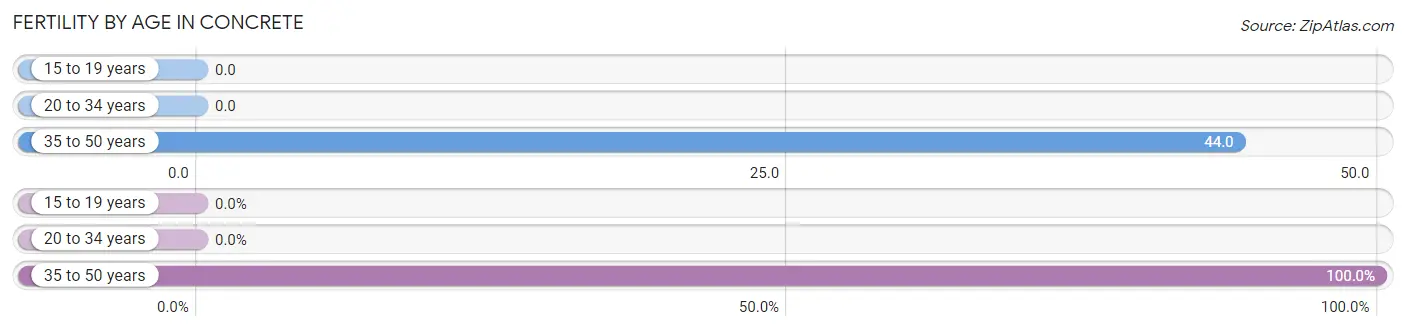
| Age Bracket | Women with Births | Births / 1,000 Women |
| 15 to 19 years | 0 (0.0%) | 0.0 |
| 20 to 34 years | 0 (0.0%) | 0.0 |
| 35 to 50 years | 2 (100.0%) | 44.0 |
| Total | 2 (100.0%) | 16.0 |
Fertility by Age by Marriage Status in Concrete
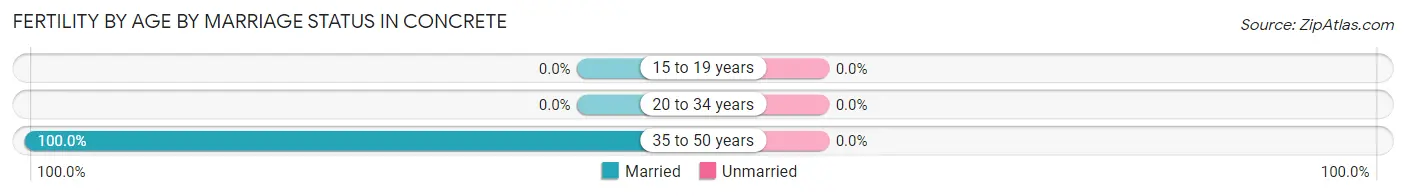
| Age Bracket | Married | Unmarried |
| 15 to 19 years | 0 (0.0%) | 0 (0.0%) |
| 20 to 34 years | 0 (0.0%) | 0 (0.0%) |
| 35 to 50 years | 2 (100.0%) | 0 (0.0%) |
| Total | 2 (100.0%) | 0 (0.0%) |
Fertility by Education in Concrete
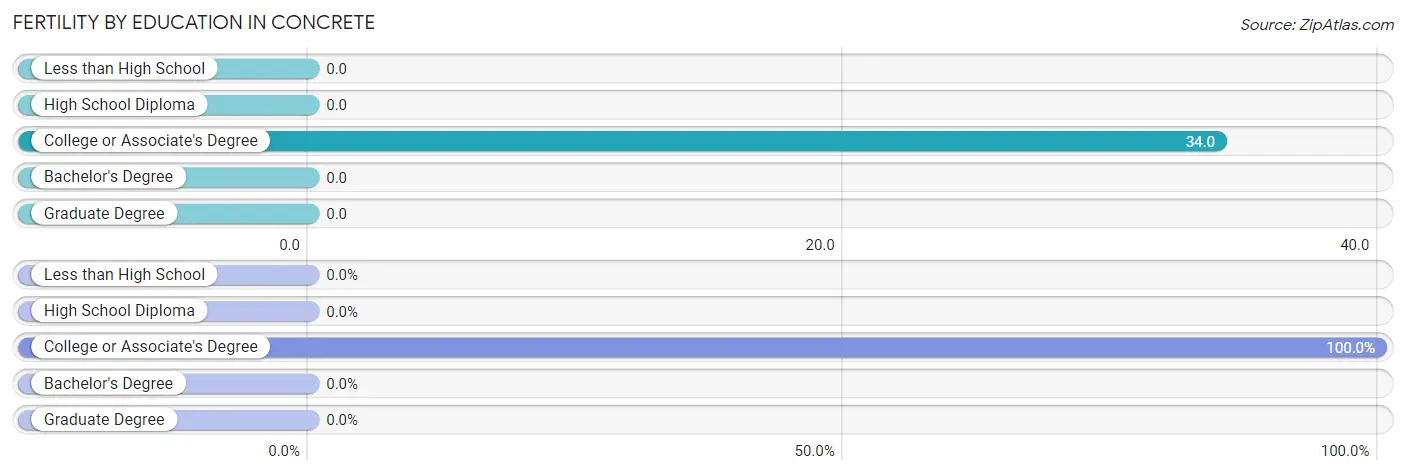
| Educational Attainment | Women with Births | Births / 1,000 Women |
| Less than High School | 0 (0.0%) | 0.0 |
| High School Diploma | 0 (0.0%) | 0.0 |
| College or Associate's Degree | 2 (100.0%) | 34.0 |
| Bachelor's Degree | 0 (0.0%) | 0.0 |
| Graduate Degree | 0 (0.0%) | 0.0 |
| Total | 2 (100.0%) | 16.0 |
Fertility by Education by Marriage Status in Concrete
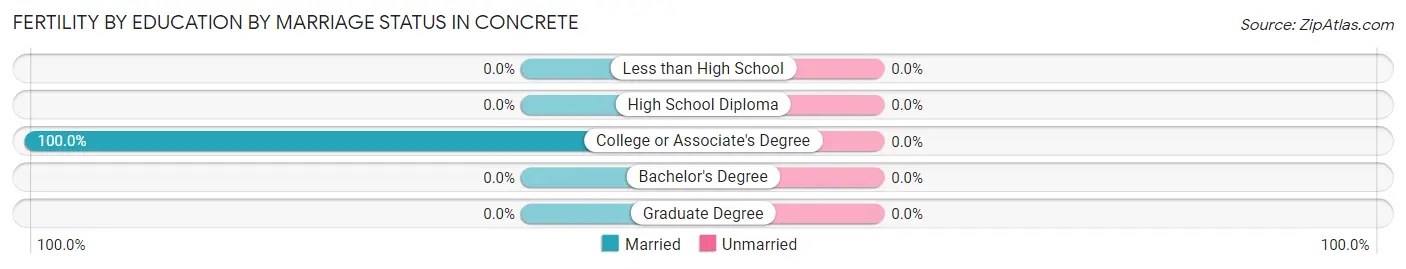
| Educational Attainment | Married | Unmarried |
| Less than High School | 0 (0.0%) | 0 (0.0%) |
| High School Diploma | 0 (0.0%) | 0 (0.0%) |
| College or Associate's Degree | 2 (100.0%) | 0 (0.0%) |
| Bachelor's Degree | 0 (0.0%) | 0 (0.0%) |
| Graduate Degree | 0 (0.0%) | 0 (0.0%) |
| Total | 2 (100.0%) | 0 (0.0%) |
Employment Characteristics in Concrete
Employment by Class of Employer in Concrete
Among the 284 employed individuals in Concrete, private company employees (191 | 67.2%), not-for-profit organizations (30 | 10.6%), and local government employees (25 | 8.8%) make up the most common classes of employment.
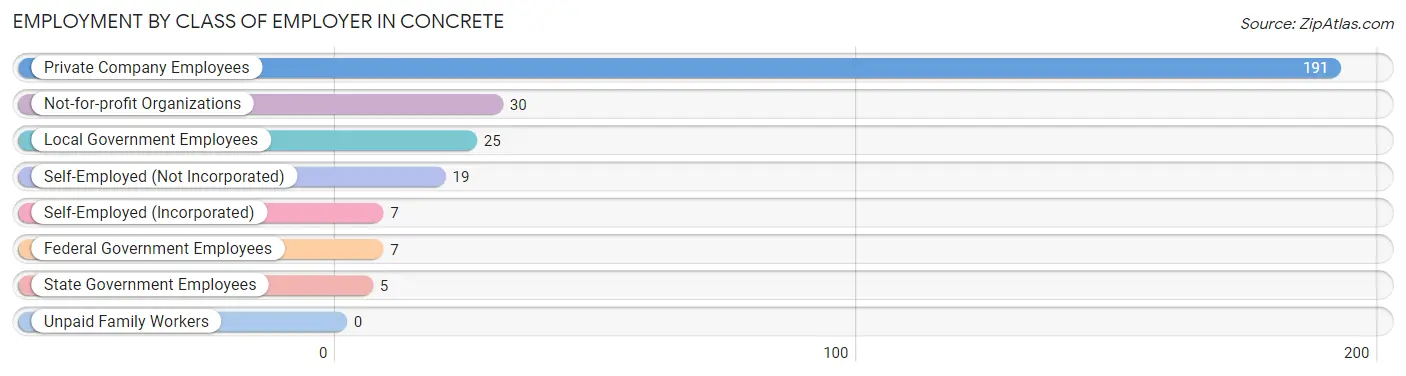
| Employer Class | # Employees | % Employees |
| Private Company Employees | 191 | 67.2% |
| Self-Employed (Incorporated) | 7 | 2.5% |
| Self-Employed (Not Incorporated) | 19 | 6.7% |
| Not-for-profit Organizations | 30 | 10.6% |
| Local Government Employees | 25 | 8.8% |
| State Government Employees | 5 | 1.8% |
| Federal Government Employees | 7 | 2.5% |
| Unpaid Family Workers | 0 | 0.0% |
| Total | 284 | 100.0% |
Employment Status by Age in Concrete
According to the labor force statistics for Concrete, out of the total population over 16 years of age (611), 52.0% or 318 individuals are in the labor force, with 3.8% or 12 of them unemployed. The age group with the highest labor force participation rate is 35 to 44 years, with 79.7% or 59 individuals in the labor force. Within the labor force, the 20 to 24 years age range has the highest percentage of unemployed individuals, with 33.3% or 3 of them being unemployed.
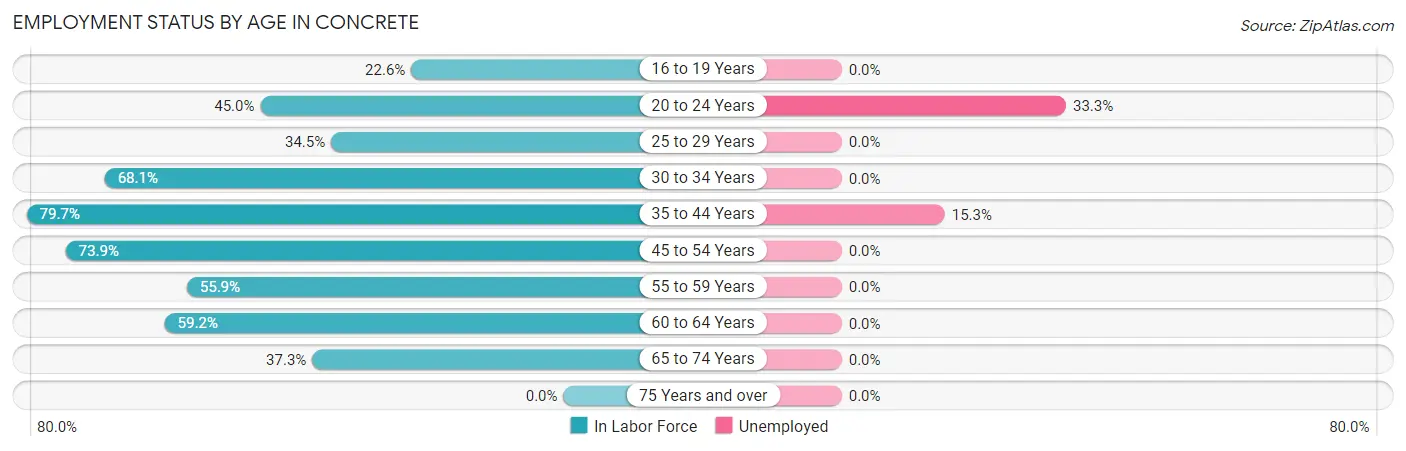
| Age Bracket | In Labor Force | Unemployed |
| 16 to 19 Years | 7 (22.6%) | 0 (0.0%) |
| 20 to 24 Years | 9 (45.0%) | 3 (33.3%) |
| 25 to 29 Years | 40 (34.5%) | 0 (0.0%) |
| 30 to 34 Years | 49 (68.1%) | 0 (0.0%) |
| 35 to 44 Years | 59 (79.7%) | 9 (15.3%) |
| 45 to 54 Years | 51 (73.9%) | 0 (0.0%) |
| 55 to 59 Years | 33 (55.9%) | 0 (0.0%) |
| 60 to 64 Years | 45 (59.2%) | 0 (0.0%) |
| 65 to 74 Years | 25 (37.3%) | 0 (0.0%) |
| 75 Years and over | 0 (0.0%) | 0 (0.0%) |
| Total | 318 (52.0%) | 12 (3.8%) |
Employment Status by Educational Attainment in Concrete
According to labor force statistics for Concrete, 59.4% of individuals (277) out of the total population between 25 and 64 years of age (466) are in the labor force, with 3.2% or 9 of them being unemployed. The group with the highest labor force participation rate are those with the educational attainment of bachelor's degree or higher, with 83.7% or 36 individuals in the labor force. Within the labor force, individuals with less than high school education have the highest percentage of unemployment, with 9.7% or 6 of them being unemployed.
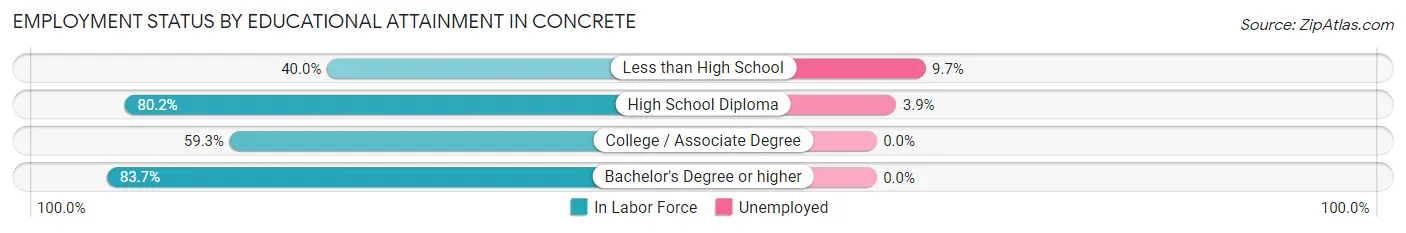
| Educational Attainment | In Labor Force | Unemployed |
| Less than High School | 62 (40.0%) | 15 (9.7%) |
| High School Diploma | 77 (80.2%) | 4 (3.9%) |
| College / Associate Degree | 102 (59.3%) | 0 (0.0%) |
| Bachelor's Degree or higher | 36 (83.7%) | 0 (0.0%) |
| Total | 277 (59.4%) | 15 (3.2%) |
Employment Occupations by Sex in Concrete
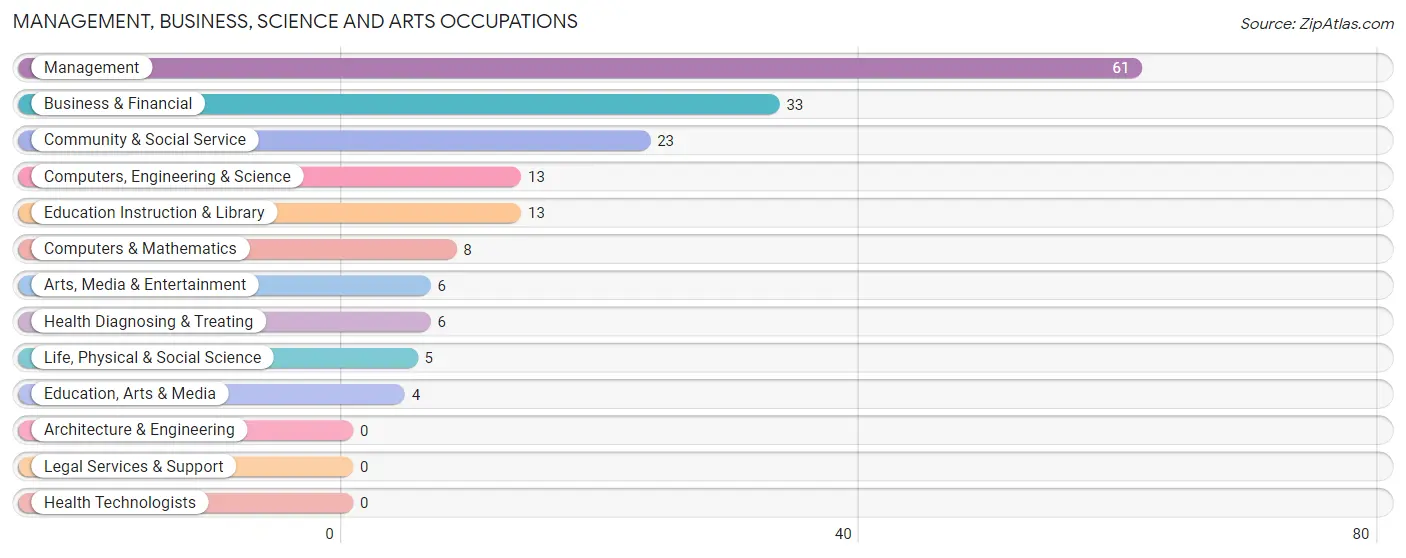
Management, Business, Science and Arts Occupations
The most common Management, Business, Science and Arts occupations in Concrete are Management (61 | 19.9%), Business & Financial (33 | 10.8%), Community & Social Service (23 | 7.5%), Computers, Engineering & Science (13 | 4.3%), and Education Instruction & Library (13 | 4.3%).
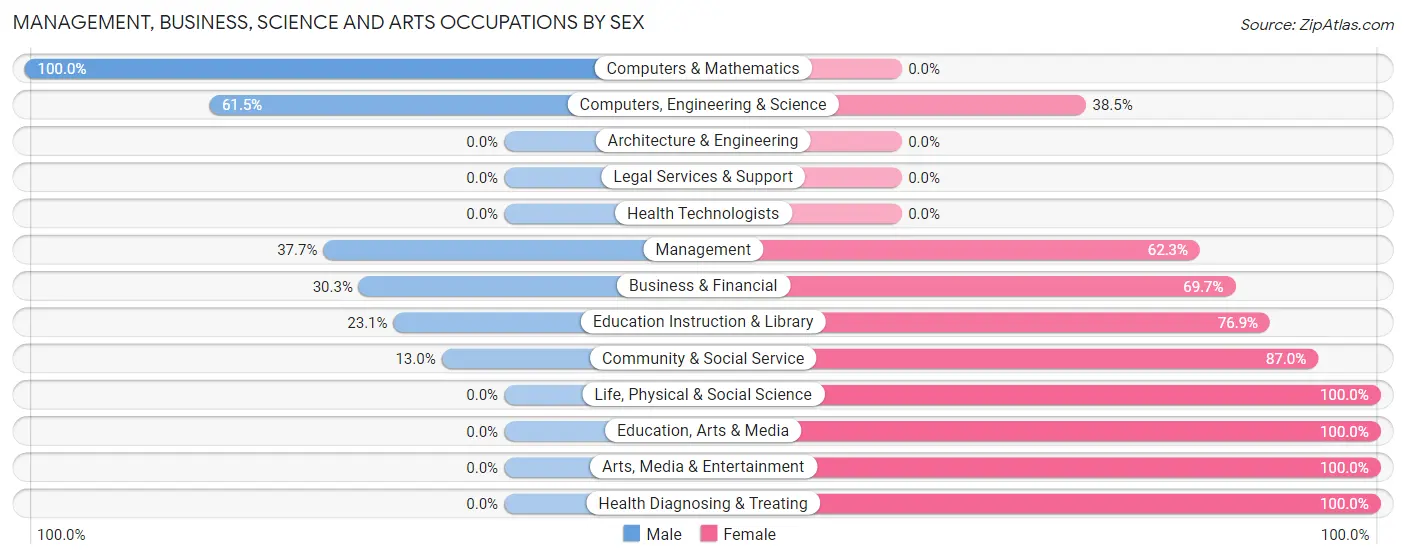
Management, Business, Science and Arts Occupations by Sex
Within the Management, Business, Science and Arts occupations in Concrete, the most male-oriented occupations are Computers & Mathematics (100.0%), Computers, Engineering & Science (61.5%), and Management (37.7%), while the most female-oriented occupations are Life, Physical & Social Science (100.0%), Education, Arts & Media (100.0%), and Arts, Media & Entertainment (100.0%).
| Occupation | Male | Female |
| Management | 23 (37.7%) | 38 (62.3%) |
| Business & Financial | 10 (30.3%) | 23 (69.7%) |
| Computers, Engineering & Science | 8 (61.5%) | 5 (38.5%) |
| Computers & Mathematics | 8 (100.0%) | 0 (0.0%) |
| Architecture & Engineering | 0 (0.0%) | 0 (0.0%) |
| Life, Physical & Social Science | 0 (0.0%) | 5 (100.0%) |
| Community & Social Service | 3 (13.0%) | 20 (87.0%) |
| Education, Arts & Media | 0 (0.0%) | 4 (100.0%) |
| Legal Services & Support | 0 (0.0%) | 0 (0.0%) |
| Education Instruction & Library | 3 (23.1%) | 10 (76.9%) |
| Arts, Media & Entertainment | 0 (0.0%) | 6 (100.0%) |
| Health Diagnosing & Treating | 0 (0.0%) | 6 (100.0%) |
| Health Technologists | 0 (0.0%) | 0 (0.0%) |
| Total (Category) | 44 (32.4%) | 92 (67.6%) |
| Total (Overall) | 155 (50.6%) | 151 (49.3%) |
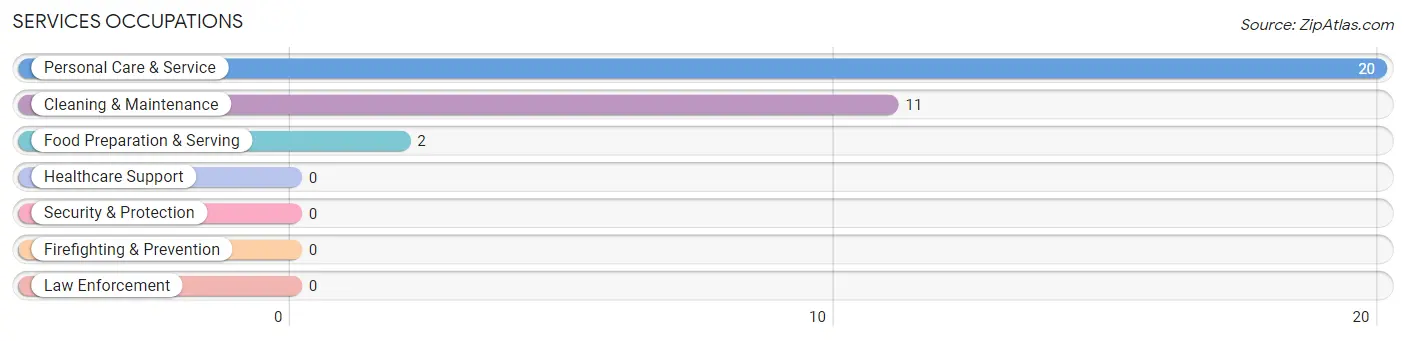
Services Occupations
The most common Services occupations in Concrete are Personal Care & Service (20 | 6.5%), Cleaning & Maintenance (11 | 3.6%), and Food Preparation & Serving (2 | 0.6%).
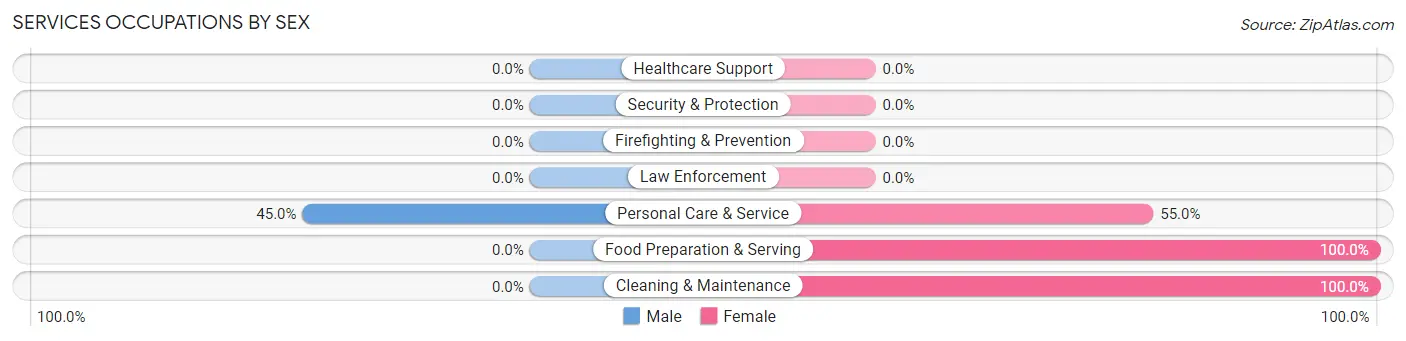
Services Occupations by Sex
| Occupation | Male | Female |
| Healthcare Support | 0 (0.0%) | 0 (0.0%) |
| Security & Protection | 0 (0.0%) | 0 (0.0%) |
| Firefighting & Prevention | 0 (0.0%) | 0 (0.0%) |
| Law Enforcement | 0 (0.0%) | 0 (0.0%) |
| Food Preparation & Serving | 0 (0.0%) | 2 (100.0%) |
| Cleaning & Maintenance | 0 (0.0%) | 11 (100.0%) |
| Personal Care & Service | 9 (45.0%) | 11 (55.0%) |
| Total (Category) | 9 (27.3%) | 24 (72.7%) |
| Total (Overall) | 155 (50.6%) | 151 (49.3%) |
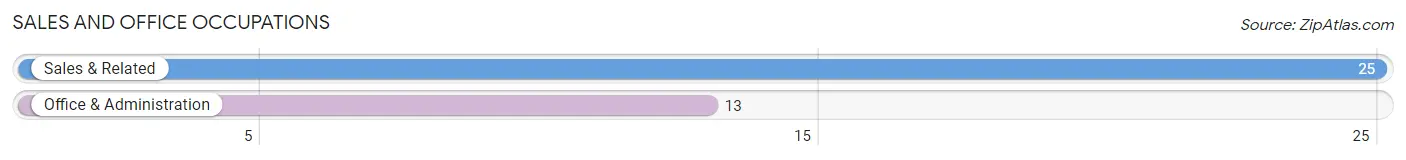
Sales and Office Occupations
The most common Sales and Office occupations in Concrete are Sales & Related (25 | 8.2%), and Office & Administration (13 | 4.3%).
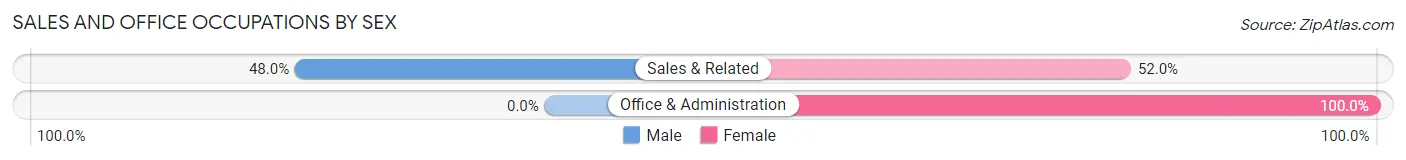
Sales and Office Occupations by Sex
| Occupation | Male | Female |
| Sales & Related | 12 (48.0%) | 13 (52.0%) |
| Office & Administration | 0 (0.0%) | 13 (100.0%) |
| Total (Category) | 12 (31.6%) | 26 (68.4%) |
| Total (Overall) | 155 (50.6%) | 151 (49.3%) |
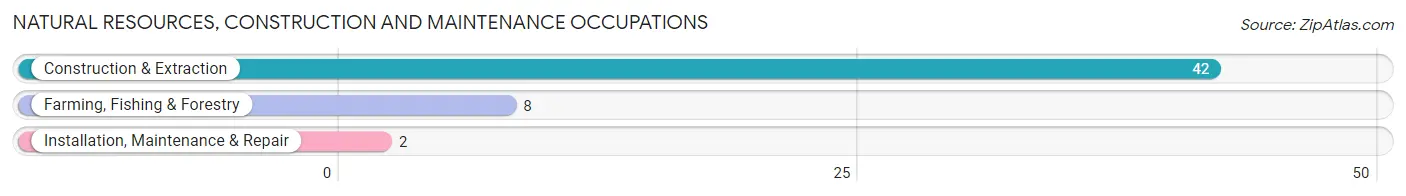
Natural Resources, Construction and Maintenance Occupations
The most common Natural Resources, Construction and Maintenance occupations in Concrete are Construction & Extraction (42 | 13.7%), Farming, Fishing & Forestry (8 | 2.6%), and Installation, Maintenance & Repair (2 | 0.6%).
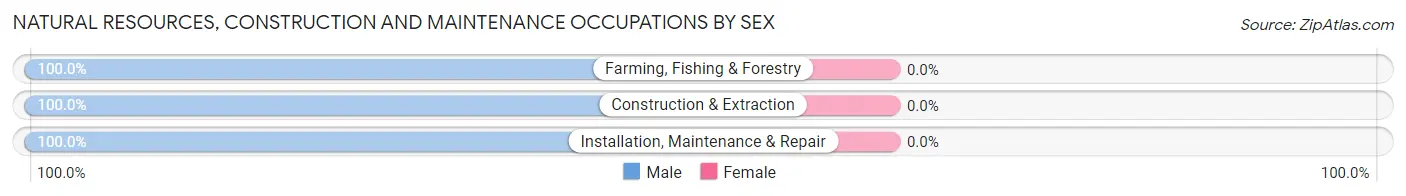
Natural Resources, Construction and Maintenance Occupations by Sex
| Occupation | Male | Female |
| Farming, Fishing & Forestry | 8 (100.0%) | 0 (0.0%) |
| Construction & Extraction | 42 (100.0%) | 0 (0.0%) |
| Installation, Maintenance & Repair | 2 (100.0%) | 0 (0.0%) |
| Total (Category) | 52 (100.0%) | 0 (0.0%) |
| Total (Overall) | 155 (50.6%) | 151 (49.3%) |
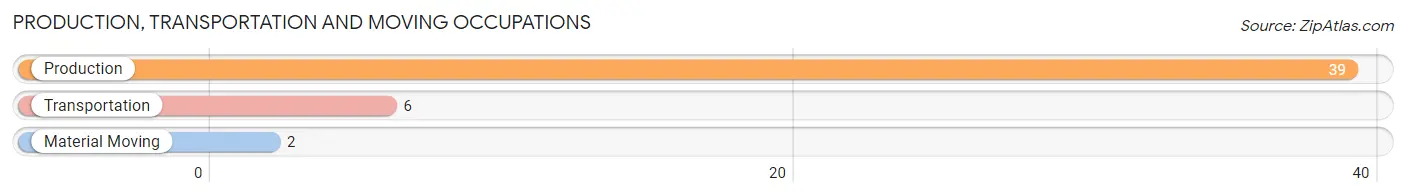
Production, Transportation and Moving Occupations
The most common Production, Transportation and Moving occupations in Concrete are Production (39 | 12.8%), Transportation (6 | 2.0%), and Material Moving (2 | 0.6%).
Production, Transportation and Moving Occupations by Sex
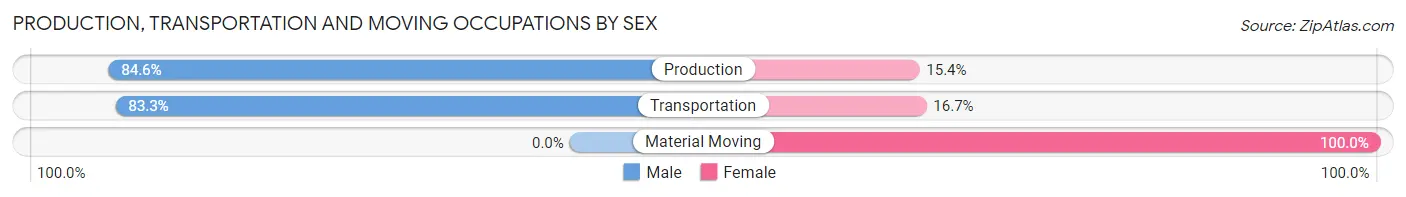
| Occupation | Male | Female |
| Production | 33 (84.6%) | 6 (15.4%) |
| Transportation | 5 (83.3%) | 1 (16.7%) |
| Material Moving | 0 (0.0%) | 2 (100.0%) |
| Total (Category) | 38 (80.8%) | 9 (19.2%) |
| Total (Overall) | 155 (50.6%) | 151 (49.3%) |
Employment Industries by Sex in Concrete
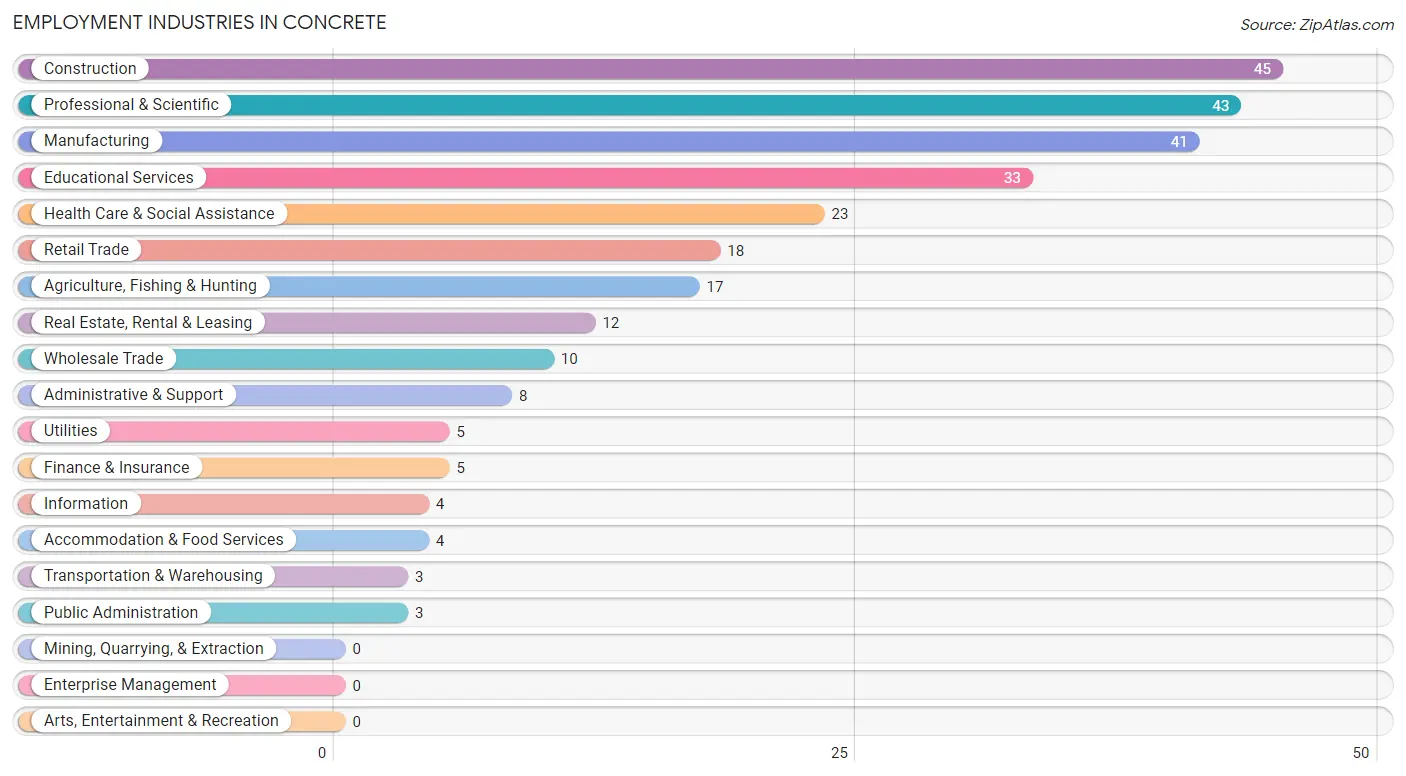
Employment Industries in Concrete
The major employment industries in Concrete include Construction (45 | 14.7%), Professional & Scientific (43 | 14.1%), Manufacturing (41 | 13.4%), Educational Services (33 | 10.8%), and Health Care & Social Assistance (23 | 7.5%).
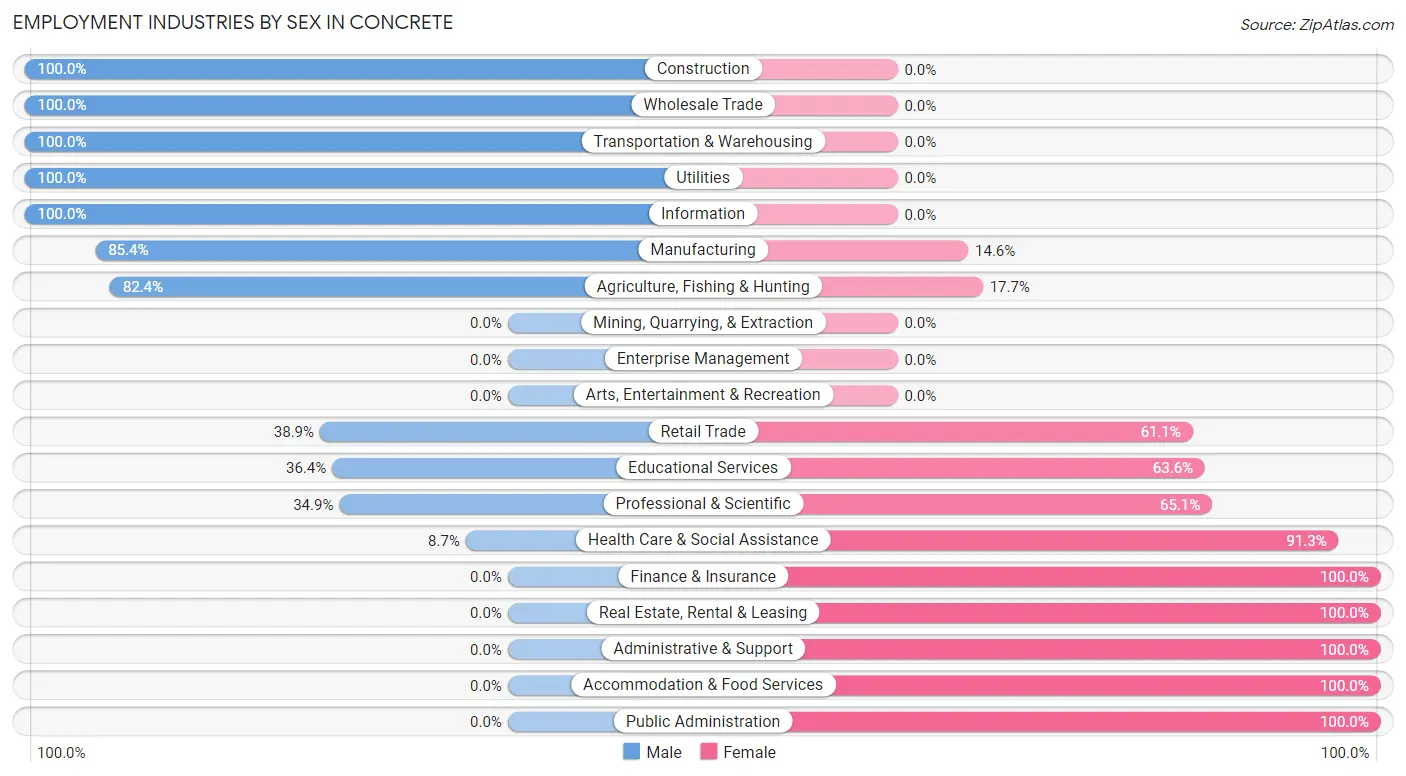
Employment Industries by Sex in Concrete
The Concrete industries that see more men than women are Construction (100.0%), Wholesale Trade (100.0%), and Transportation & Warehousing (100.0%), whereas the industries that tend to have a higher number of women are Finance & Insurance (100.0%), Real Estate, Rental & Leasing (100.0%), and Administrative & Support (100.0%).
| Industry | Male | Female |
| Agriculture, Fishing & Hunting | 14 (82.4%) | 3 (17.6%) |
| Mining, Quarrying, & Extraction | 0 (0.0%) | 0 (0.0%) |
| Construction | 45 (100.0%) | 0 (0.0%) |
| Manufacturing | 35 (85.4%) | 6 (14.6%) |
| Wholesale Trade | 10 (100.0%) | 0 (0.0%) |
| Retail Trade | 7 (38.9%) | 11 (61.1%) |
| Transportation & Warehousing | 3 (100.0%) | 0 (0.0%) |
| Utilities | 5 (100.0%) | 0 (0.0%) |
| Information | 4 (100.0%) | 0 (0.0%) |
| Finance & Insurance | 0 (0.0%) | 5 (100.0%) |
| Real Estate, Rental & Leasing | 0 (0.0%) | 12 (100.0%) |
| Professional & Scientific | 15 (34.9%) | 28 (65.1%) |
| Enterprise Management | 0 (0.0%) | 0 (0.0%) |
| Administrative & Support | 0 (0.0%) | 8 (100.0%) |
| Educational Services | 12 (36.4%) | 21 (63.6%) |
| Health Care & Social Assistance | 2 (8.7%) | 21 (91.3%) |
| Arts, Entertainment & Recreation | 0 (0.0%) | 0 (0.0%) |
| Accommodation & Food Services | 0 (0.0%) | 4 (100.0%) |
| Public Administration | 0 (0.0%) | 3 (100.0%) |
| Total | 155 (50.6%) | 151 (49.3%) |
Education in Concrete
School Enrollment in Concrete
The most common levels of schooling among the 183 students in Concrete are elementary school (123 | 67.2%), college / undergraduate (20 | 10.9%), and high school (19 | 10.4%).
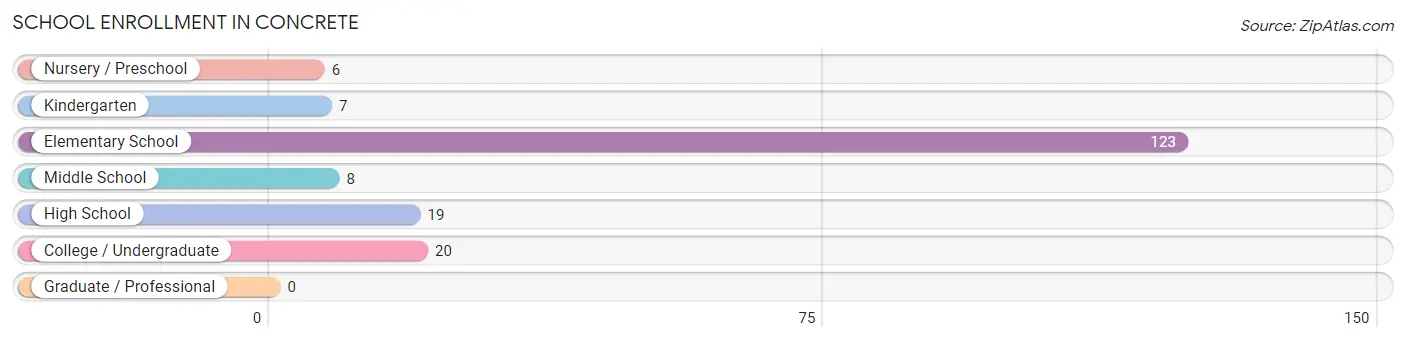
| School Level | # Students | % Students |
| Nursery / Preschool | 6 | 3.3% |
| Kindergarten | 7 | 3.8% |
| Elementary School | 123 | 67.2% |
| Middle School | 8 | 4.4% |
| High School | 19 | 10.4% |
| College / Undergraduate | 20 | 10.9% |
| Graduate / Professional | 0 | 0.0% |
| Total | 183 | 100.0% |
School Enrollment by Age by Funding Source in Concrete
Out of a total of 183 students who are enrolled in schools in Concrete, 26 (14.2%) attend a private institution, while the remaining 157 (85.8%) are enrolled in public schools. The age group of 5 to 9 year old has the highest likelihood of being enrolled in private schools, with 26 (25.0% in the age bracket) enrolled. Conversely, the age group of 3 to 4 year olds has the lowest likelihood of being enrolled in a private school, with 6 (100.0% in the age bracket) attending a public institution.
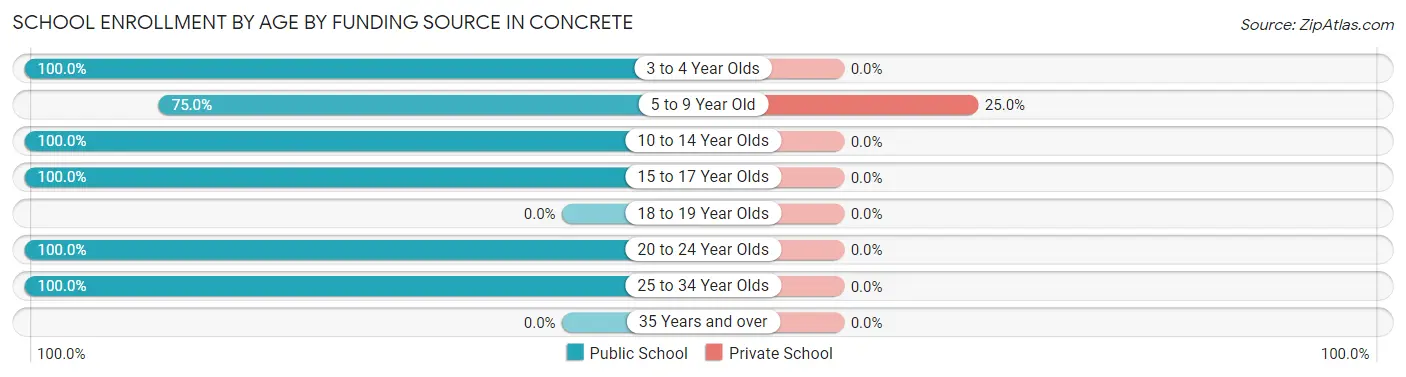
| Age Bracket | Public School | Private School |
| 3 to 4 Year Olds | 6 (100.0%) | 0 (0.0%) |
| 5 to 9 Year Old | 78 (75.0%) | 26 (25.0%) |
| 10 to 14 Year Olds | 37 (100.0%) | 0 (0.0%) |
| 15 to 17 Year Olds | 16 (100.0%) | 0 (0.0%) |
| 18 to 19 Year Olds | 0 (0.0%) | 0 (0.0%) |
| 20 to 24 Year Olds | 3 (100.0%) | 0 (0.0%) |
| 25 to 34 Year Olds | 17 (100.0%) | 0 (0.0%) |
| 35 Years and over | 0 (0.0%) | 0 (0.0%) |
| Total | 157 (85.8%) | 26 (14.2%) |
Educational Attainment by Field of Study in Concrete
Science & technology (10 | 18.9%), psychology (8 | 15.1%), education (7 | 13.2%), liberal arts & history (7 | 13.2%), and arts & humanities (5 | 9.4%) are the most common fields of study among 53 individuals in Concrete who have obtained a bachelor's degree or higher.
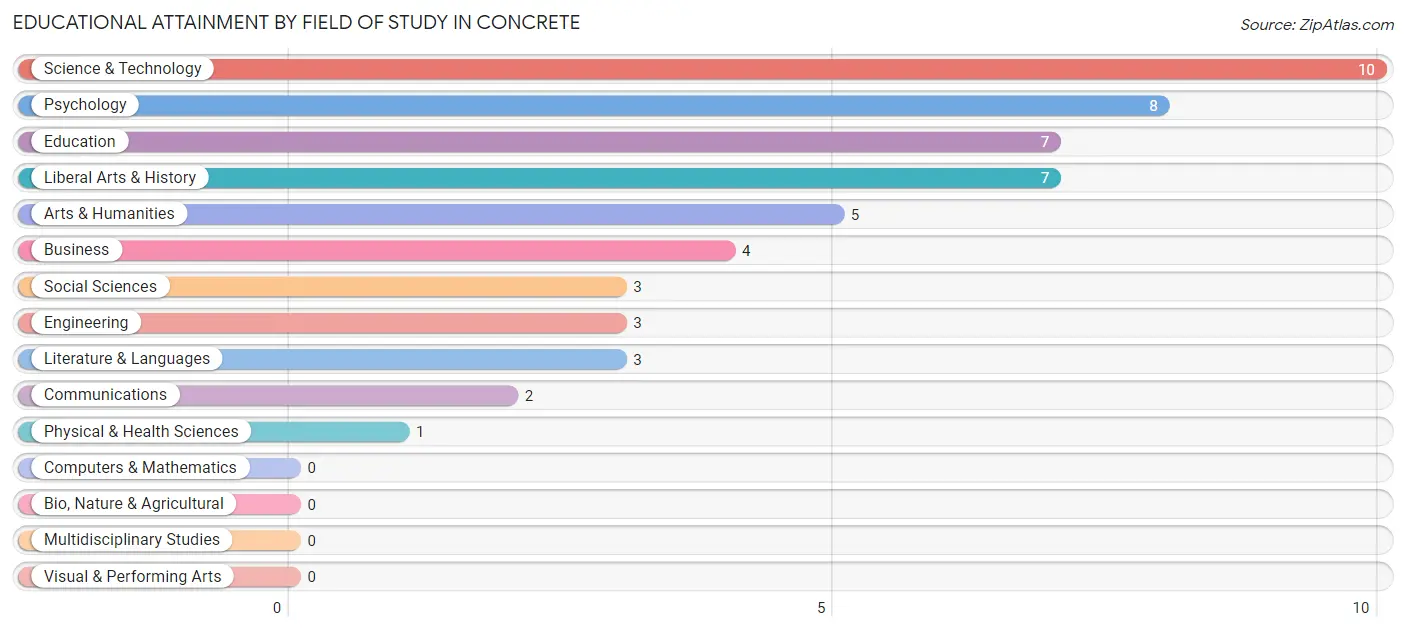
| Field of Study | # Graduates | % Graduates |
| Computers & Mathematics | 0 | 0.0% |
| Bio, Nature & Agricultural | 0 | 0.0% |
| Physical & Health Sciences | 1 | 1.9% |
| Psychology | 8 | 15.1% |
| Social Sciences | 3 | 5.7% |
| Engineering | 3 | 5.7% |
| Multidisciplinary Studies | 0 | 0.0% |
| Science & Technology | 10 | 18.9% |
| Business | 4 | 7.5% |
| Education | 7 | 13.2% |
| Literature & Languages | 3 | 5.7% |
| Liberal Arts & History | 7 | 13.2% |
| Visual & Performing Arts | 0 | 0.0% |
| Communications | 2 | 3.8% |
| Arts & Humanities | 5 | 9.4% |
| Total | 53 | 100.0% |
Transportation & Commute in Concrete
Vehicle Availability by Sex in Concrete
The most prevalent vehicle ownership categories in Concrete are males with 3 vehicles (56, accounting for 39.7%) and females with 3 vehicles (76, making up 40.0%).
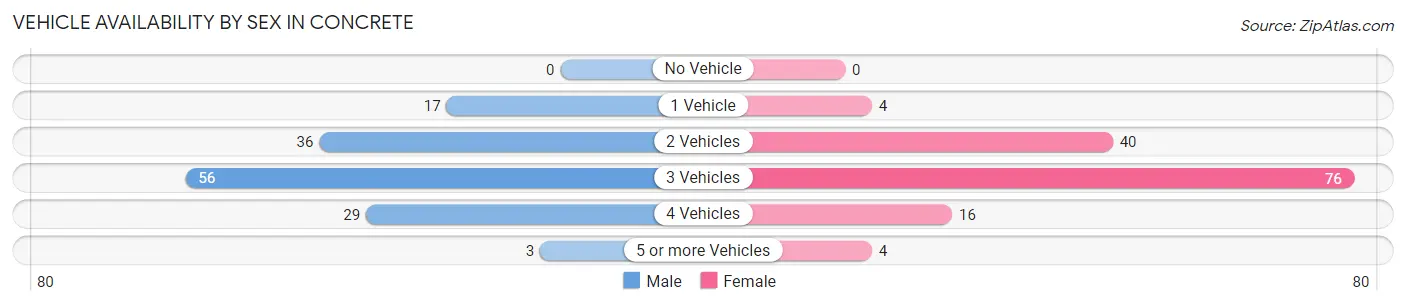
| Vehicles Available | Male | Female |
| No Vehicle | 0 (0.0%) | 0 (0.0%) |
| 1 Vehicle | 17 (12.1%) | 4 (2.9%) |
| 2 Vehicles | 36 (25.5%) | 40 (28.6%) |
| 3 Vehicles | 56 (39.7%) | 76 (54.3%) |
| 4 Vehicles | 29 (20.6%) | 16 (11.4%) |
| 5 or more Vehicles | 3 (2.1%) | 4 (2.9%) |
| Total | 141 (100.0%) | 140 (100.0%) |
Commute Time in Concrete
The most frequently occuring commute durations in Concrete are 60 to 89 minutes (65 commuters, 23.9%), 45 to 59 minutes (54 commuters, 19.9%), and 40 to 44 minutes (41 commuters, 15.1%).
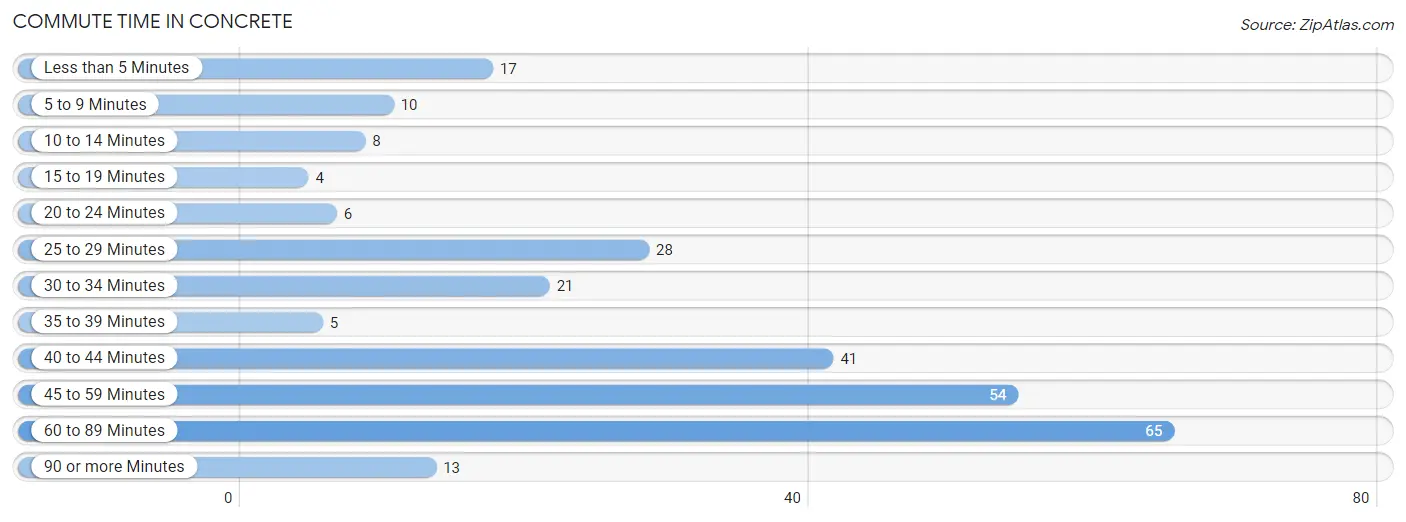
| Commute Time | # Commuters | % Commuters |
| Less than 5 Minutes | 17 | 6.2% |
| 5 to 9 Minutes | 10 | 3.7% |
| 10 to 14 Minutes | 8 | 2.9% |
| 15 to 19 Minutes | 4 | 1.5% |
| 20 to 24 Minutes | 6 | 2.2% |
| 25 to 29 Minutes | 28 | 10.3% |
| 30 to 34 Minutes | 21 | 7.7% |
| 35 to 39 Minutes | 5 | 1.8% |
| 40 to 44 Minutes | 41 | 15.1% |
| 45 to 59 Minutes | 54 | 19.9% |
| 60 to 89 Minutes | 65 | 23.9% |
| 90 or more Minutes | 13 | 4.8% |
Commute Time by Sex in Concrete
The most common commute times in Concrete are 60 to 89 minutes (38 commuters, 27.0%) for males and 40 to 44 minutes (35 commuters, 26.7%) for females.
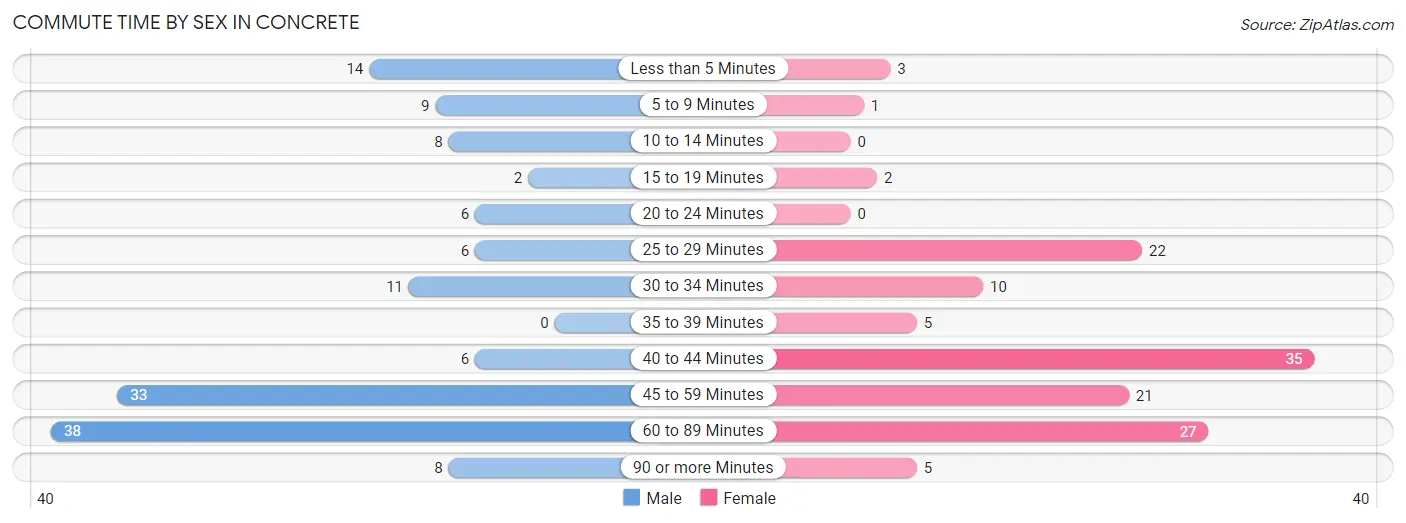
| Commute Time | Male | Female |
| Less than 5 Minutes | 14 (9.9%) | 3 (2.3%) |
| 5 to 9 Minutes | 9 (6.4%) | 1 (0.8%) |
| 10 to 14 Minutes | 8 (5.7%) | 0 (0.0%) |
| 15 to 19 Minutes | 2 (1.4%) | 2 (1.5%) |
| 20 to 24 Minutes | 6 (4.3%) | 0 (0.0%) |
| 25 to 29 Minutes | 6 (4.3%) | 22 (16.8%) |
| 30 to 34 Minutes | 11 (7.8%) | 10 (7.6%) |
| 35 to 39 Minutes | 0 (0.0%) | 5 (3.8%) |
| 40 to 44 Minutes | 6 (4.3%) | 35 (26.7%) |
| 45 to 59 Minutes | 33 (23.4%) | 21 (16.0%) |
| 60 to 89 Minutes | 38 (27.0%) | 27 (20.6%) |
| 90 or more Minutes | 8 (5.7%) | 5 (3.8%) |
Time of Departure to Work by Sex in Concrete
The most frequent times of departure to work in Concrete are 7:00 AM to 7:29 AM (29, 20.6%) for males and 7:30 AM to 7:59 AM (40, 30.5%) for females.
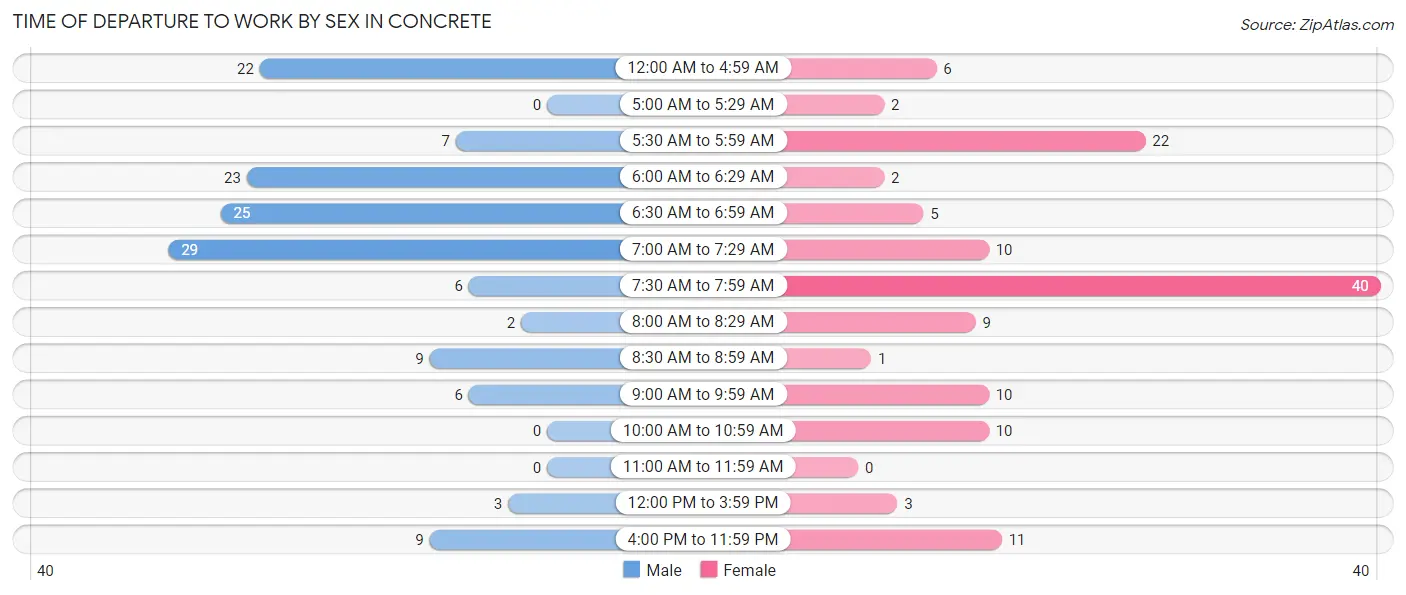
| Time of Departure | Male | Female |
| 12:00 AM to 4:59 AM | 22 (15.6%) | 6 (4.6%) |
| 5:00 AM to 5:29 AM | 0 (0.0%) | 2 (1.5%) |
| 5:30 AM to 5:59 AM | 7 (5.0%) | 22 (16.8%) |
| 6:00 AM to 6:29 AM | 23 (16.3%) | 2 (1.5%) |
| 6:30 AM to 6:59 AM | 25 (17.7%) | 5 (3.8%) |
| 7:00 AM to 7:29 AM | 29 (20.6%) | 10 (7.6%) |
| 7:30 AM to 7:59 AM | 6 (4.3%) | 40 (30.5%) |
| 8:00 AM to 8:29 AM | 2 (1.4%) | 9 (6.9%) |
| 8:30 AM to 8:59 AM | 9 (6.4%) | 1 (0.8%) |
| 9:00 AM to 9:59 AM | 6 (4.3%) | 10 (7.6%) |
| 10:00 AM to 10:59 AM | 0 (0.0%) | 10 (7.6%) |
| 11:00 AM to 11:59 AM | 0 (0.0%) | 0 (0.0%) |
| 12:00 PM to 3:59 PM | 3 (2.1%) | 3 (2.3%) |
| 4:00 PM to 11:59 PM | 9 (6.4%) | 11 (8.4%) |
| Total | 141 (100.0%) | 131 (100.0%) |
Housing Occupancy in Concrete
Occupancy by Ownership in Concrete
Of the total 351 dwellings in Concrete, owner-occupied units account for 259 (73.8%), while renter-occupied units make up 92 (26.2%).
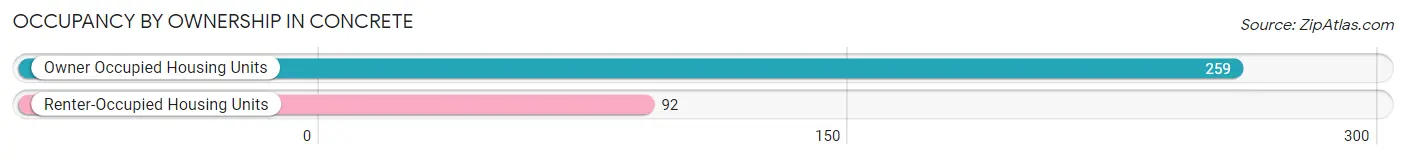
| Occupancy | # Housing Units | % Housing Units |
| Owner Occupied Housing Units | 259 | 73.8% |
| Renter-Occupied Housing Units | 92 | 26.2% |
| Total Occupied Housing Units | 351 | 100.0% |
Occupancy by Household Size in Concrete
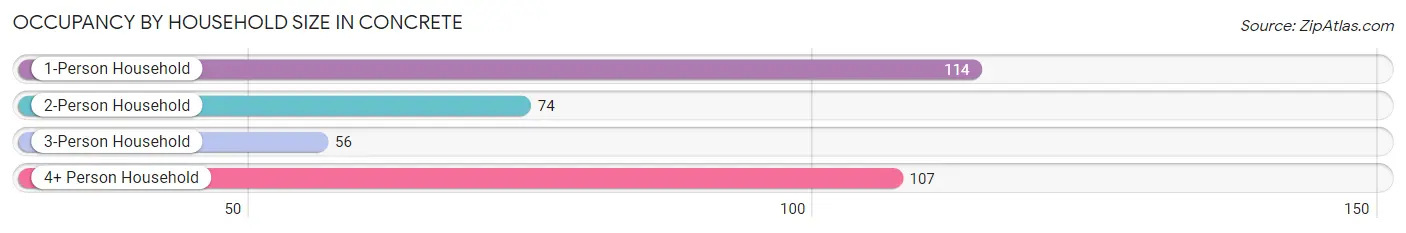
| Household Size | # Housing Units | % Housing Units |
| 1-Person Household | 114 | 32.5% |
| 2-Person Household | 74 | 21.1% |
| 3-Person Household | 56 | 16.0% |
| 4+ Person Household | 107 | 30.5% |
| Total Housing Units | 351 | 100.0% |
Occupancy by Ownership by Household Size in Concrete
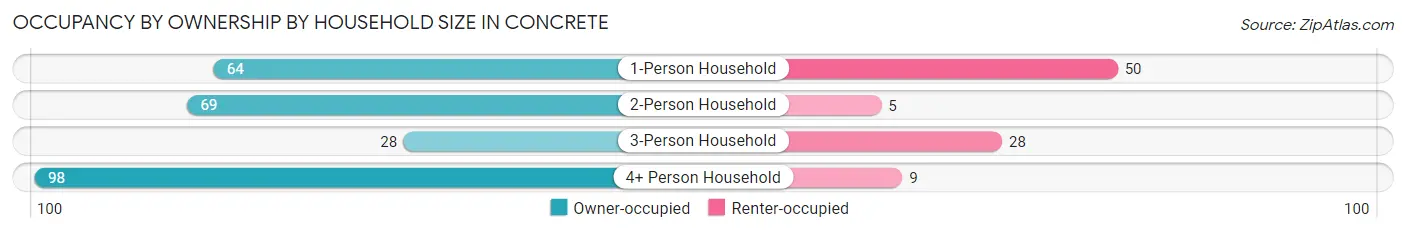
| Household Size | Owner-occupied | Renter-occupied |
| 1-Person Household | 64 (56.1%) | 50 (43.9%) |
| 2-Person Household | 69 (93.2%) | 5 (6.8%) |
| 3-Person Household | 28 (50.0%) | 28 (50.0%) |
| 4+ Person Household | 98 (91.6%) | 9 (8.4%) |
| Total Housing Units | 259 (73.8%) | 92 (26.2%) |
Occupancy by Educational Attainment in Concrete
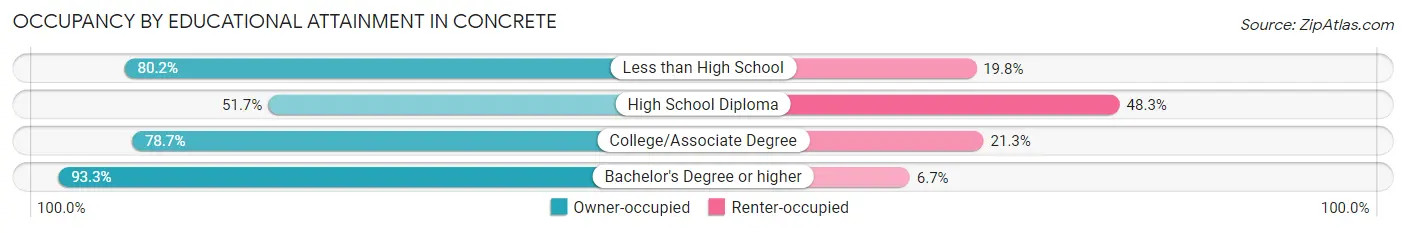
| Household Size | Owner-occupied | Renter-occupied |
| Less than High School | 101 (80.2%) | 25 (19.8%) |
| High School Diploma | 45 (51.7%) | 42 (48.3%) |
| College/Associate Degree | 85 (78.7%) | 23 (21.3%) |
| Bachelor's Degree or higher | 28 (93.3%) | 2 (6.7%) |
Occupancy by Age of Householder in Concrete
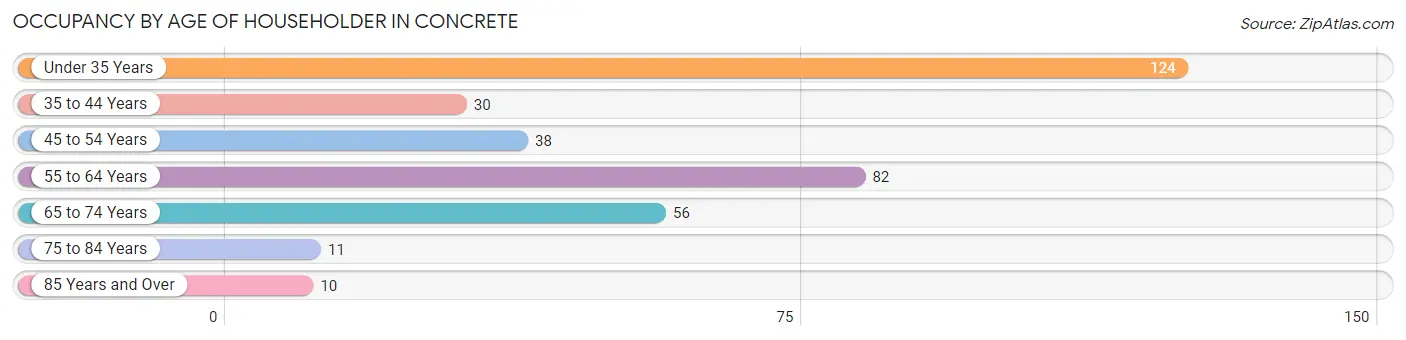
| Age Bracket | # Households | % Households |
| Under 35 Years | 124 | 35.3% |
| 35 to 44 Years | 30 | 8.6% |
| 45 to 54 Years | 38 | 10.8% |
| 55 to 64 Years | 82 | 23.4% |
| 65 to 74 Years | 56 | 16.0% |
| 75 to 84 Years | 11 | 3.1% |
| 85 Years and Over | 10 | 2.9% |
| Total | 351 | 100.0% |
Housing Finances in Concrete
Median Income by Occupancy in Concrete
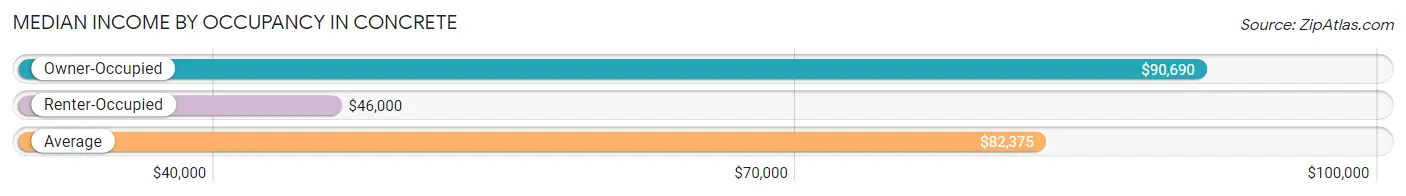
| Occupancy Type | # Households | Median Income |
| Owner-Occupied | 259 (73.8%) | $90,690 |
| Renter-Occupied | 92 (26.2%) | $46,000 |
| Average | 351 (100.0%) | $82,375 |
Occupancy by Householder Income Bracket in Concrete
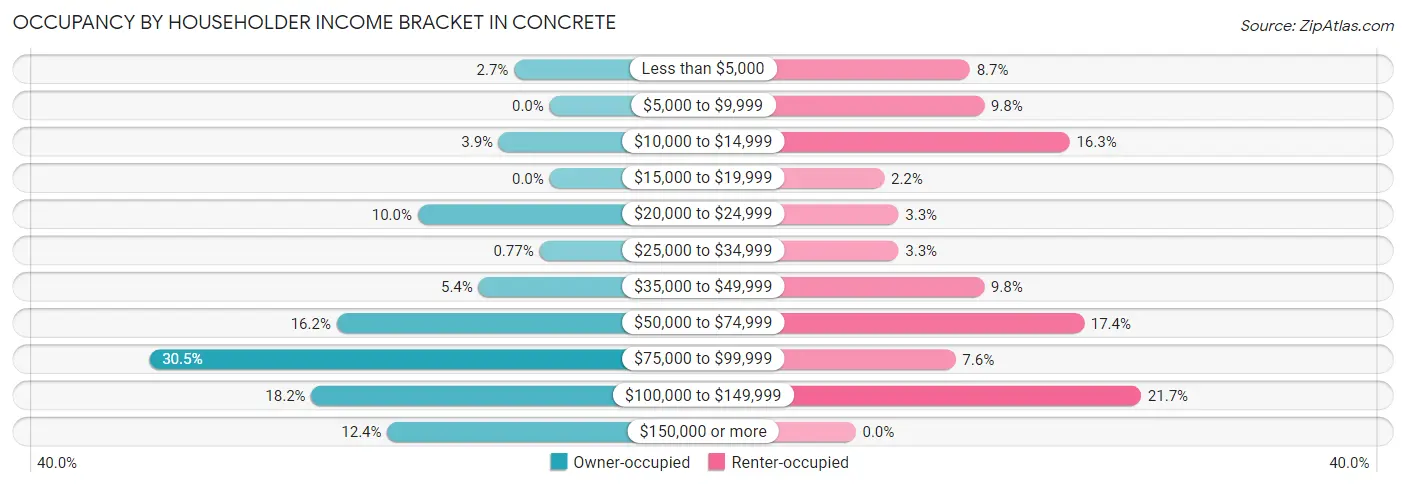
| Income Bracket | Owner-occupied | Renter-occupied |
| Less than $5,000 | 7 (2.7%) | 8 (8.7%) |
| $5,000 to $9,999 | 0 (0.0%) | 9 (9.8%) |
| $10,000 to $14,999 | 10 (3.9%) | 15 (16.3%) |
| $15,000 to $19,999 | 0 (0.0%) | 2 (2.2%) |
| $20,000 to $24,999 | 26 (10.0%) | 3 (3.3%) |
| $25,000 to $34,999 | 2 (0.8%) | 3 (3.3%) |
| $35,000 to $49,999 | 14 (5.4%) | 9 (9.8%) |
| $50,000 to $74,999 | 42 (16.2%) | 16 (17.4%) |
| $75,000 to $99,999 | 79 (30.5%) | 7 (7.6%) |
| $100,000 to $149,999 | 47 (18.1%) | 20 (21.7%) |
| $150,000 or more | 32 (12.4%) | 0 (0.0%) |
| Total | 259 (100.0%) | 92 (100.0%) |
Monthly Housing Cost Tiers in Concrete
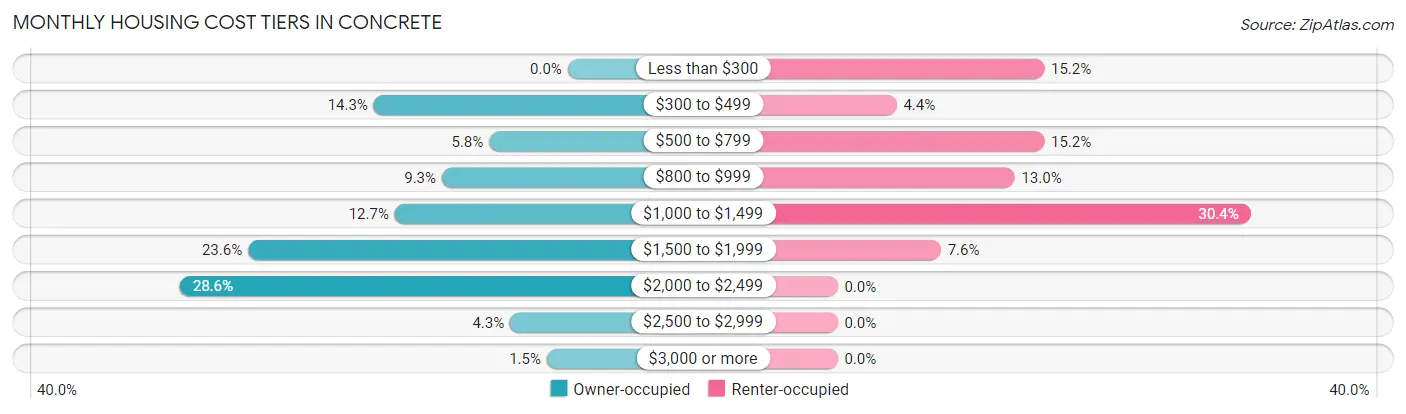
| Monthly Cost | Owner-occupied | Renter-occupied |
| Less than $300 | 0 (0.0%) | 14 (15.2%) |
| $300 to $499 | 37 (14.3%) | 4 (4.3%) |
| $500 to $799 | 15 (5.8%) | 14 (15.2%) |
| $800 to $999 | 24 (9.3%) | 12 (13.0%) |
| $1,000 to $1,499 | 33 (12.7%) | 28 (30.4%) |
| $1,500 to $1,999 | 61 (23.5%) | 7 (7.6%) |
| $2,000 to $2,499 | 74 (28.6%) | 0 (0.0%) |
| $2,500 to $2,999 | 11 (4.3%) | 0 (0.0%) |
| $3,000 or more | 4 (1.5%) | 0 (0.0%) |
| Total | 259 (100.0%) | 92 (100.0%) |
Physical Housing Characteristics in Concrete
Housing Structures in Concrete
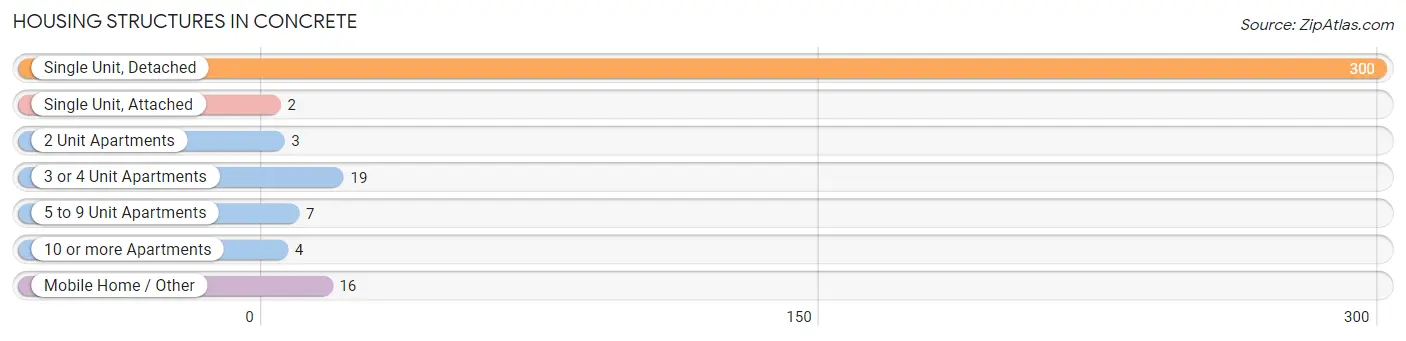
| Structure Type | # Housing Units | % Housing Units |
| Single Unit, Detached | 300 | 85.5% |
| Single Unit, Attached | 2 | 0.6% |
| 2 Unit Apartments | 3 | 0.9% |
| 3 or 4 Unit Apartments | 19 | 5.4% |
| 5 to 9 Unit Apartments | 7 | 2.0% |
| 10 or more Apartments | 4 | 1.1% |
| Mobile Home / Other | 16 | 4.6% |
| Total | 351 | 100.0% |
Housing Structures by Occupancy in Concrete
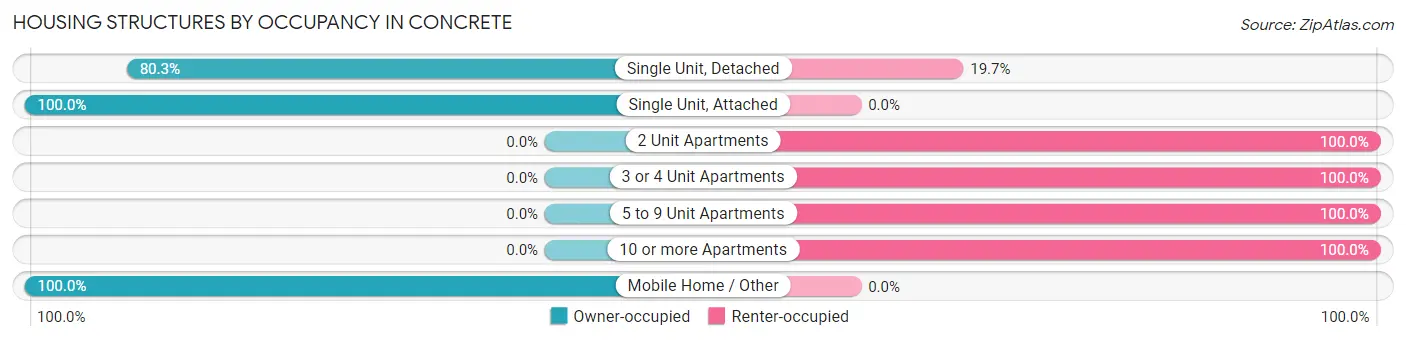
| Structure Type | Owner-occupied | Renter-occupied |
| Single Unit, Detached | 241 (80.3%) | 59 (19.7%) |
| Single Unit, Attached | 2 (100.0%) | 0 (0.0%) |
| 2 Unit Apartments | 0 (0.0%) | 3 (100.0%) |
| 3 or 4 Unit Apartments | 0 (0.0%) | 19 (100.0%) |
| 5 to 9 Unit Apartments | 0 (0.0%) | 7 (100.0%) |
| 10 or more Apartments | 0 (0.0%) | 4 (100.0%) |
| Mobile Home / Other | 16 (100.0%) | 0 (0.0%) |
| Total | 259 (73.8%) | 92 (26.2%) |
Housing Structures by Number of Rooms in Concrete
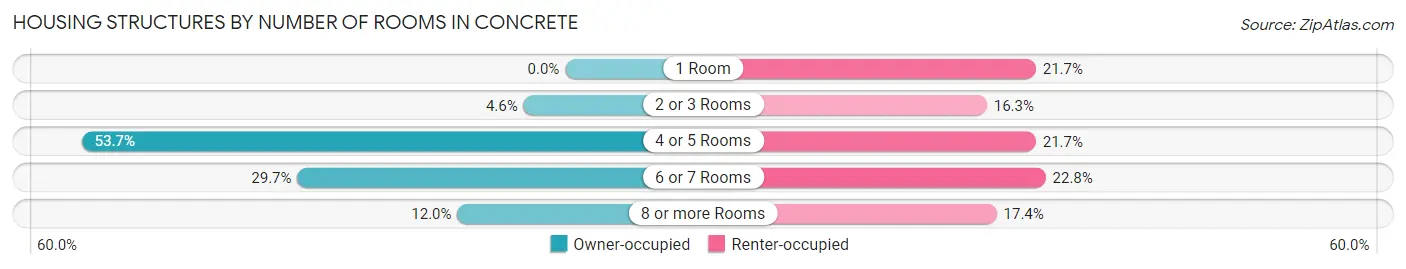
| Number of Rooms | Owner-occupied | Renter-occupied |
| 1 Room | 0 (0.0%) | 20 (21.7%) |
| 2 or 3 Rooms | 12 (4.6%) | 15 (16.3%) |
| 4 or 5 Rooms | 139 (53.7%) | 20 (21.7%) |
| 6 or 7 Rooms | 77 (29.7%) | 21 (22.8%) |
| 8 or more Rooms | 31 (12.0%) | 16 (17.4%) |
| Total | 259 (100.0%) | 92 (100.0%) |
Housing Structure by Heating Type in Concrete
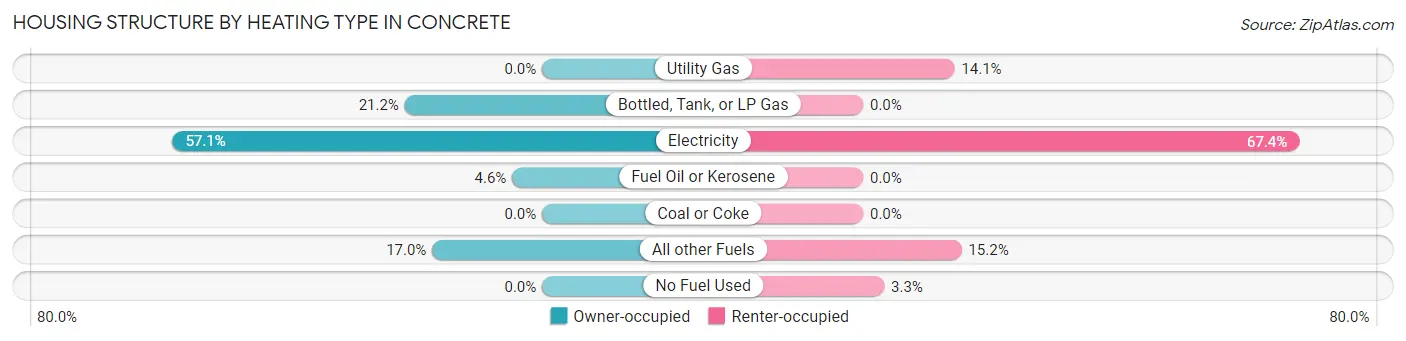
| Heating Type | Owner-occupied | Renter-occupied |
| Utility Gas | 0 (0.0%) | 13 (14.1%) |
| Bottled, Tank, or LP Gas | 55 (21.2%) | 0 (0.0%) |
| Electricity | 148 (57.1%) | 62 (67.4%) |
| Fuel Oil or Kerosene | 12 (4.6%) | 0 (0.0%) |
| Coal or Coke | 0 (0.0%) | 0 (0.0%) |
| All other Fuels | 44 (17.0%) | 14 (15.2%) |
| No Fuel Used | 0 (0.0%) | 3 (3.3%) |
| Total | 259 (100.0%) | 92 (100.0%) |
Household Vehicle Usage in Concrete
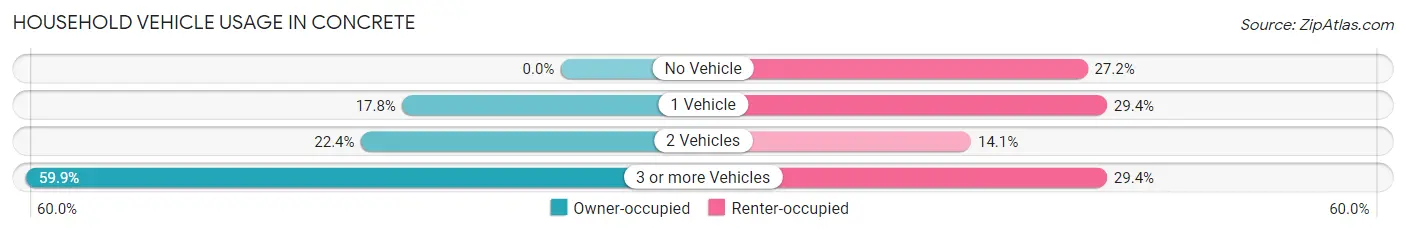
| Vehicles per Household | Owner-occupied | Renter-occupied |
| No Vehicle | 0 (0.0%) | 25 (27.2%) |
| 1 Vehicle | 46 (17.8%) | 27 (29.3%) |
| 2 Vehicles | 58 (22.4%) | 13 (14.1%) |
| 3 or more Vehicles | 155 (59.9%) | 27 (29.3%) |
| Total | 259 (100.0%) | 92 (100.0%) |
Real Estate & Mortgages in Concrete
Real Estate and Mortgage Overview in Concrete
| Characteristic | Without Mortgage | With Mortgage |
| Housing Units | 82 | 177 |
| Median Property Value | $222,900 | $319,700 |
| Median Household Income | $48,750 | $26 |
| Monthly Housing Costs | $544 | $4 |
| Real Estate Taxes | $1,485 | $73 |
Property Value by Mortgage Status in Concrete
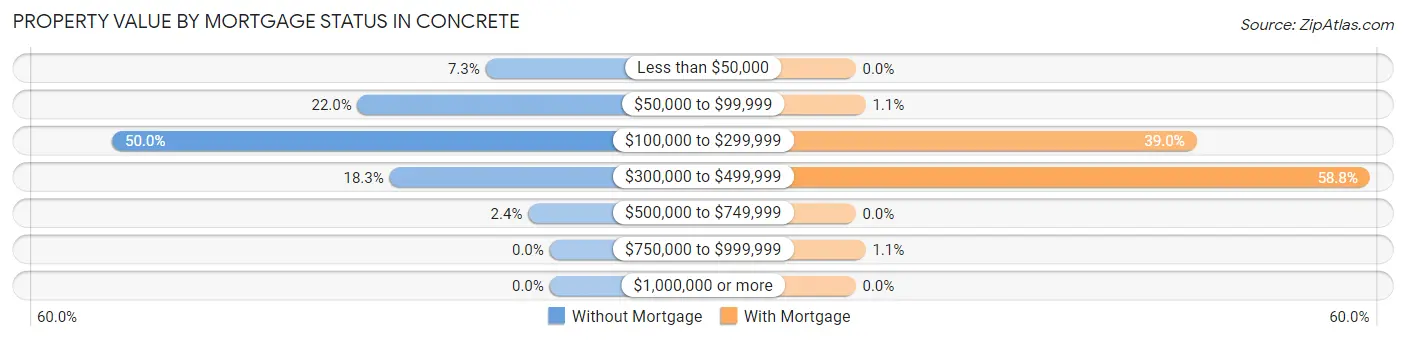
| Property Value | Without Mortgage | With Mortgage |
| Less than $50,000 | 6 (7.3%) | 0 (0.0%) |
| $50,000 to $99,999 | 18 (22.0%) | 2 (1.1%) |
| $100,000 to $299,999 | 41 (50.0%) | 69 (39.0%) |
| $300,000 to $499,999 | 15 (18.3%) | 104 (58.8%) |
| $500,000 to $749,999 | 2 (2.4%) | 0 (0.0%) |
| $750,000 to $999,999 | 0 (0.0%) | 2 (1.1%) |
| $1,000,000 or more | 0 (0.0%) | 0 (0.0%) |
| Total | 82 (100.0%) | 177 (100.0%) |
Household Income by Mortgage Status in Concrete
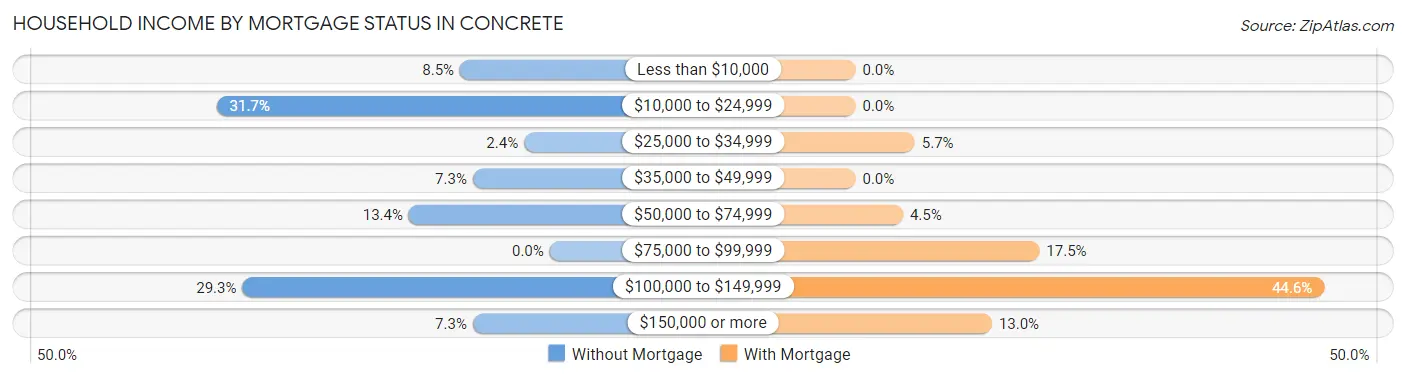
| Household Income | Without Mortgage | With Mortgage |
| Less than $10,000 | 7 (8.5%) | 0 (0.0%) |
| $10,000 to $24,999 | 26 (31.7%) | 0 (0.0%) |
| $25,000 to $34,999 | 2 (2.4%) | 10 (5.7%) |
| $35,000 to $49,999 | 6 (7.3%) | 0 (0.0%) |
| $50,000 to $74,999 | 11 (13.4%) | 8 (4.5%) |
| $75,000 to $99,999 | 0 (0.0%) | 31 (17.5%) |
| $100,000 to $149,999 | 24 (29.3%) | 79 (44.6%) |
| $150,000 or more | 6 (7.3%) | 23 (13.0%) |
| Total | 82 (100.0%) | 177 (100.0%) |
Property Value to Household Income Ratio in Concrete
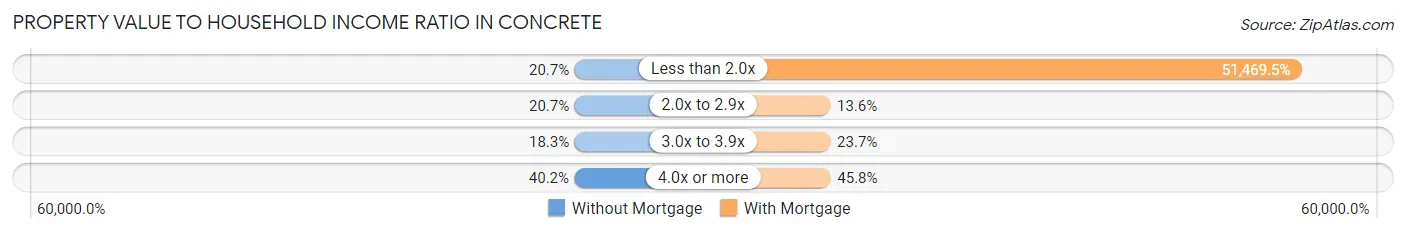
| Value-to-Income Ratio | Without Mortgage | With Mortgage |
| Less than 2.0x | 17 (20.7%) | 91,101 (51,469.5%) |
| 2.0x to 2.9x | 17 (20.7%) | 24 (13.6%) |
| 3.0x to 3.9x | 15 (18.3%) | 42 (23.7%) |
| 4.0x or more | 33 (40.2%) | 81 (45.8%) |
| Total | 82 (100.0%) | 177 (100.0%) |
Real Estate Taxes by Mortgage Status in Concrete
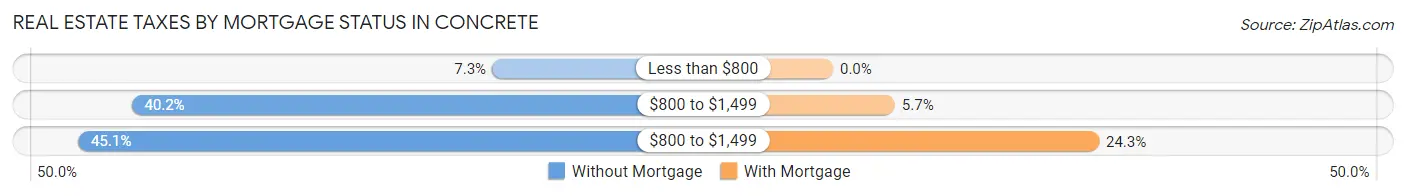
| Property Taxes | Without Mortgage | With Mortgage |
| Less than $800 | 6 (7.3%) | 0 (0.0%) |
| $800 to $1,499 | 33 (40.2%) | 10 (5.7%) |
| $800 to $1,499 | 37 (45.1%) | 43 (24.3%) |
| Total | 82 (100.0%) | 177 (100.0%) |
Health & Disability in Concrete
Health Insurance Coverage by Age in Concrete
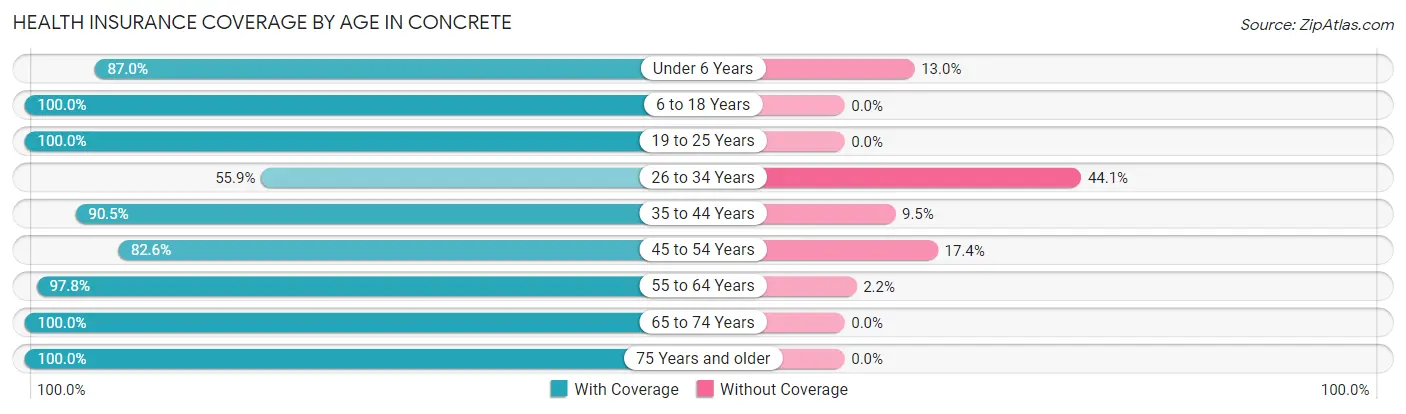
| Age Bracket | With Coverage | Without Coverage |
| Under 6 Years | 40 (87.0%) | 6 (13.0%) |
| 6 to 18 Years | 162 (100.0%) | 0 (0.0%) |
| 19 to 25 Years | 33 (100.0%) | 0 (0.0%) |
| 26 to 34 Years | 100 (55.9%) | 79 (44.1%) |
| 35 to 44 Years | 67 (90.5%) | 7 (9.5%) |
| 45 to 54 Years | 57 (82.6%) | 12 (17.4%) |
| 55 to 64 Years | 132 (97.8%) | 3 (2.2%) |
| 65 to 74 Years | 67 (100.0%) | 0 (0.0%) |
| 75 Years and older | 27 (100.0%) | 0 (0.0%) |
| Total | 685 (86.5%) | 107 (13.5%) |
Health Insurance Coverage by Citizenship Status in Concrete
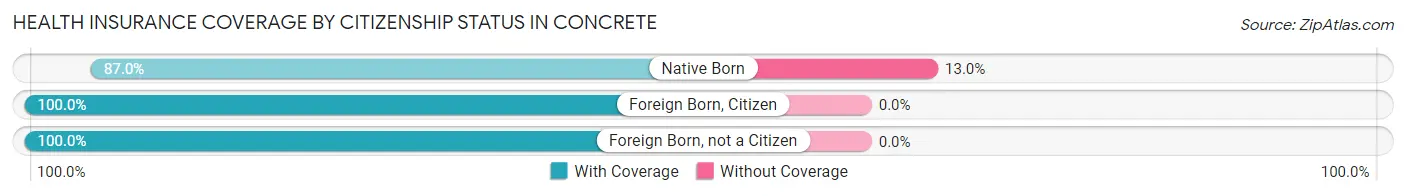
| Citizenship Status | With Coverage | Without Coverage |
| Native Born | 40 (87.0%) | 6 (13.0%) |
| Foreign Born, Citizen | 162 (100.0%) | 0 (0.0%) |
| Foreign Born, not a Citizen | 33 (100.0%) | 0 (0.0%) |
Health Insurance Coverage by Household Income in Concrete
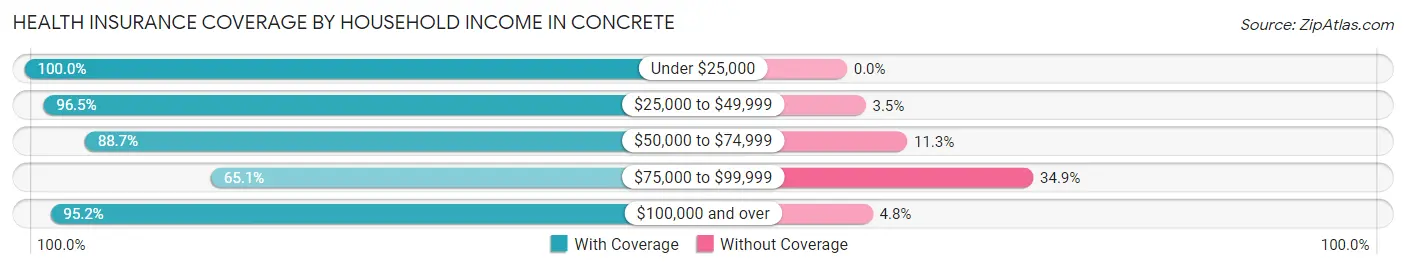
| Household Income | With Coverage | Without Coverage |
| Under $25,000 | 107 (100.0%) | 0 (0.0%) |
| $25,000 to $49,999 | 55 (96.5%) | 2 (3.5%) |
| $50,000 to $74,999 | 110 (88.7%) | 14 (11.3%) |
| $75,000 to $99,999 | 138 (65.1%) | 74 (34.9%) |
| $100,000 and over | 275 (95.2%) | 14 (4.8%) |
Public vs Private Health Insurance Coverage by Age in Concrete
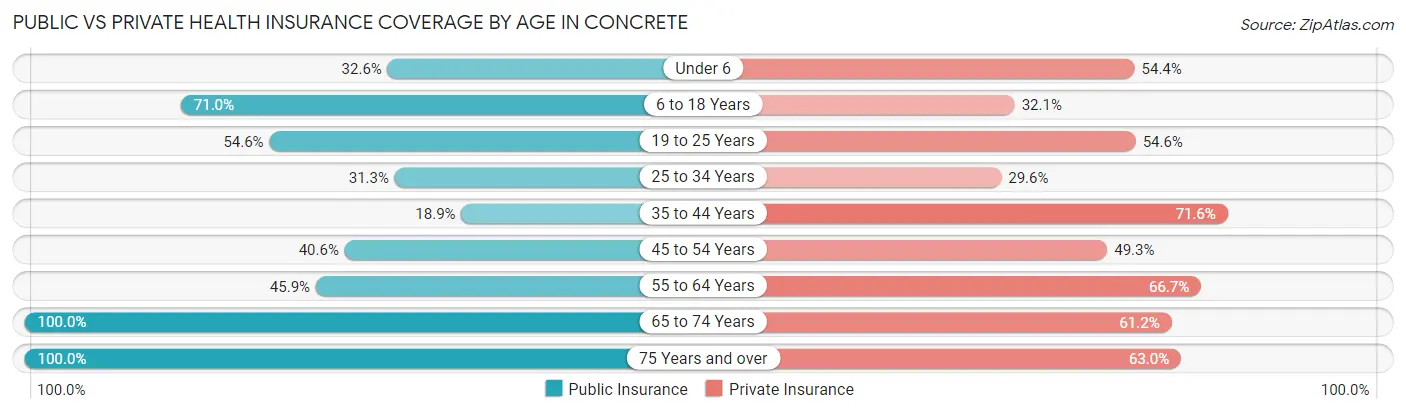
| Age Bracket | Public Insurance | Private Insurance |
| Under 6 | 15 (32.6%) | 25 (54.3%) |
| 6 to 18 Years | 115 (71.0%) | 52 (32.1%) |
| 19 to 25 Years | 18 (54.5%) | 18 (54.5%) |
| 25 to 34 Years | 56 (31.3%) | 53 (29.6%) |
| 35 to 44 Years | 14 (18.9%) | 53 (71.6%) |
| 45 to 54 Years | 28 (40.6%) | 34 (49.3%) |
| 55 to 64 Years | 62 (45.9%) | 90 (66.7%) |
| 65 to 74 Years | 67 (100.0%) | 41 (61.2%) |
| 75 Years and over | 27 (100.0%) | 17 (63.0%) |
| Total | 402 (50.8%) | 383 (48.4%) |
Disability Status by Sex by Age in Concrete
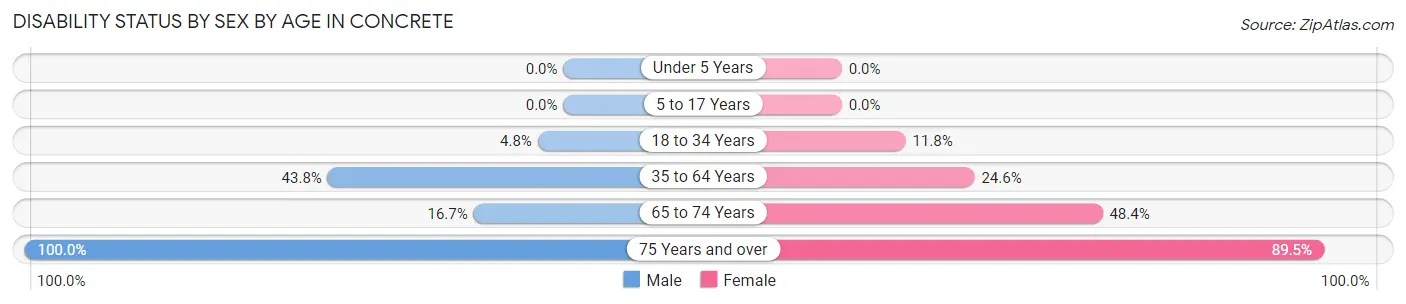
| Age Bracket | Male | Female |
| Under 5 Years | 0 (0.0%) | 0 (0.0%) |
| 5 to 17 Years | 0 (0.0%) | 0 (0.0%) |
| 18 to 34 Years | 7 (4.8%) | 9 (11.8%) |
| 35 to 64 Years | 63 (43.8%) | 33 (24.6%) |
| 65 to 74 Years | 6 (16.7%) | 15 (48.4%) |
| 75 Years and over | 8 (100.0%) | 17 (89.5%) |
Disability Class by Sex by Age in Concrete
Disability Class: Hearing Difficulty
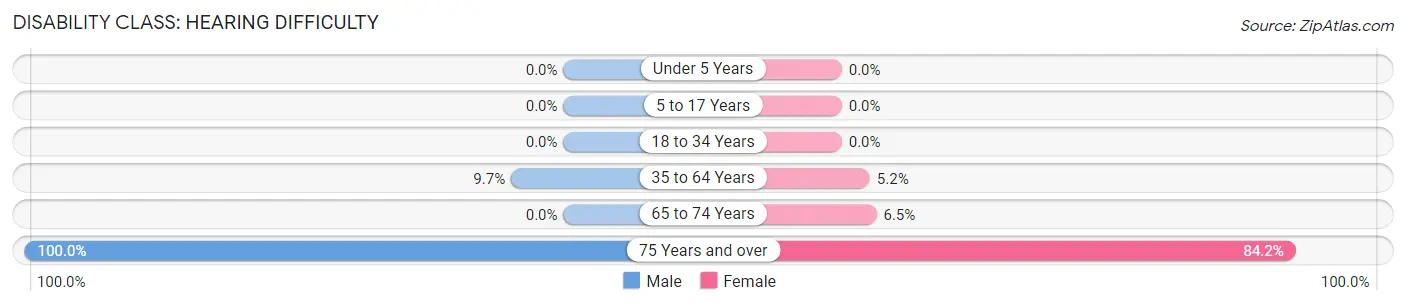
| Age Bracket | Male | Female |
| Under 5 Years | 0 (0.0%) | 0 (0.0%) |
| 5 to 17 Years | 0 (0.0%) | 0 (0.0%) |
| 18 to 34 Years | 0 (0.0%) | 0 (0.0%) |
| 35 to 64 Years | 14 (9.7%) | 7 (5.2%) |
| 65 to 74 Years | 0 (0.0%) | 2 (6.5%) |
| 75 Years and over | 8 (100.0%) | 16 (84.2%) |
Disability Class: Vision Difficulty
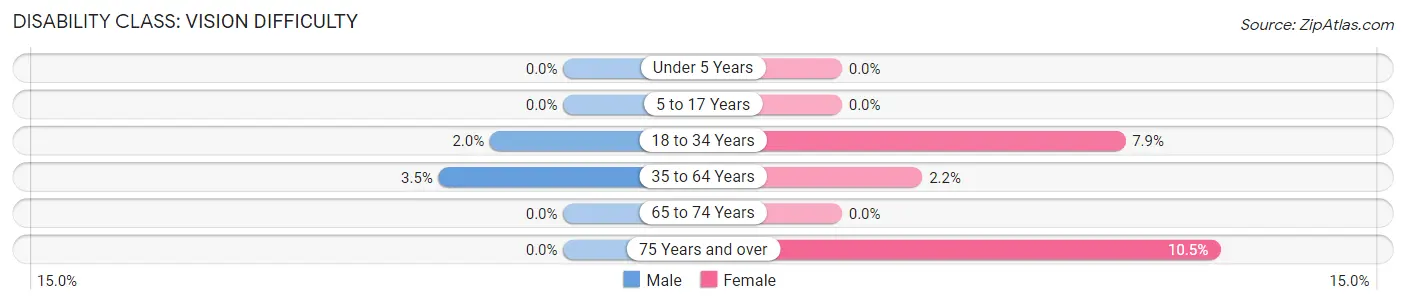
| Age Bracket | Male | Female |
| Under 5 Years | 0 (0.0%) | 0 (0.0%) |
| 5 to 17 Years | 0 (0.0%) | 0 (0.0%) |
| 18 to 34 Years | 3 (2.0%) | 6 (7.9%) |
| 35 to 64 Years | 5 (3.5%) | 3 (2.2%) |
| 65 to 74 Years | 0 (0.0%) | 0 (0.0%) |
| 75 Years and over | 0 (0.0%) | 2 (10.5%) |
Disability Class: Cognitive Difficulty
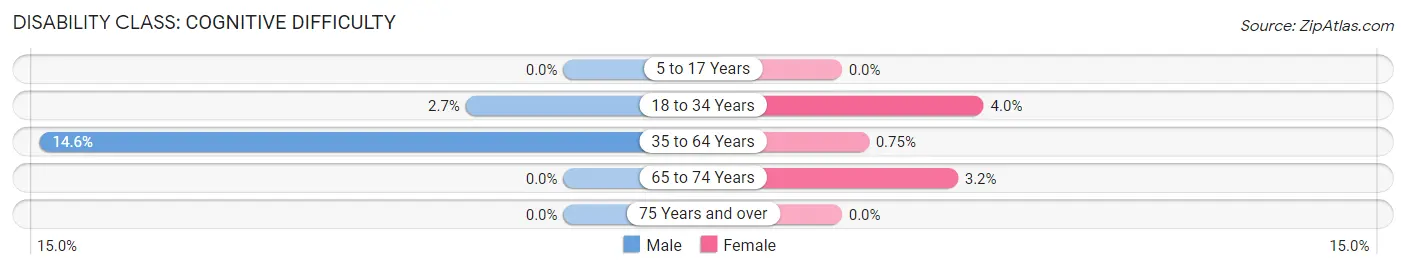
| Age Bracket | Male | Female |
| 5 to 17 Years | 0 (0.0%) | 0 (0.0%) |
| 18 to 34 Years | 4 (2.7%) | 3 (4.0%) |
| 35 to 64 Years | 21 (14.6%) | 1 (0.7%) |
| 65 to 74 Years | 0 (0.0%) | 1 (3.2%) |
| 75 Years and over | 0 (0.0%) | 0 (0.0%) |
Disability Class: Ambulatory Difficulty
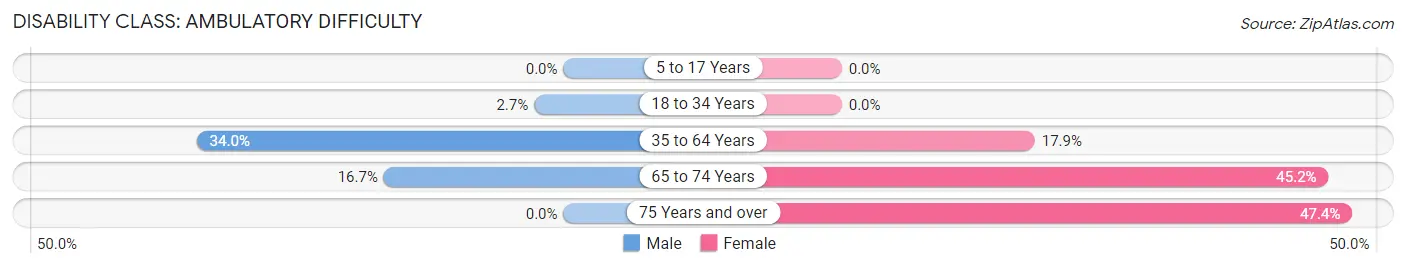
| Age Bracket | Male | Female |
| 5 to 17 Years | 0 (0.0%) | 0 (0.0%) |
| 18 to 34 Years | 4 (2.7%) | 0 (0.0%) |
| 35 to 64 Years | 49 (34.0%) | 24 (17.9%) |
| 65 to 74 Years | 6 (16.7%) | 14 (45.2%) |
| 75 Years and over | 0 (0.0%) | 9 (47.4%) |
Disability Class: Self-Care Difficulty
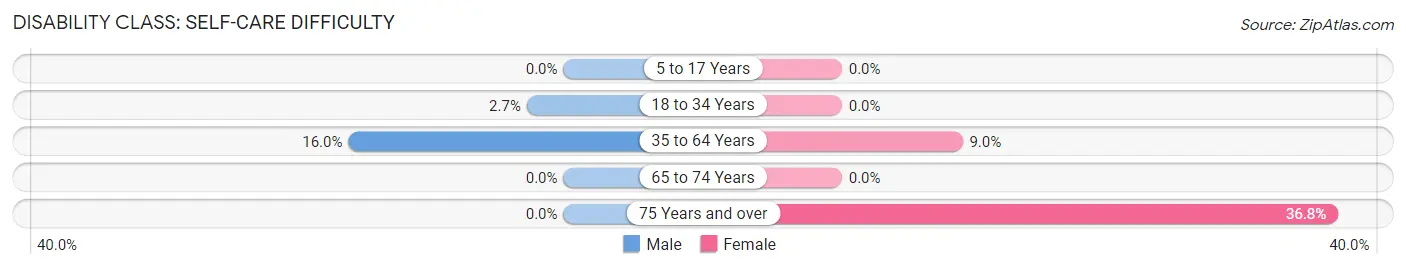
| Age Bracket | Male | Female |
| 5 to 17 Years | 0 (0.0%) | 0 (0.0%) |
| 18 to 34 Years | 4 (2.7%) | 0 (0.0%) |
| 35 to 64 Years | 23 (16.0%) | 12 (9.0%) |
| 65 to 74 Years | 0 (0.0%) | 0 (0.0%) |
| 75 Years and over | 0 (0.0%) | 7 (36.8%) |
Technology Access in Concrete
Computing Device Access in Concrete
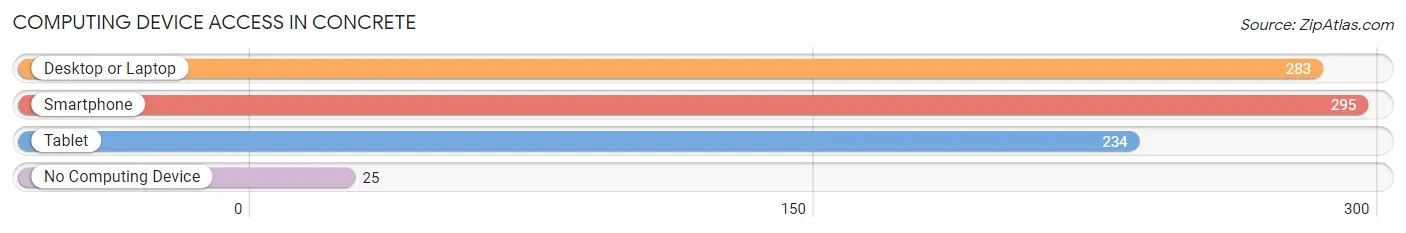
| Device Type | # Households | % Households |
| Desktop or Laptop | 283 | 80.6% |
| Smartphone | 295 | 84.1% |
| Tablet | 234 | 66.7% |
| No Computing Device | 25 | 7.1% |
| Total | 351 | 100.0% |
Internet Access in Concrete
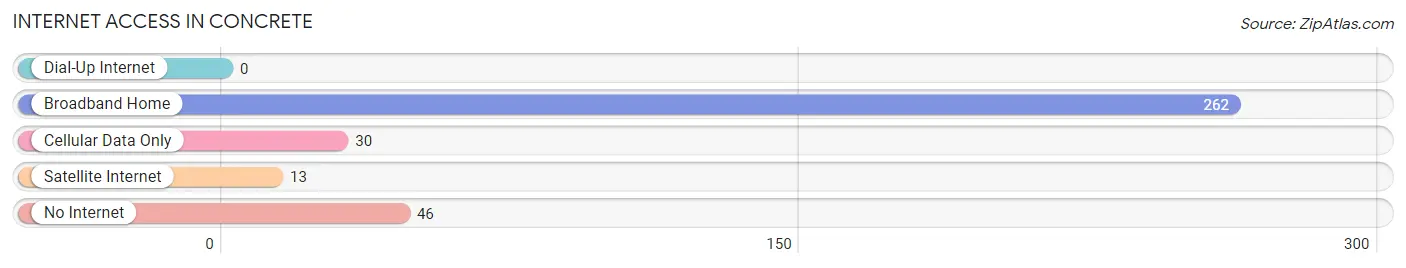
| Internet Type | # Households | % Households |
| Dial-Up Internet | 0 | 0.0% |
| Broadband Home | 262 | 74.6% |
| Cellular Data Only | 30 | 8.6% |
| Satellite Internet | 13 | 3.7% |
| No Internet | 46 | 13.1% |
| Total | 351 | 100.0% |
Concrete Summary
Concrete is a small town located in Skagit County, Washington, United States. It is situated on the banks of the Skagit River, approximately 50 miles north of Seattle. The town was founded in 1891 and incorporated in 1910. As of the 2010 census, the population of Concrete was 876.
History
The area that is now Concrete was first inhabited by the Upper Skagit Tribe, who lived in the area for thousands of years before the arrival of European settlers. The first European settlers arrived in the area in the late 1800s, and the town of Concrete was officially founded in 1891. The town was named after the nearby Concrete Creek, which was named for the cement-like material that was found in the creek bed.
The town of Concrete was officially incorporated in 1910, and the first mayor was elected in 1911. The town quickly grew, and by the 1920s, it had become a bustling logging and farming community. The town was also home to several sawmills, which provided employment for many of the town's residents.
In the 1950s, the town began to experience a decline in population as many of the town's residents moved away in search of better job opportunities. However, the town has experienced a resurgence in recent years, and the population has grown steadily since the 2000 census.
Geography
Concrete is located in Skagit County, Washington, approximately 50 miles north of Seattle. The town is situated on the banks of the Skagit River, and is surrounded by the Cascade Mountains to the east and the Olympic Mountains to the west. The town has a total area of 1.2 square miles, all of which is land.
The climate in Concrete is mild and temperate, with warm summers and cool winters. The average annual temperature is around 50 degrees Fahrenheit, and the average annual precipitation is around 40 inches.
Economy
The economy of Concrete is largely based on tourism and agriculture. The town is home to several tourist attractions, including the Concrete Historical Museum, the Concrete Skate Park, and the Concrete Theater. The town is also home to several farms, which produce a variety of fruits and vegetables.
The town is also home to several small businesses, including restaurants, retail stores, and service providers. The town is also home to several manufacturing companies, which produce a variety of products, including furniture, clothing, and electronics.
Demographics
As of the 2010 census, the population of Concrete was 876. The racial makeup of the town was 94.3% White, 0.7% African American, 0.7% Native American, 0.7% Asian, 0.1% Pacific Islander, and 3.5% from other races. The median household income in Concrete was $41,250, and the median family income was $50,000. The per capita income in Concrete was $20,845.
Conclusion
Concrete is a small town located in Skagit County, Washington, United States. It is situated on the banks of the Skagit River, approximately 50 miles north of Seattle. The town was founded in 1891 and incorporated in 1910. As of the 2010 census, the population of Concrete was 876. The economy of Concrete is largely based on tourism and agriculture, and the town is home to several small businesses, including restaurants, retail stores, and service providers. The racial makeup of the town was 94.3% White, 0.7% African American, 0.7% Native American, 0.7% Asian, 0.1% Pacific Islander, and 3.5% from other races. The median household income in Concrete was $41,250, and the median family income was $50,000. The per capita income in Concrete was $20,845.
Common Questions
What is Per Capita Income in Concrete?
Per Capita income in Concrete is $37,834.
What is the Median Family Income in Concrete?
Median Family Income in Concrete is $78,713.
What is the Median Household income in Concrete?
Median Household Income in Concrete is $82,375.
What is Income or Wage Gap in Concrete?
Income or Wage Gap in Concrete is 54.8%.
Women in Concrete earn 45.2 cents for every dollar earned by a man.
What is Inequality or Gini Index in Concrete?
Inequality or Gini Index in Concrete is 0.40.
What is the Total Population of Concrete?
Total Population of Concrete is 792.
What is the Total Male Population of Concrete?
Total Male Population of Concrete is 418.
What is the Total Female Population of Concrete?
Total Female Population of Concrete is 374.
What is the Ratio of Males per 100 Females in Concrete?
There are 111.76 Males per 100 Females in Concrete.
What is the Ratio of Females per 100 Males in Concrete?
There are 89.47 Females per 100 Males in Concrete.
What is the Median Population Age in Concrete?
Median Population Age in Concrete is 34.1 Years.
What is the Average Family Size in Concrete
Average Family Size in Concrete is 2.6 People.
What is the Average Household Size in Concrete
Average Household Size in Concrete is 2.2 People.
How Large is the Labor Force in Concrete?
There are 318 People in the Labor Forcein in Concrete.
What is the Percentage of People in the Labor Force in Concrete?
52.0% of People are in the Labor Force in Concrete.
What is the Unemployment Rate in Concrete?
Unemployment Rate in Concrete is 3.8%.