Enumclaw, WA Map & Demographics
Enumclaw Map
Enumclaw Overview
$54,692
PER CAPITA INCOME
$135,588
AVG FAMILY INCOME
$110,789
AVG HOUSEHOLD INCOME
36.7%
WAGE / INCOME GAP [ % ]
63.3¢/ $1
WAGE / INCOME GAP [ $ ]
0.43
INEQUALITY / GINI INDEX
12,630
TOTAL POPULATION
6,243
MALE POPULATION
6,387
FEMALE POPULATION
97.75
MALES / 100 FEMALES
102.31
FEMALES / 100 MALES
40.7
MEDIAN AGE
3.1
AVG FAMILY SIZE
2.4
AVG HOUSEHOLD SIZE
6,971
LABOR FORCE [ PEOPLE ]
67.7%
PERCENT IN LABOR FORCE
4.2%
UNEMPLOYMENT RATE
Enumclaw Zip Codes
Enumclaw Area Codes
Income in Enumclaw
Income Overview in Enumclaw
Per Capita Income in Enumclaw is $54,692, while median incomes of families and households are $135,588 and $110,789 respectively.
| Characteristic | Number | Measure |
| Per Capita Income | 12,630 | $54,692 |
| Median Family Income | 3,264 | $135,588 |
| Mean Family Income | 3,264 | $147,744 |
| Median Household Income | 5,260 | $110,789 |
| Mean Household Income | 5,260 | $126,699 |
| Income Deficit | 3,264 | $0 |
| Wage / Income Gap (%) | 12,630 | 36.69% |
| Wage / Income Gap ($) | 12,630 | 63.31¢ per $1 |
| Gini / Inequality Index | 12,630 | 0.43 |
Earnings by Sex in Enumclaw
Average Earnings in Enumclaw are $63,778, $76,912 for men and $48,693 for women, a difference of 36.7%.
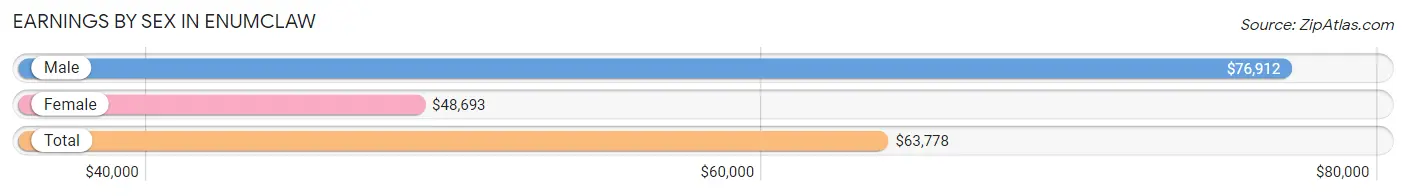
| Sex | Number | Average Earnings |
| Male | 3,550 (48.9%) | $76,912 |
| Female | 3,702 (51.0%) | $48,693 |
| Total | 7,252 (100.0%) | $63,778 |
Earnings by Sex by Income Bracket in Enumclaw
The most common earnings brackets in Enumclaw are $100,000+ for men (1,196 | 33.7%) and $65,000 to $74,999 for women (597 | 16.1%).
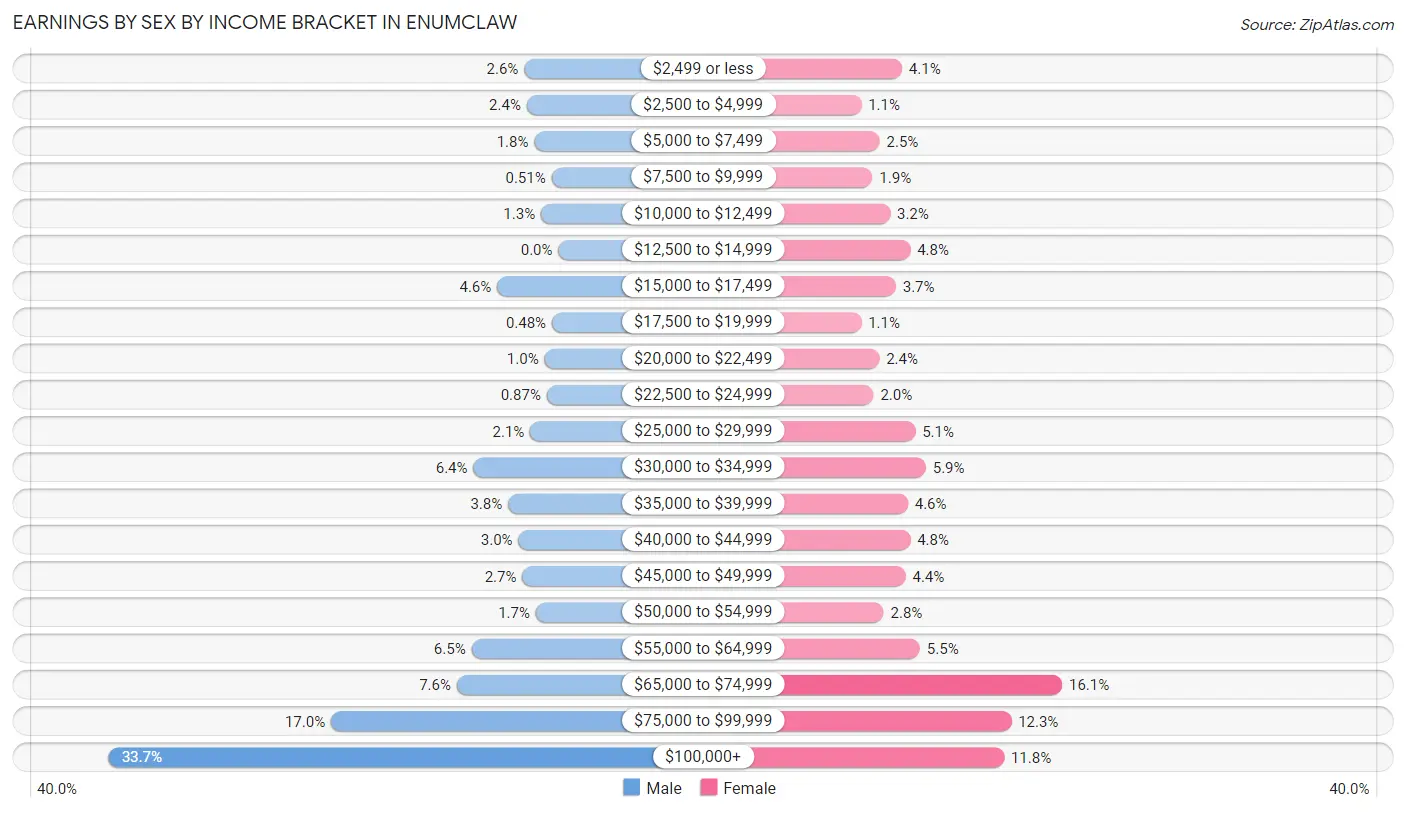
| Income | Male | Female |
| $2,499 or less | 91 (2.6%) | 153 (4.1%) |
| $2,500 to $4,999 | 84 (2.4%) | 40 (1.1%) |
| $5,000 to $7,499 | 64 (1.8%) | 91 (2.5%) |
| $7,500 to $9,999 | 18 (0.5%) | 71 (1.9%) |
| $10,000 to $12,499 | 46 (1.3%) | 120 (3.2%) |
| $12,500 to $14,999 | 0 (0.0%) | 176 (4.8%) |
| $15,000 to $17,499 | 163 (4.6%) | 136 (3.7%) |
| $17,500 to $19,999 | 17 (0.5%) | 40 (1.1%) |
| $20,000 to $22,499 | 37 (1.0%) | 90 (2.4%) |
| $22,500 to $24,999 | 31 (0.9%) | 74 (2.0%) |
| $25,000 to $29,999 | 75 (2.1%) | 190 (5.1%) |
| $30,000 to $34,999 | 226 (6.4%) | 219 (5.9%) |
| $35,000 to $39,999 | 134 (3.8%) | 169 (4.6%) |
| $40,000 to $44,999 | 106 (3.0%) | 176 (4.8%) |
| $45,000 to $49,999 | 96 (2.7%) | 163 (4.4%) |
| $50,000 to $54,999 | 60 (1.7%) | 102 (2.8%) |
| $55,000 to $64,999 | 231 (6.5%) | 203 (5.5%) |
| $65,000 to $74,999 | 270 (7.6%) | 597 (16.1%) |
| $75,000 to $99,999 | 605 (17.0%) | 456 (12.3%) |
| $100,000+ | 1,196 (33.7%) | 436 (11.8%) |
| Total | 3,550 (100.0%) | 3,702 (100.0%) |
Earnings by Sex by Educational Attainment in Enumclaw
Average earnings in Enumclaw are $79,083 for men and $61,431 for women, a difference of 22.3%. Men with an educational attainment of graduate degree enjoy the highest average annual earnings of $106,369, while those with high school diploma education earn the least with $74,114. Women with an educational attainment of graduate degree earn the most with the average annual earnings of $76,076, while those with less than high school education have the smallest earnings of $29,803.
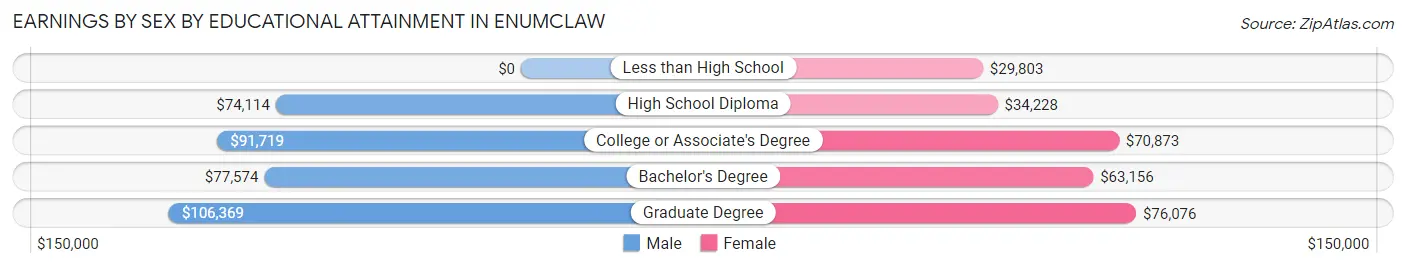
| Educational Attainment | Male Income | Female Income |
| Less than High School | - | - |
| High School Diploma | $74,114 | $34,228 |
| College or Associate's Degree | $91,719 | $70,873 |
| Bachelor's Degree | $77,574 | $63,156 |
| Graduate Degree | $106,369 | $76,076 |
| Total | $79,083 | $61,431 |
Family Income in Enumclaw
Family Income Brackets in Enumclaw
According to the Enumclaw family income data, there are 937 families falling into the $100,000 to $149,999 income range, which is the most common income bracket and makes up 28.7% of all families. Conversely, the less than $10,000 income bracket is the least frequent group with only 65 families (2.0%) belonging to this category.
| Income Bracket | # Families | % Families |
| Less than $10,000 | 65 | 2.0% |
| $10,000 to $14,999 | 69 | 2.1% |
| $15,000 to $24,999 | 88 | 2.7% |
| $25,000 to $34,999 | 69 | 2.1% |
| $35,000 to $49,999 | 166 | 5.1% |
| $50,000 to $74,999 | 186 | 5.7% |
| $75,000 to $99,999 | 385 | 11.8% |
| $100,000 to $149,999 | 937 | 28.7% |
| $150,000 to $199,999 | 548 | 16.8% |
| $200,000+ | 757 | 23.2% |
Family Income by Famaliy Size in Enumclaw
5-person families (275 | 8.4%) account for the highest median family income in Enumclaw with $173,783 per family, while 2-person families (1,658 | 50.8%) have the highest median income of $68,910 per family member.
| Income Bracket | # Families | Median Income |
| 2-Person Families | 1,658 (50.8%) | $137,821 |
| 3-Person Families | 696 (21.3%) | $138,654 |
| 4-Person Families | 577 (17.7%) | $122,361 |
| 5-Person Families | 275 (8.4%) | $173,783 |
| 6-Person Families | 58 (1.8%) | $0 |
| 7+ Person Families | 0 (0.0%) | $0 |
| Total | 3,264 (100.0%) | $135,588 |
Family Income by Number of Earners in Enumclaw
The median family income in Enumclaw is $135,588, with families comprising 3+ earners (426) having the highest median family income of $179,250, while families with no earners (375) have the lowest median family income of $70,208, accounting for 13.1% and 11.5% of families, respectively.
| Number of Earners | # Families | Median Income |
| No Earners | 375 (11.5%) | $70,208 |
| 1 Earner | 636 (19.5%) | $76,518 |
| 2 Earners | 1,827 (56.0%) | $149,304 |
| 3+ Earners | 426 (13.1%) | $179,250 |
| Total | 3,264 (100.0%) | $135,588 |
Household Income in Enumclaw
Household Income Brackets in Enumclaw
With 1,247 households falling in the category, the $100,000 to $149,999 income range is the most frequent in Enumclaw, accounting for 23.7% of all households. In contrast, only 132 households (2.5%) fall into the less than $10,000 income bracket, making it the least populous group.
| Income Bracket | # Households | % Households |
| Less than $10,000 | 132 | 2.5% |
| $10,000 to $14,999 | 231 | 4.4% |
| $15,000 to $24,999 | 363 | 6.9% |
| $25,000 to $34,999 | 195 | 3.7% |
| $35,000 to $49,999 | 552 | 10.5% |
| $50,000 to $74,999 | 379 | 7.2% |
| $75,000 to $99,999 | 573 | 10.9% |
| $100,000 to $149,999 | 1,247 | 23.7% |
| $150,000 to $199,999 | 689 | 13.1% |
| $200,000+ | 899 | 17.1% |
Household Income by Householder Age in Enumclaw
The median household income in Enumclaw is $110,789, with the highest median household income of $132,576 found in the 25 to 44 years age bracket for the primary householder. A total of 1,724 households (32.8%) fall into this category. Meanwhile, the 15 to 24 years age bracket for the primary householder has the lowest median household income of $0, with 115 households (2.2%) in this group.
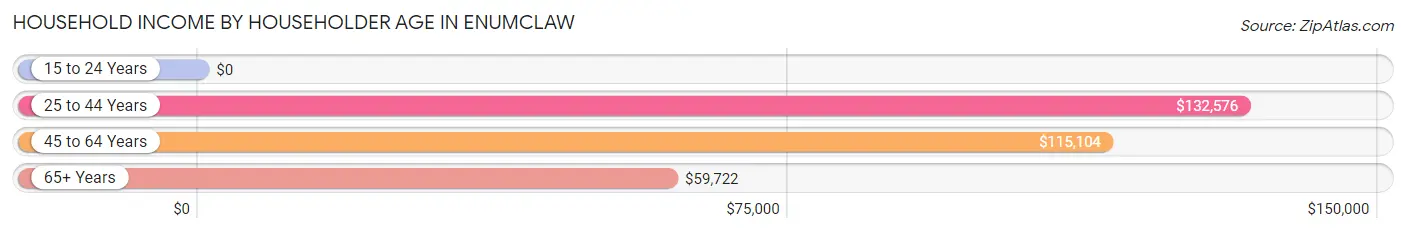
| Income Bracket | # Households | Median Income |
| 15 to 24 Years | 115 (2.2%) | $0 |
| 25 to 44 Years | 1,724 (32.8%) | $132,576 |
| 45 to 64 Years | 1,725 (32.8%) | $115,104 |
| 65+ Years | 1,696 (32.2%) | $59,722 |
| Total | 5,260 (100.0%) | $110,789 |
Poverty in Enumclaw
Income Below Poverty by Sex and Age in Enumclaw
With 5.7% poverty level for males and 8.9% for females among the residents of Enumclaw, 5 year old males and 5 year old females are the most vulnerable to poverty, with 10 males (29.4%) and 42 females (45.2%) in their respective age groups living below the poverty level.
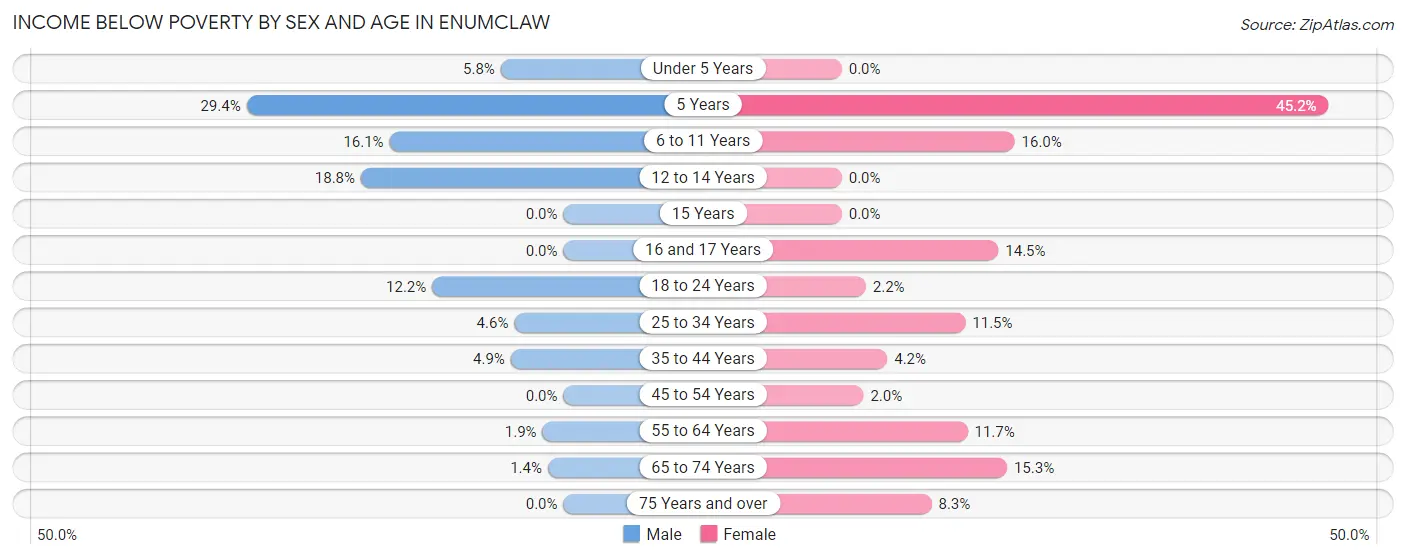
| Age Bracket | Male | Female |
| Under 5 Years | 33 (5.8%) | 0 (0.0%) |
| 5 Years | 10 (29.4%) | 42 (45.2%) |
| 6 to 11 Years | 102 (16.1%) | 43 (16.0%) |
| 12 to 14 Years | 62 (18.8%) | 0 (0.0%) |
| 15 Years | 0 (0.0%) | 0 (0.0%) |
| 16 and 17 Years | 0 (0.0%) | 26 (14.5%) |
| 18 to 24 Years | 43 (12.2%) | 14 (2.2%) |
| 25 to 34 Years | 39 (4.6%) | 96 (11.5%) |
| 35 to 44 Years | 41 (4.9%) | 34 (4.2%) |
| 45 to 54 Years | 0 (0.0%) | 14 (2.0%) |
| 55 to 64 Years | 16 (1.9%) | 117 (11.7%) |
| 65 to 74 Years | 9 (1.4%) | 122 (15.3%) |
| 75 Years and over | 0 (0.0%) | 51 (8.3%) |
| Total | 355 (5.7%) | 559 (8.9%) |
Income Above Poverty by Sex and Age in Enumclaw
According to the poverty statistics in Enumclaw, males aged 15 years and females aged under 5 years are the age groups that are most secure financially, with 100.0% of males and 100.0% of females in these age groups living above the poverty line.
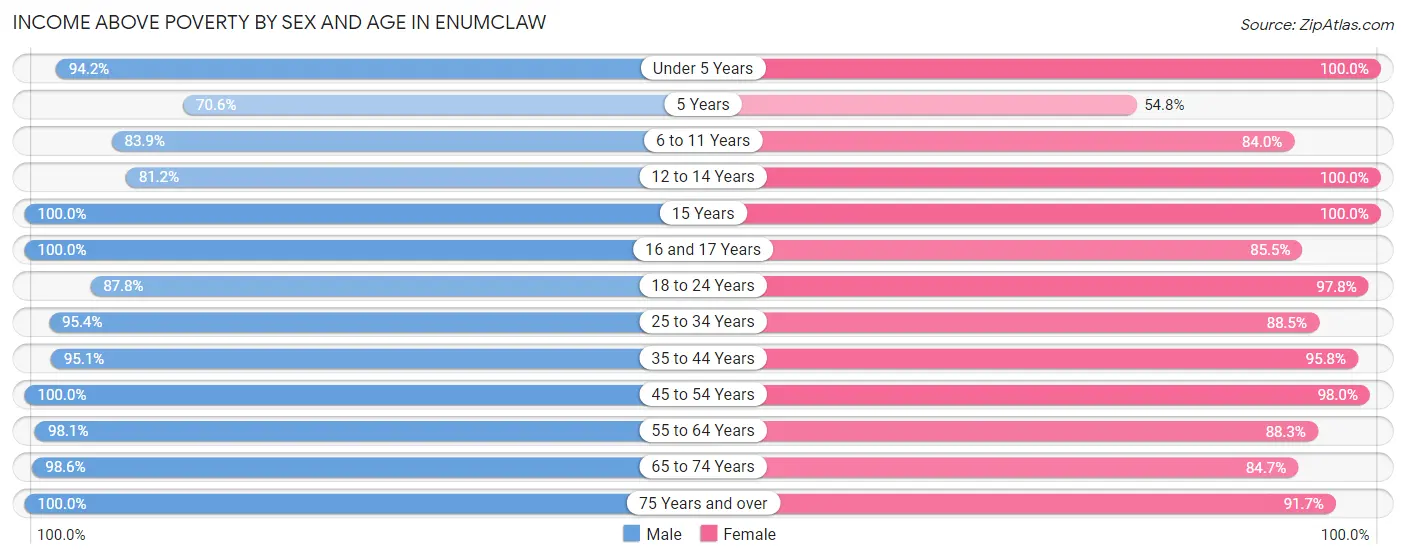
| Age Bracket | Male | Female |
| Under 5 Years | 534 (94.2%) | 226 (100.0%) |
| 5 Years | 24 (70.6%) | 51 (54.8%) |
| 6 to 11 Years | 530 (83.9%) | 225 (84.0%) |
| 12 to 14 Years | 268 (81.2%) | 138 (100.0%) |
| 15 Years | 23 (100.0%) | 22 (100.0%) |
| 16 and 17 Years | 94 (100.0%) | 153 (85.5%) |
| 18 to 24 Years | 310 (87.8%) | 614 (97.8%) |
| 25 to 34 Years | 816 (95.4%) | 741 (88.5%) |
| 35 to 44 Years | 797 (95.1%) | 772 (95.8%) |
| 45 to 54 Years | 642 (100.0%) | 681 (98.0%) |
| 55 to 64 Years | 809 (98.1%) | 886 (88.3%) |
| 65 to 74 Years | 615 (98.6%) | 674 (84.7%) |
| 75 Years and over | 386 (100.0%) | 561 (91.7%) |
| Total | 5,848 (94.3%) | 5,744 (91.1%) |
Income Below Poverty Among Married-Couple Families in Enumclaw
The poverty statistics for married-couple families in Enumclaw show that 1.1% or 30 of the total 2,611 families live below the poverty line. Families with no children have the highest poverty rate of 1.3%, comprising of 21 families. On the other hand, families with 3 or 4 children have the lowest poverty rate of 0.0%, which includes 0 families.
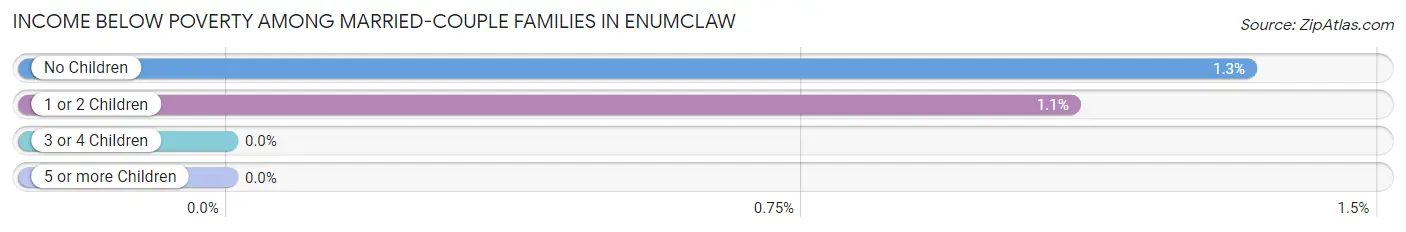
| Children | Above Poverty | Below Poverty |
| No Children | 1,563 (98.7%) | 21 (1.3%) |
| 1 or 2 Children | 809 (98.9%) | 9 (1.1%) |
| 3 or 4 Children | 209 (100.0%) | 0 (0.0%) |
| 5 or more Children | 0 (0.0%) | 0 (0.0%) |
| Total | 2,581 (98.9%) | 30 (1.1%) |
Income Below Poverty Among Single-Parent Households in Enumclaw
According to the poverty data in Enumclaw, 29.4% or 32 single-father households and 26.7% or 145 single-mother households are living below the poverty line. Among single-father households, those with 1 or 2 children have the highest poverty rate, with 32 households (65.3%) experiencing poverty. Likewise, among single-mother households, those with 3 or 4 children have the highest poverty rate, with 51 households (100.0%) falling below the poverty line.
| Children | Single Father | Single Mother |
| No Children | 0 (0.0%) | 42 (18.3%) |
| 1 or 2 Children | 32 (65.3%) | 52 (19.8%) |
| 3 or 4 Children | 0 (0.0%) | 51 (100.0%) |
| 5 or more Children | 0 (0.0%) | 0 (0.0%) |
| Total | 32 (29.4%) | 145 (26.7%) |
Income Below Poverty Among Married-Couple vs Single-Parent Households in Enumclaw
The poverty data for Enumclaw shows that 30 of the married-couple family households (1.1%) and 177 of the single-parent households (27.1%) are living below the poverty level. Within the married-couple family households, those with no children have the highest poverty rate, with 21 households (1.3%) falling below the poverty line. Among the single-parent households, those with 3 or 4 children have the highest poverty rate, with 51 household (78.5%) living below poverty.
| Children | Married-Couple Families | Single-Parent Households |
| No Children | 21 (1.3%) | 42 (15.2%) |
| 1 or 2 Children | 9 (1.1%) | 84 (26.9%) |
| 3 or 4 Children | 0 (0.0%) | 51 (78.5%) |
| 5 or more Children | 0 (0.0%) | 0 (0.0%) |
| Total | 30 (1.1%) | 177 (27.1%) |
Race in Enumclaw
The most populous races in Enumclaw are White / Caucasian (10,590 | 83.9%), Hispanic or Latino (1,321 | 10.5%), and Two or more Races (1,184 | 9.4%).
| Race | # Population | % Population |
| Asian | 269 | 2.1% |
| Black / African American | 65 | 0.5% |
| Hawaiian / Pacific | 61 | 0.5% |
| Hispanic or Latino | 1,321 | 10.5% |
| Native / Alaskan | 47 | 0.4% |
| White / Caucasian | 10,590 | 83.9% |
| Two or more Races | 1,184 | 9.4% |
| Some other Race | 414 | 3.3% |
| Total | 12,630 | 100.0% |
Ancestry in Enumclaw
The most populous ancestries reported in Enumclaw are English (2,629 | 20.8%), German (2,226 | 17.6%), Irish (1,515 | 12.0%), Mexican (1,183 | 9.4%), and Swedish (1,061 | 8.4%), together accounting for 68.2% of all Enumclaw residents.
| Ancestry | # Population | % Population |
| African | 49 | 0.4% |
| American | 310 | 2.5% |
| Austrian | 32 | 0.3% |
| Belgian | 18 | 0.1% |
| Bhutanese | 163 | 1.3% |
| British | 82 | 0.6% |
| Burmese | 14 | 0.1% |
| Central American | 15 | 0.1% |
| Cherokee | 83 | 0.7% |
| Chilean | 94 | 0.7% |
| Chippewa | 117 | 0.9% |
| Choctaw | 41 | 0.3% |
| Czech | 39 | 0.3% |
| Czechoslovakian | 10 | 0.1% |
| Danish | 129 | 1.0% |
| Dutch | 220 | 1.7% |
| Eastern European | 91 | 0.7% |
| English | 2,629 | 20.8% |
| European | 537 | 4.3% |
| Finnish | 86 | 0.7% |
| French | 128 | 1.0% |
| French Canadian | 105 | 0.8% |
| German | 2,226 | 17.6% |
| Greek | 59 | 0.5% |
| Hungarian | 4 | 0.0% |
| Indian (Asian) | 80 | 0.6% |
| Iranian | 9 | 0.1% |
| Irish | 1,515 | 12.0% |
| Italian | 215 | 1.7% |
| Japanese | 3 | 0.0% |
| Kenyan | 13 | 0.1% |
| Korean | 153 | 1.2% |
| Latvian | 25 | 0.2% |
| Mexican | 1,183 | 9.4% |
| Native Hawaiian | 61 | 0.5% |
| Northern European | 16 | 0.1% |
| Norwegian | 1,029 | 8.2% |
| Panamanian | 7 | 0.1% |
| Pennsylvania German | 5 | 0.0% |
| Polish | 230 | 1.8% |
| Portuguese | 93 | 0.7% |
| Potawatomi | 83 | 0.7% |
| Puerto Rican | 29 | 0.2% |
| Puget Sound Salish | 111 | 0.9% |
| Romanian | 48 | 0.4% |
| Russian | 30 | 0.2% |
| Salvadoran | 8 | 0.1% |
| Scandinavian | 143 | 1.1% |
| Scotch-Irish | 150 | 1.2% |
| Scottish | 409 | 3.2% |
| South American | 94 | 0.7% |
| Sri Lankan | 62 | 0.5% |
| Subsaharan African | 62 | 0.5% |
| Swedish | 1,061 | 8.4% |
| Swiss | 199 | 1.6% |
| Thai | 25 | 0.2% |
| Ukrainian | 19 | 0.2% |
| Welsh | 101 | 0.8% |
| West Indian | 7 | 0.1% |
| Yakama | 16 | 0.1% | View All 60 Rows |
Immigrants in Enumclaw
The most numerous immigrant groups reported in Enumclaw came from Latin America (368 | 2.9%), Europe (262 | 2.1%), Central America (255 | 2.0%), Mexico (255 | 2.0%), and Northern Europe (151 | 1.2%), together accounting for 10.2% of all Enumclaw residents.
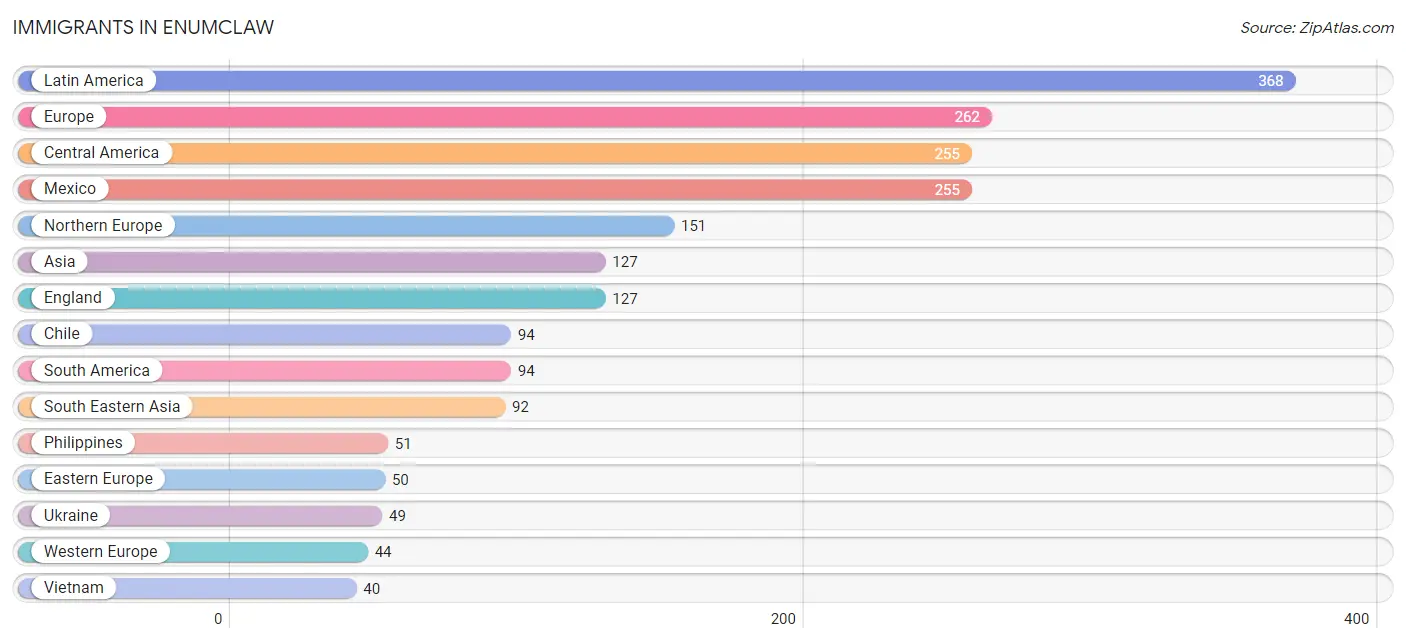
| Immigration Origin | # Population | % Population |
| Africa | 24 | 0.2% |
| Asia | 127 | 1.0% |
| Cambodia | 1 | 0.0% |
| Canada | 33 | 0.3% |
| Caribbean | 19 | 0.2% |
| Central America | 255 | 2.0% |
| Chile | 94 | 0.7% |
| Cuba | 12 | 0.1% |
| Eastern Africa | 24 | 0.2% |
| Eastern Asia | 26 | 0.2% |
| Eastern Europe | 50 | 0.4% |
| England | 127 | 1.0% |
| Europe | 262 | 2.1% |
| France | 14 | 0.1% |
| Germany | 30 | 0.2% |
| Greece | 17 | 0.1% |
| Iran | 9 | 0.1% |
| Ireland | 16 | 0.1% |
| Japan | 26 | 0.2% |
| Kenya | 24 | 0.2% |
| Latin America | 368 | 2.9% |
| Mexico | 255 | 2.0% |
| Northern Europe | 151 | 1.2% |
| Philippines | 51 | 0.4% |
| Romania | 1 | 0.0% |
| South America | 94 | 0.7% |
| South Central Asia | 9 | 0.1% |
| South Eastern Asia | 92 | 0.7% |
| Southern Europe | 17 | 0.1% |
| Trinidad and Tobago | 7 | 0.1% |
| Ukraine | 49 | 0.4% |
| Vietnam | 40 | 0.3% |
| Western Europe | 44 | 0.4% | View All 33 Rows |
Sex and Age in Enumclaw
Sex and Age in Enumclaw
The most populous age groups in Enumclaw are 30 to 34 Years (633 | 10.1%) for men and 65 to 69 Years (537 | 8.4%) for women.
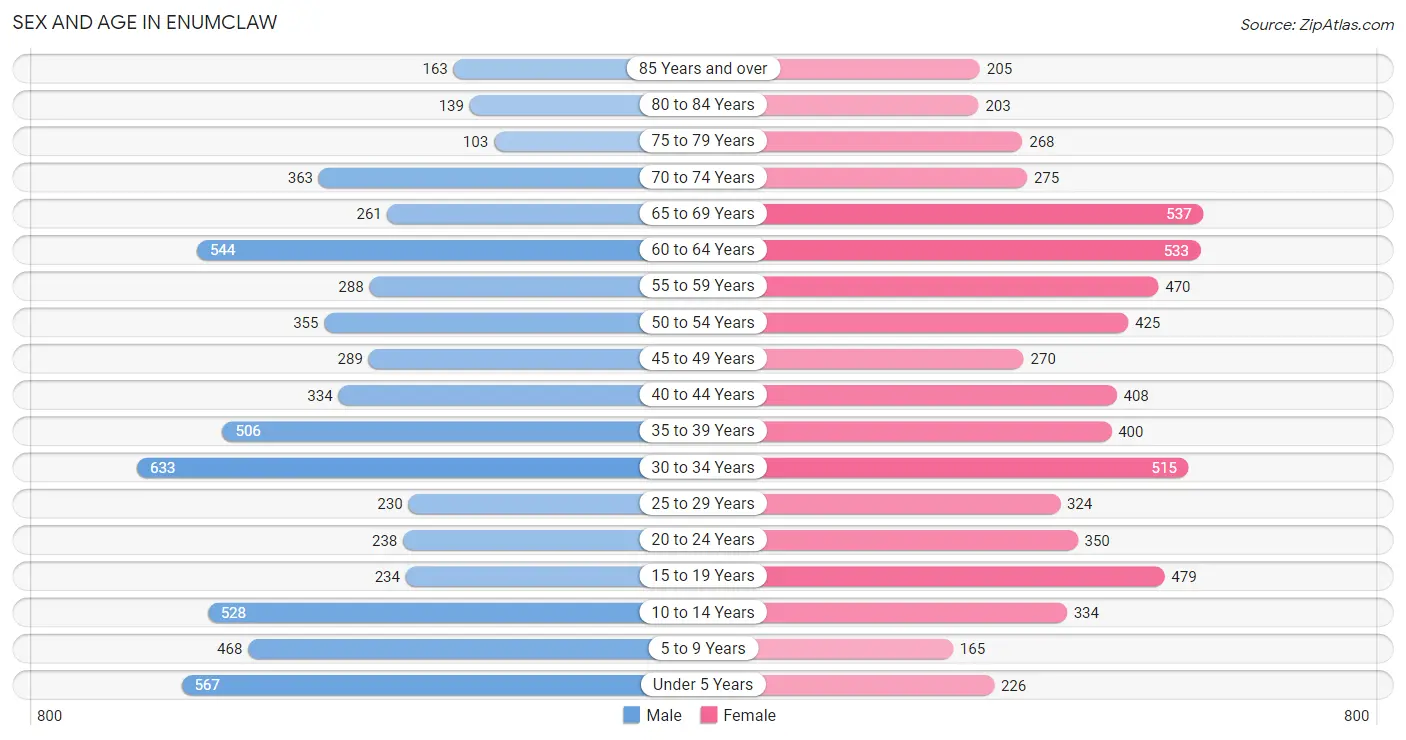
| Age Bracket | Male | Female |
| Under 5 Years | 567 (9.1%) | 226 (3.5%) |
| 5 to 9 Years | 468 (7.5%) | 165 (2.6%) |
| 10 to 14 Years | 528 (8.5%) | 334 (5.2%) |
| 15 to 19 Years | 234 (3.7%) | 479 (7.5%) |
| 20 to 24 Years | 238 (3.8%) | 350 (5.5%) |
| 25 to 29 Years | 230 (3.7%) | 324 (5.1%) |
| 30 to 34 Years | 633 (10.1%) | 515 (8.1%) |
| 35 to 39 Years | 506 (8.1%) | 400 (6.3%) |
| 40 to 44 Years | 334 (5.3%) | 408 (6.4%) |
| 45 to 49 Years | 289 (4.6%) | 270 (4.2%) |
| 50 to 54 Years | 355 (5.7%) | 425 (6.7%) |
| 55 to 59 Years | 288 (4.6%) | 470 (7.4%) |
| 60 to 64 Years | 544 (8.7%) | 533 (8.4%) |
| 65 to 69 Years | 261 (4.2%) | 537 (8.4%) |
| 70 to 74 Years | 363 (5.8%) | 275 (4.3%) |
| 75 to 79 Years | 103 (1.7%) | 268 (4.2%) |
| 80 to 84 Years | 139 (2.2%) | 203 (3.2%) |
| 85 Years and over | 163 (2.6%) | 205 (3.2%) |
| Total | 6,243 (100.0%) | 6,387 (100.0%) |
Families and Households in Enumclaw
Median Family Size in Enumclaw
The median family size in Enumclaw is 3.06 persons per family, with married-couple families (2,611 | 80.0%) accounting for the largest median family size of 3.1 persons per family. On the other hand, single male/father families (109 | 3.3%) represent the smallest median family size with 2.65 persons per family.
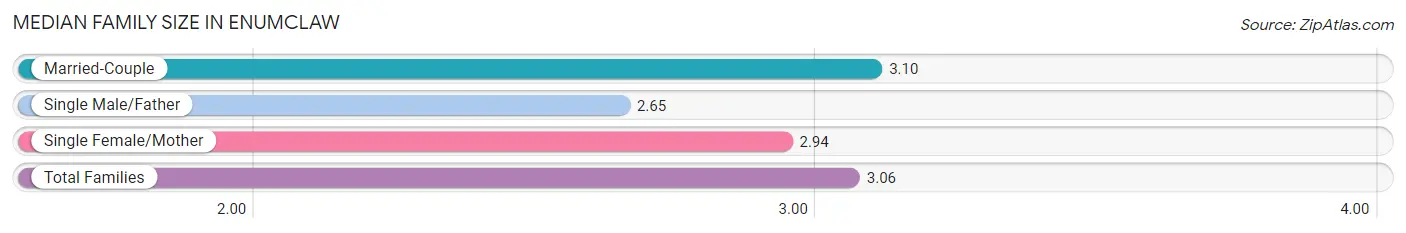
| Family Type | # Families | Family Size |
| Married-Couple | 2,611 (80.0%) | 3.10 |
| Single Male/Father | 109 (3.3%) | 2.65 |
| Single Female/Mother | 544 (16.7%) | 2.94 |
| Total Families | 3,264 (100.0%) | 3.06 |
Median Household Size in Enumclaw
The median household size in Enumclaw is 2.37 persons per household, with married-couple households (2,611 | 49.6%) accounting for the largest median household size of 3.12 persons per household. non-family households (1,996 | 38.0%) represent the smallest median household size with 1.16 persons per household.
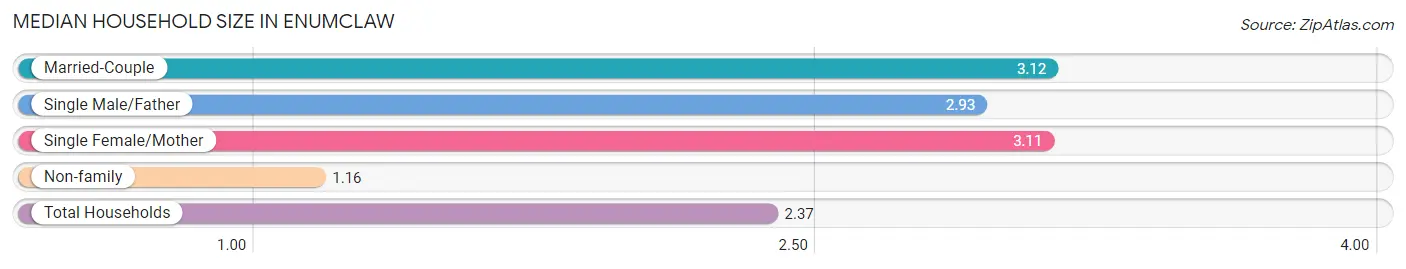
| Household Type | # Households | Household Size |
| Married-Couple | 2,611 (49.6%) | 3.12 |
| Single Male/Father | 109 (2.1%) | 2.93 |
| Single Female/Mother | 544 (10.3%) | 3.11 |
| Non-family | 1,996 (38.0%) | 1.16 |
| Total Households | 5,260 (100.0%) | 2.37 |
Household Size by Marriage Status in Enumclaw
Out of a total of 5,260 households in Enumclaw, 3,264 (62.1%) are family households, while 1,996 (38.0%) are nonfamily households. The most numerous type of family households are 2-person households, comprising 1,619, and the most common type of nonfamily households are 1-person households, comprising 1,692.
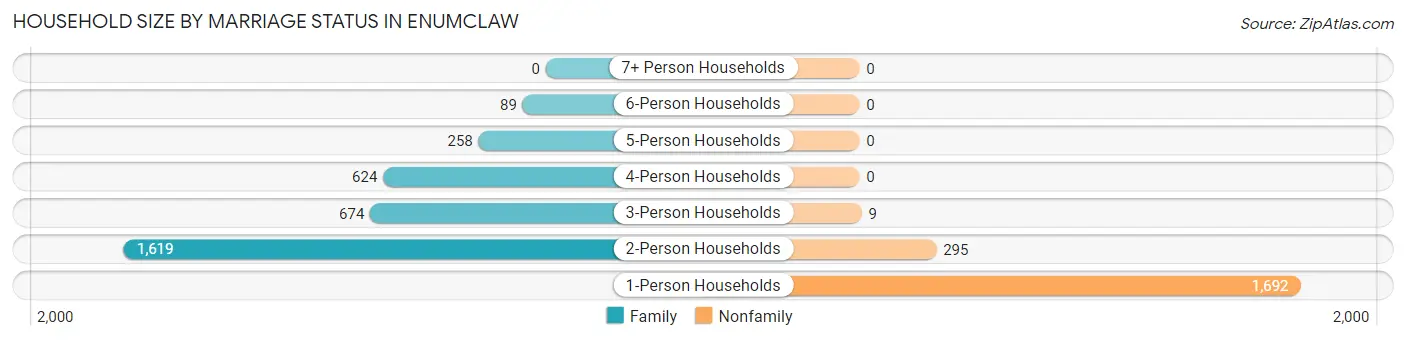
| Household Size | Family Households | Nonfamily Households |
| 1-Person Households | - | 1,692 (32.2%) |
| 2-Person Households | 1,619 (30.8%) | 295 (5.6%) |
| 3-Person Households | 674 (12.8%) | 9 (0.2%) |
| 4-Person Households | 624 (11.9%) | 0 (0.0%) |
| 5-Person Households | 258 (4.9%) | 0 (0.0%) |
| 6-Person Households | 89 (1.7%) | 0 (0.0%) |
| 7+ Person Households | 0 (0.0%) | 0 (0.0%) |
| Total | 3,264 (62.1%) | 1,996 (38.0%) |
Female Fertility in Enumclaw
Fertility by Age in Enumclaw
Average fertility rate in Enumclaw is 53.0 births per 1,000 women. Women in the age bracket of 20 to 34 years have the highest fertility rate with 111.0 births per 1,000 women. Women in the age bracket of 20 to 34 years acount for 89.8% of all women with births.
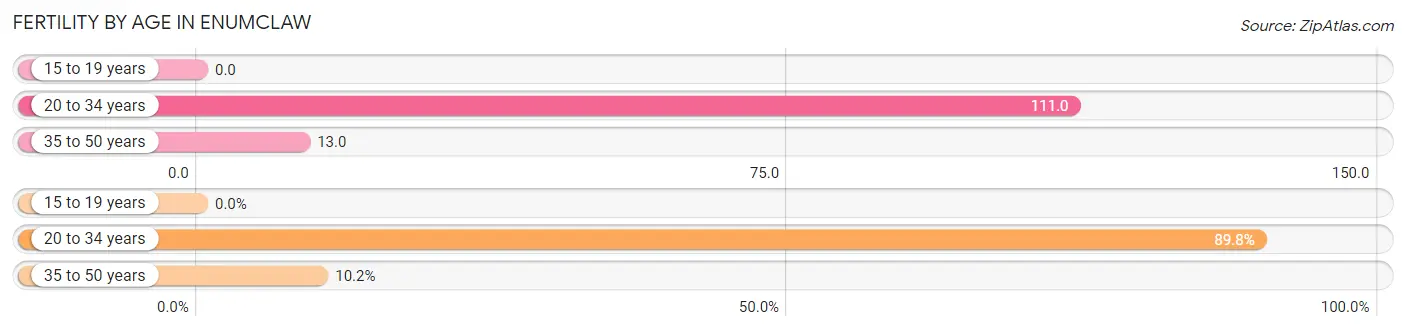
| Age Bracket | Women with Births | Births / 1,000 Women |
| 15 to 19 years | 0 (0.0%) | 0.0 |
| 20 to 34 years | 132 (89.8%) | 111.0 |
| 35 to 50 years | 15 (10.2%) | 13.0 |
| Total | 147 (100.0%) | 53.0 |
Fertility by Age by Marriage Status in Enumclaw
77.6% of women with births (147) in Enumclaw are married. The highest percentage of unmarried women with births falls into 20 to 34 years age bracket with 25.0% of them unmarried at the time of birth, while the lowest percentage of unmarried women with births belong to 35 to 50 years age bracket with 0.0% of them unmarried.
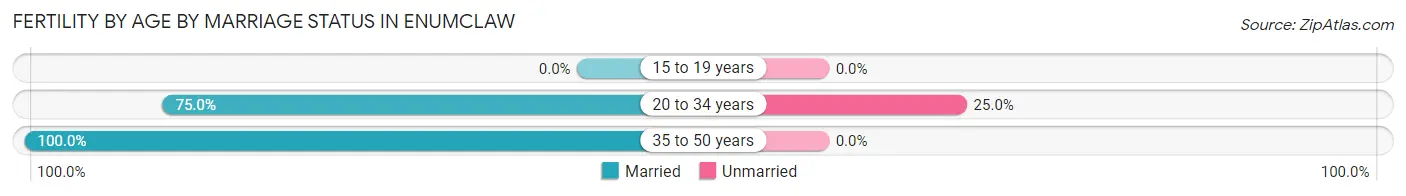
| Age Bracket | Married | Unmarried |
| 15 to 19 years | 0 (0.0%) | 0 (0.0%) |
| 20 to 34 years | 99 (75.0%) | 33 (25.0%) |
| 35 to 50 years | 15 (100.0%) | 0 (0.0%) |
| Total | 114 (77.5%) | 33 (22.5%) |
Fertility by Education in Enumclaw
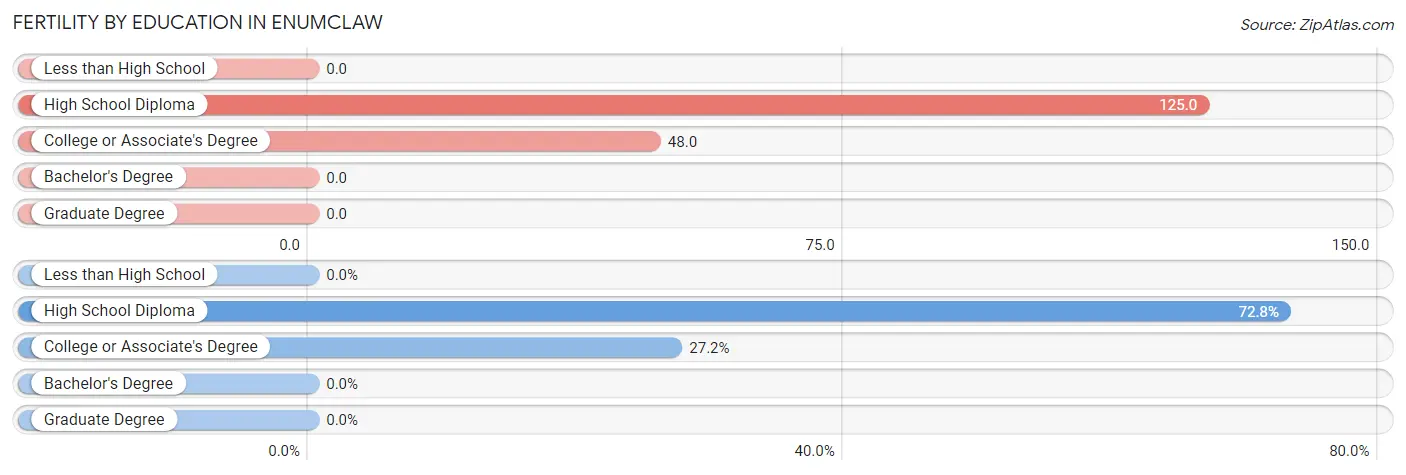
| Educational Attainment | Women with Births | Births / 1,000 Women |
| Less than High School | 0 (0.0%) | 0.0 |
| High School Diploma | 107 (72.8%) | 125.0 |
| College or Associate's Degree | 40 (27.2%) | 48.0 |
| Bachelor's Degree | 0 (0.0%) | 0.0 |
| Graduate Degree | 0 (0.0%) | 0.0 |
| Total | 147 (100.0%) | 53.0 |
Fertility by Education by Marriage Status in Enumclaw
22.5% of women with births in Enumclaw are unmarried. Women with the educational attainment of college or associate's degree are most likely to be married with 100.0% of them married at childbirth, while women with the educational attainment of high school diploma are least likely to be married with 30.8% of them unmarried at childbirth.
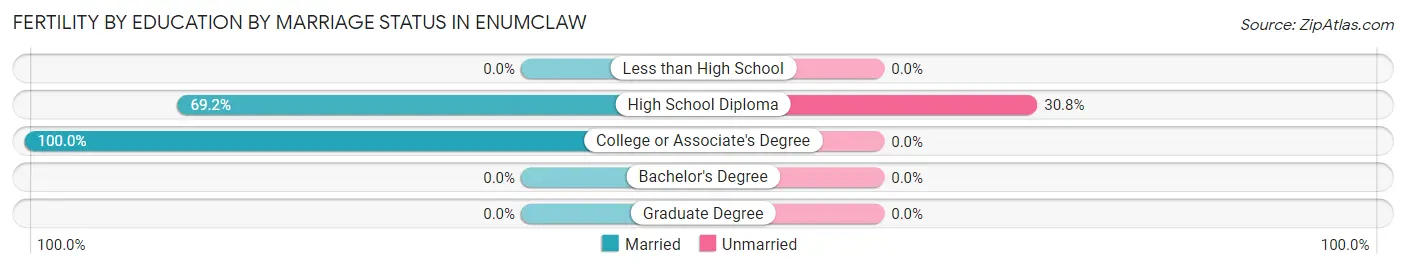
| Educational Attainment | Married | Unmarried |
| Less than High School | 0 (0.0%) | 0 (0.0%) |
| High School Diploma | 74 (69.2%) | 33 (30.8%) |
| College or Associate's Degree | 40 (100.0%) | 0 (0.0%) |
| Bachelor's Degree | 0 (0.0%) | 0 (0.0%) |
| Graduate Degree | 0 (0.0%) | 0 (0.0%) |
| Total | 114 (77.5%) | 33 (22.5%) |
Employment Characteristics in Enumclaw
Employment by Class of Employer in Enumclaw
Among the 6,540 employed individuals in Enumclaw, private company employees (4,734 | 72.4%), local government employees (639 | 9.8%), and not-for-profit organizations (341 | 5.2%) make up the most common classes of employment.
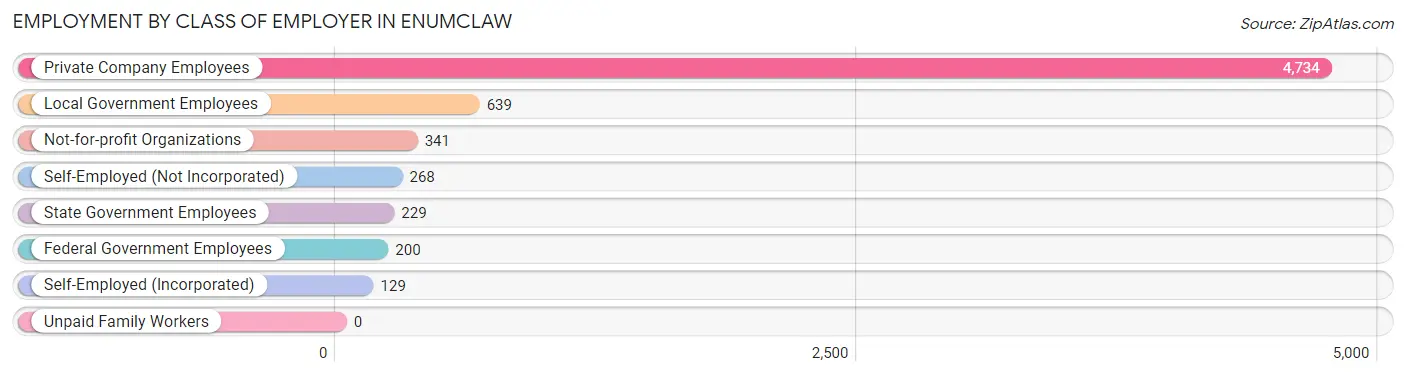
| Employer Class | # Employees | % Employees |
| Private Company Employees | 4,734 | 72.4% |
| Self-Employed (Incorporated) | 129 | 2.0% |
| Self-Employed (Not Incorporated) | 268 | 4.1% |
| Not-for-profit Organizations | 341 | 5.2% |
| Local Government Employees | 639 | 9.8% |
| State Government Employees | 229 | 3.5% |
| Federal Government Employees | 200 | 3.1% |
| Unpaid Family Workers | 0 | 0.0% |
| Total | 6,540 | 100.0% |
Employment Status by Age in Enumclaw
According to the labor force statistics for Enumclaw, out of the total population over 16 years of age (10,297), 67.7% or 6,971 individuals are in the labor force, with 4.2% or 293 of them unemployed. The age group with the highest labor force participation rate is 25 to 29 years, with 94.4% or 523 individuals in the labor force. Within the labor force, the 35 to 44 years age range has the highest percentage of unemployed individuals, with 10.1% or 153 of them being unemployed.
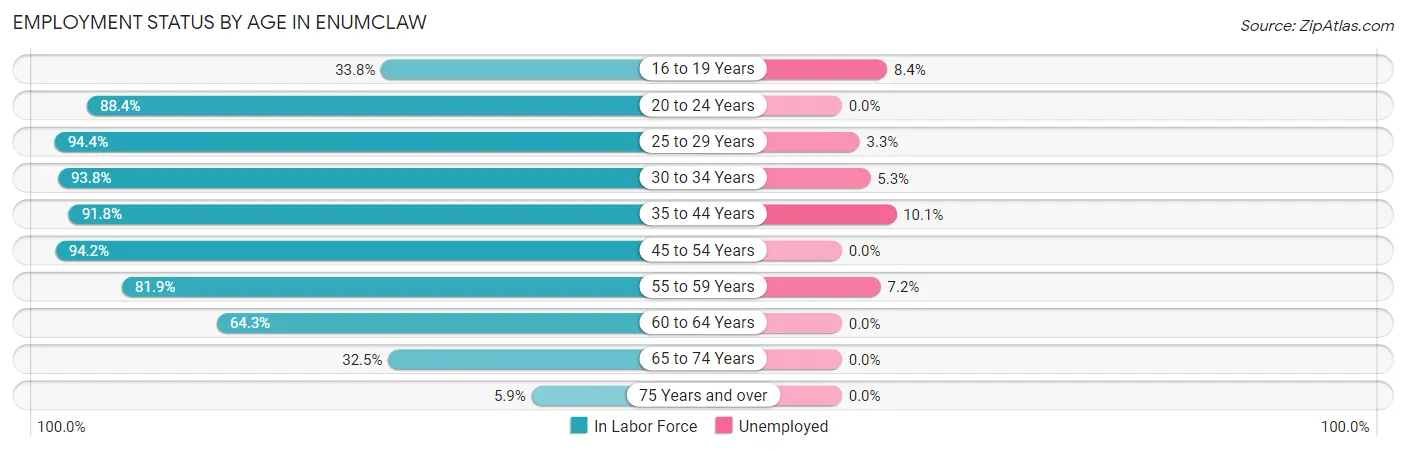
| Age Bracket | In Labor Force | Unemployed |
| 16 to 19 Years | 226 (33.8%) | 19 (8.4%) |
| 20 to 24 Years | 520 (88.4%) | 0 (0.0%) |
| 25 to 29 Years | 523 (94.4%) | 17 (3.3%) |
| 30 to 34 Years | 1,077 (93.8%) | 57 (5.3%) |
| 35 to 44 Years | 1,513 (91.8%) | 153 (10.1%) |
| 45 to 54 Years | 1,261 (94.2%) | 0 (0.0%) |
| 55 to 59 Years | 621 (81.9%) | 45 (7.2%) |
| 60 to 64 Years | 693 (64.3%) | 0 (0.0%) |
| 65 to 74 Years | 467 (32.5%) | 0 (0.0%) |
| 75 Years and over | 64 (5.9%) | 0 (0.0%) |
| Total | 6,971 (67.7%) | 293 (4.2%) |
Employment Status by Educational Attainment in Enumclaw
According to labor force statistics for Enumclaw, 87.2% of individuals (5,689) out of the total population between 25 and 64 years of age (6,524) are in the labor force, with 4.8% or 273 of them being unemployed. The group with the highest labor force participation rate are those with the educational attainment of less than high school, with 95.3% or 262 individuals in the labor force. Within the labor force, individuals with high school diploma education have the highest percentage of unemployment, with 8.4% or 153 of them being unemployed.
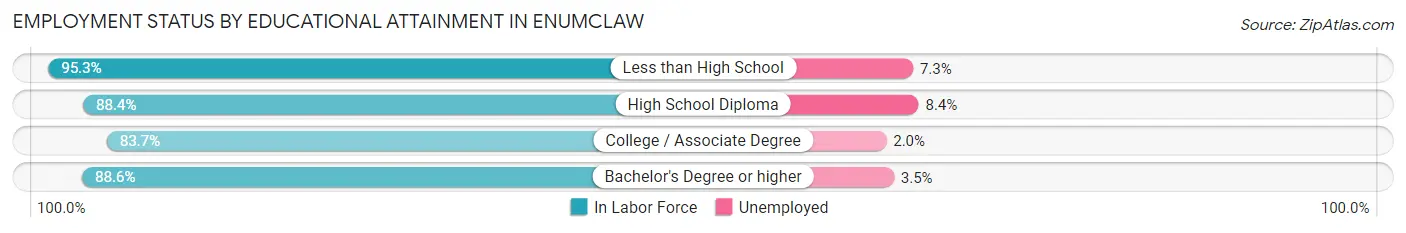
| Educational Attainment | In Labor Force | Unemployed |
| Less than High School | 262 (95.3%) | 20 (7.3%) |
| High School Diploma | 1,824 (88.4%) | 173 (8.4%) |
| College / Associate Degree | 1,817 (83.7%) | 43 (2.0%) |
| Bachelor's Degree or higher | 1,785 (88.6%) | 71 (3.5%) |
| Total | 5,689 (87.2%) | 313 (4.8%) |
Employment Occupations by Sex in Enumclaw
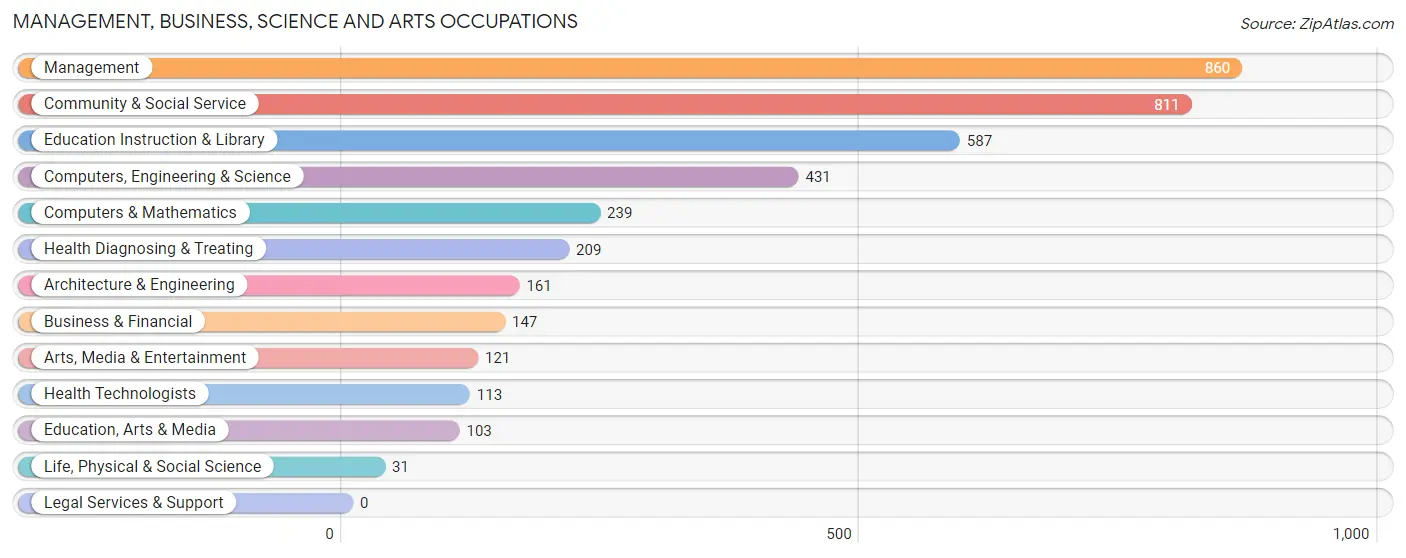
Management, Business, Science and Arts Occupations
The most common Management, Business, Science and Arts occupations in Enumclaw are Management (860 | 12.9%), Community & Social Service (811 | 12.2%), Education Instruction & Library (587 | 8.8%), Computers, Engineering & Science (431 | 6.5%), and Computers & Mathematics (239 | 3.6%).
Management, Business, Science and Arts Occupations by Sex
Within the Management, Business, Science and Arts occupations in Enumclaw, the most male-oriented occupations are Architecture & Engineering (91.9%), Computers, Engineering & Science (84.0%), and Computers & Mathematics (82.4%), while the most female-oriented occupations are Education Instruction & Library (82.6%), Community & Social Service (71.0%), and Health Diagnosing & Treating (66.0%).
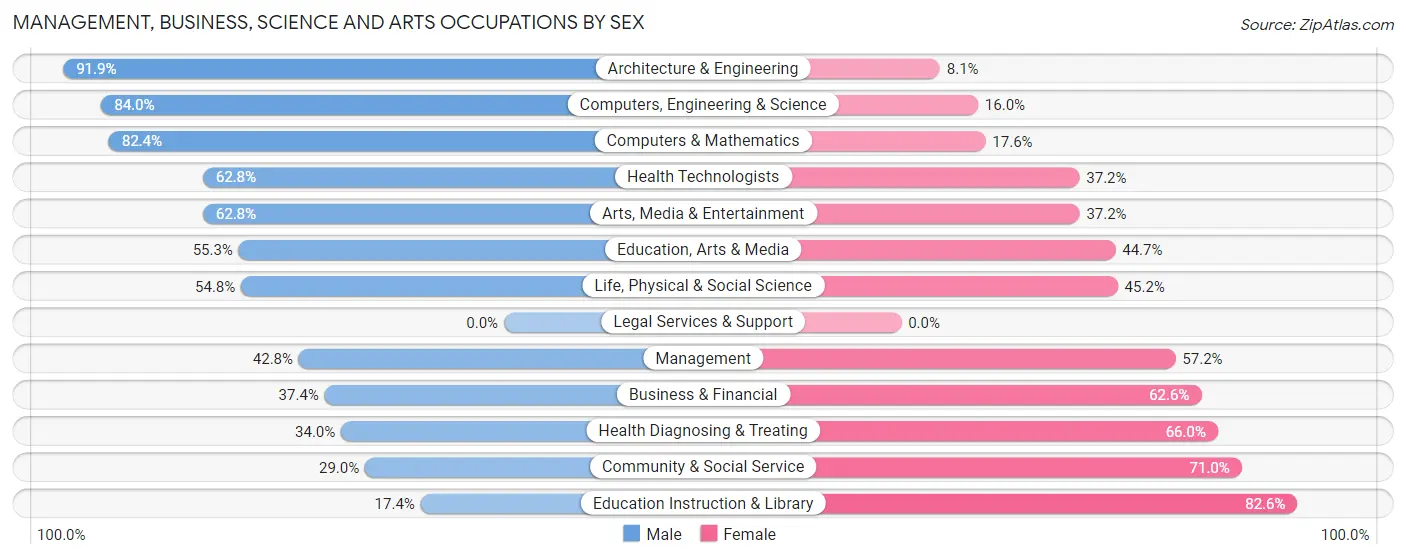
| Occupation | Male | Female |
| Management | 368 (42.8%) | 492 (57.2%) |
| Business & Financial | 55 (37.4%) | 92 (62.6%) |
| Computers, Engineering & Science | 362 (84.0%) | 69 (16.0%) |
| Computers & Mathematics | 197 (82.4%) | 42 (17.6%) |
| Architecture & Engineering | 148 (91.9%) | 13 (8.1%) |
| Life, Physical & Social Science | 17 (54.8%) | 14 (45.2%) |
| Community & Social Service | 235 (29.0%) | 576 (71.0%) |
| Education, Arts & Media | 57 (55.3%) | 46 (44.7%) |
| Legal Services & Support | 0 (0.0%) | 0 (0.0%) |
| Education Instruction & Library | 102 (17.4%) | 485 (82.6%) |
| Arts, Media & Entertainment | 76 (62.8%) | 45 (37.2%) |
| Health Diagnosing & Treating | 71 (34.0%) | 138 (66.0%) |
| Health Technologists | 71 (62.8%) | 42 (37.2%) |
| Total (Category) | 1,091 (44.4%) | 1,367 (55.6%) |
| Total (Overall) | 3,226 (48.5%) | 3,431 (51.5%) |
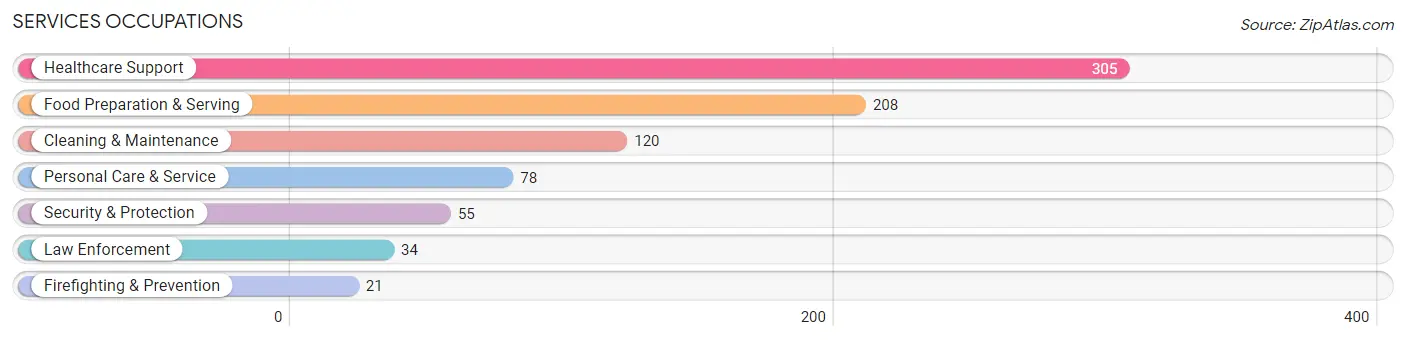
Services Occupations
The most common Services occupations in Enumclaw are Healthcare Support (305 | 4.6%), Food Preparation & Serving (208 | 3.1%), Cleaning & Maintenance (120 | 1.8%), Personal Care & Service (78 | 1.2%), and Security & Protection (55 | 0.8%).
Services Occupations by Sex
Within the Services occupations in Enumclaw, the most male-oriented occupations are Law Enforcement (100.0%), Security & Protection (61.8%), and Cleaning & Maintenance (27.5%), while the most female-oriented occupations are Firefighting & Prevention (100.0%), Healthcare Support (95.7%), and Food Preparation & Serving (75.0%).
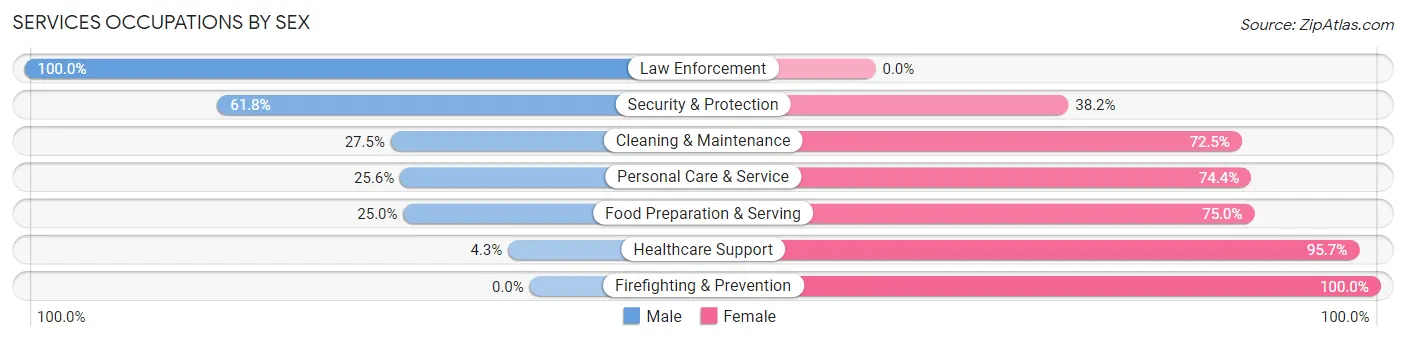
| Occupation | Male | Female |
| Healthcare Support | 13 (4.3%) | 292 (95.7%) |
| Security & Protection | 34 (61.8%) | 21 (38.2%) |
| Firefighting & Prevention | 0 (0.0%) | 21 (100.0%) |
| Law Enforcement | 34 (100.0%) | 0 (0.0%) |
| Food Preparation & Serving | 52 (25.0%) | 156 (75.0%) |
| Cleaning & Maintenance | 33 (27.5%) | 87 (72.5%) |
| Personal Care & Service | 20 (25.6%) | 58 (74.4%) |
| Total (Category) | 152 (19.8%) | 614 (80.2%) |
| Total (Overall) | 3,226 (48.5%) | 3,431 (51.5%) |
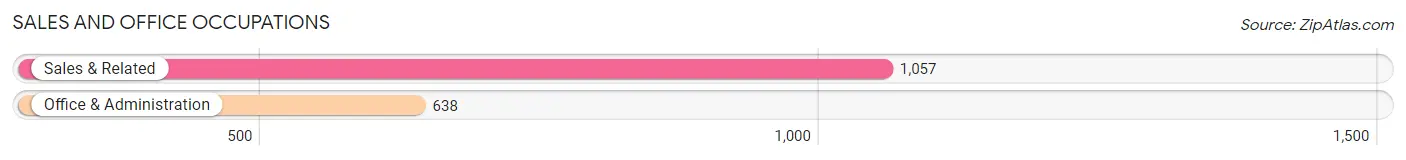
Sales and Office Occupations
The most common Sales and Office occupations in Enumclaw are Sales & Related (1,057 | 15.9%), and Office & Administration (638 | 9.6%).
Sales and Office Occupations by Sex
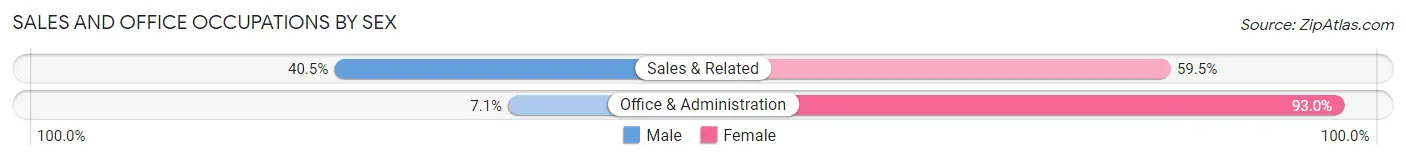
| Occupation | Male | Female |
| Sales & Related | 428 (40.5%) | 629 (59.5%) |
| Office & Administration | 45 (7.0%) | 593 (92.9%) |
| Total (Category) | 473 (27.9%) | 1,222 (72.1%) |
| Total (Overall) | 3,226 (48.5%) | 3,431 (51.5%) |
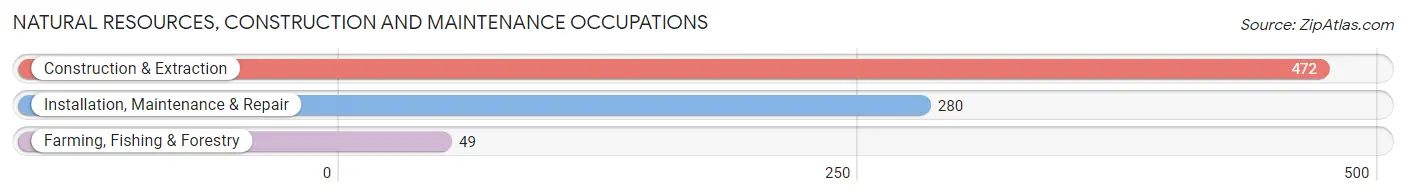
Natural Resources, Construction and Maintenance Occupations
The most common Natural Resources, Construction and Maintenance occupations in Enumclaw are Construction & Extraction (472 | 7.1%), Installation, Maintenance & Repair (280 | 4.2%), and Farming, Fishing & Forestry (49 | 0.7%).
Natural Resources, Construction and Maintenance Occupations by Sex
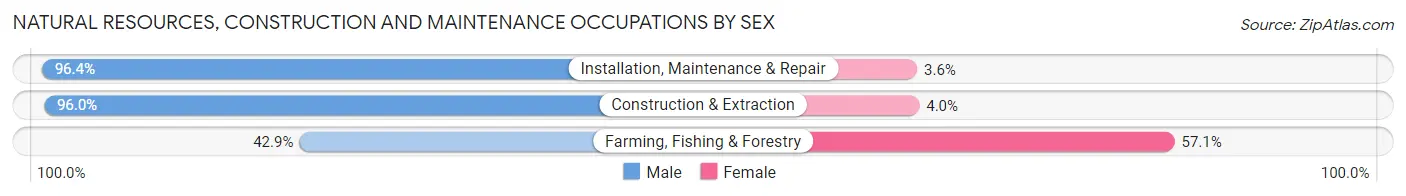
| Occupation | Male | Female |
| Farming, Fishing & Forestry | 21 (42.9%) | 28 (57.1%) |
| Construction & Extraction | 453 (96.0%) | 19 (4.0%) |
| Installation, Maintenance & Repair | 270 (96.4%) | 10 (3.6%) |
| Total (Category) | 744 (92.9%) | 57 (7.1%) |
| Total (Overall) | 3,226 (48.5%) | 3,431 (51.5%) |
Production, Transportation and Moving Occupations
The most common Production, Transportation and Moving occupations in Enumclaw are Production (397 | 6.0%), Material Moving (312 | 4.7%), and Transportation (228 | 3.4%).
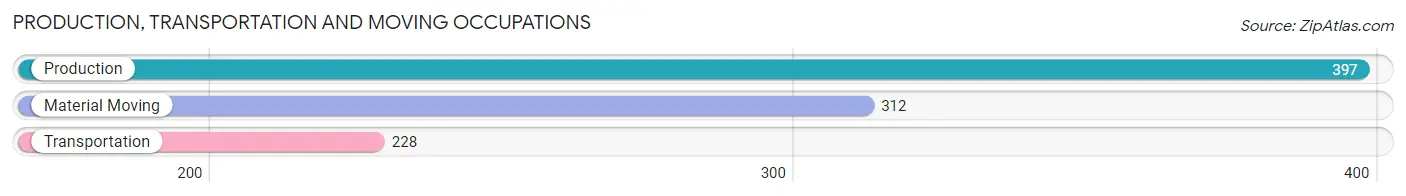
Production, Transportation and Moving Occupations by Sex
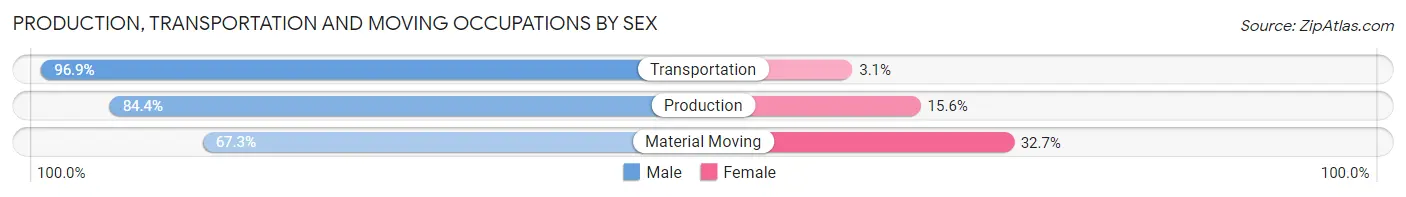
| Occupation | Male | Female |
| Production | 335 (84.4%) | 62 (15.6%) |
| Transportation | 221 (96.9%) | 7 (3.1%) |
| Material Moving | 210 (67.3%) | 102 (32.7%) |
| Total (Category) | 766 (81.8%) | 171 (18.2%) |
| Total (Overall) | 3,226 (48.5%) | 3,431 (51.5%) |
Employment Industries by Sex in Enumclaw
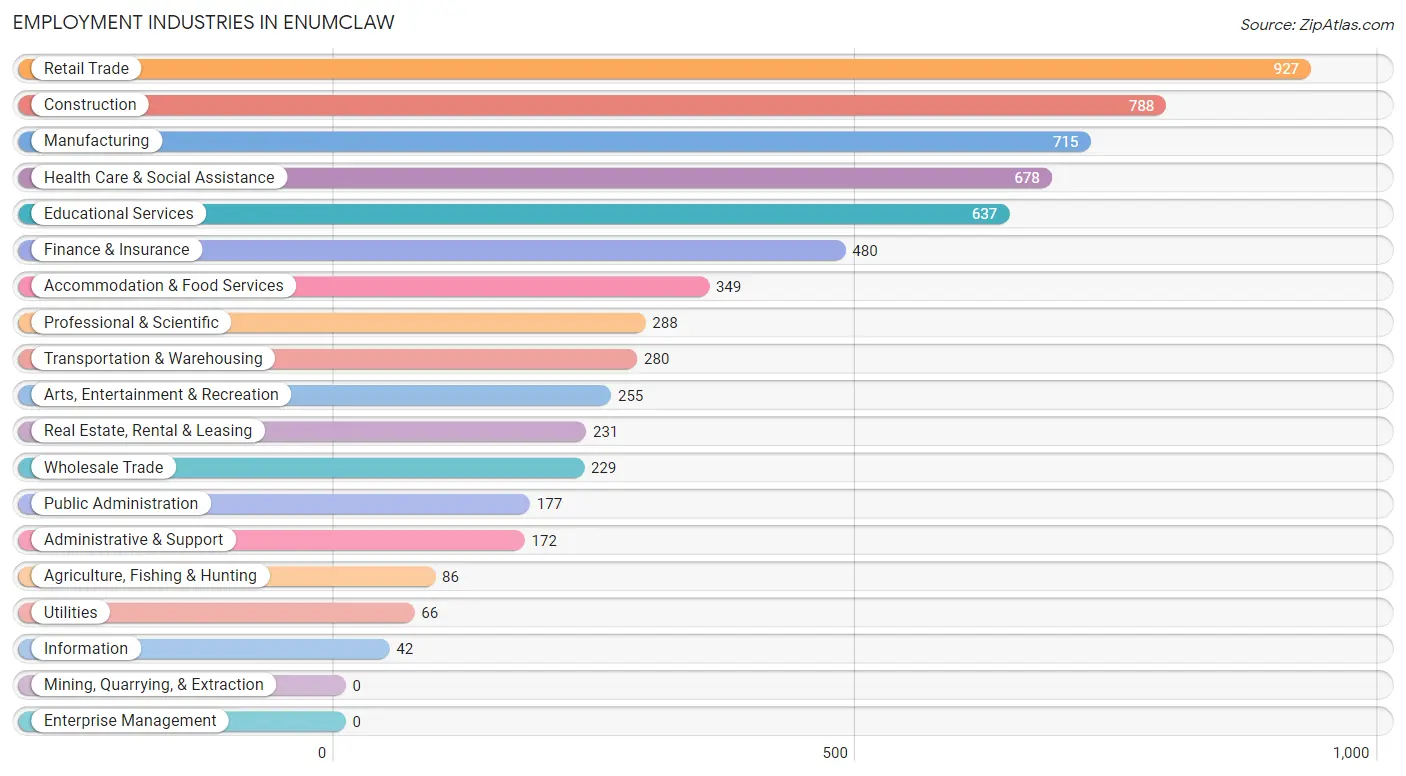
Employment Industries in Enumclaw
The major employment industries in Enumclaw include Retail Trade (927 | 13.9%), Construction (788 | 11.8%), Manufacturing (715 | 10.7%), Health Care & Social Assistance (678 | 10.2%), and Educational Services (637 | 9.6%).
Employment Industries by Sex in Enumclaw
The Enumclaw industries that see more men than women are Wholesale Trade (93.0%), Construction (86.2%), and Manufacturing (84.1%), whereas the industries that tend to have a higher number of women are Finance & Insurance (89.4%), Health Care & Social Assistance (88.9%), and Information (85.7%).
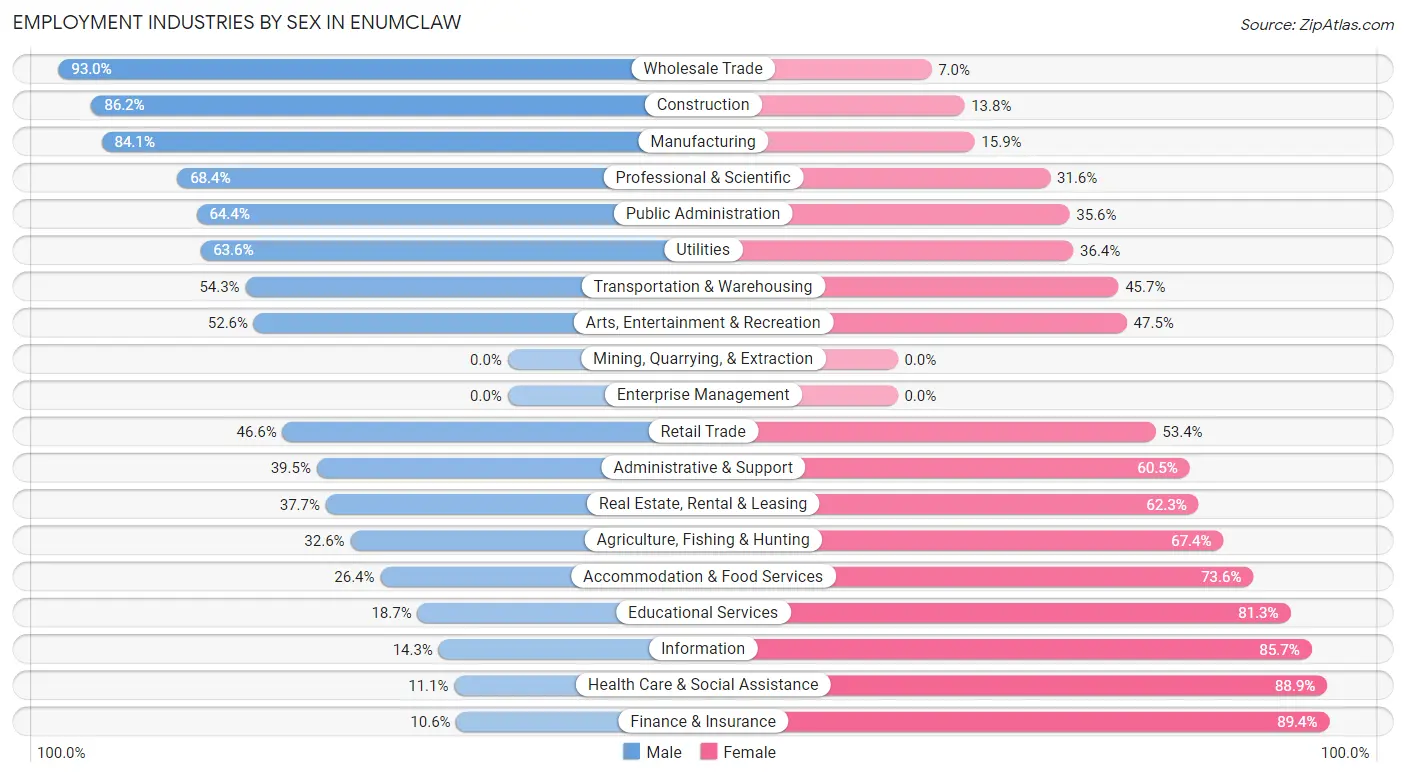
| Industry | Male | Female |
| Agriculture, Fishing & Hunting | 28 (32.6%) | 58 (67.4%) |
| Mining, Quarrying, & Extraction | 0 (0.0%) | 0 (0.0%) |
| Construction | 679 (86.2%) | 109 (13.8%) |
| Manufacturing | 601 (84.1%) | 114 (15.9%) |
| Wholesale Trade | 213 (93.0%) | 16 (7.0%) |
| Retail Trade | 432 (46.6%) | 495 (53.4%) |
| Transportation & Warehousing | 152 (54.3%) | 128 (45.7%) |
| Utilities | 42 (63.6%) | 24 (36.4%) |
| Information | 6 (14.3%) | 36 (85.7%) |
| Finance & Insurance | 51 (10.6%) | 429 (89.4%) |
| Real Estate, Rental & Leasing | 87 (37.7%) | 144 (62.3%) |
| Professional & Scientific | 197 (68.4%) | 91 (31.6%) |
| Enterprise Management | 0 (0.0%) | 0 (0.0%) |
| Administrative & Support | 68 (39.5%) | 104 (60.5%) |
| Educational Services | 119 (18.7%) | 518 (81.3%) |
| Health Care & Social Assistance | 75 (11.1%) | 603 (88.9%) |
| Arts, Entertainment & Recreation | 134 (52.5%) | 121 (47.4%) |
| Accommodation & Food Services | 92 (26.4%) | 257 (73.6%) |
| Public Administration | 114 (64.4%) | 63 (35.6%) |
| Total | 3,226 (48.5%) | 3,431 (51.5%) |
Education in Enumclaw
School Enrollment in Enumclaw
The most common levels of schooling among the 2,483 students in Enumclaw are elementary school (655 | 26.4%), high school (633 | 25.5%), and middle school (516 | 20.8%).
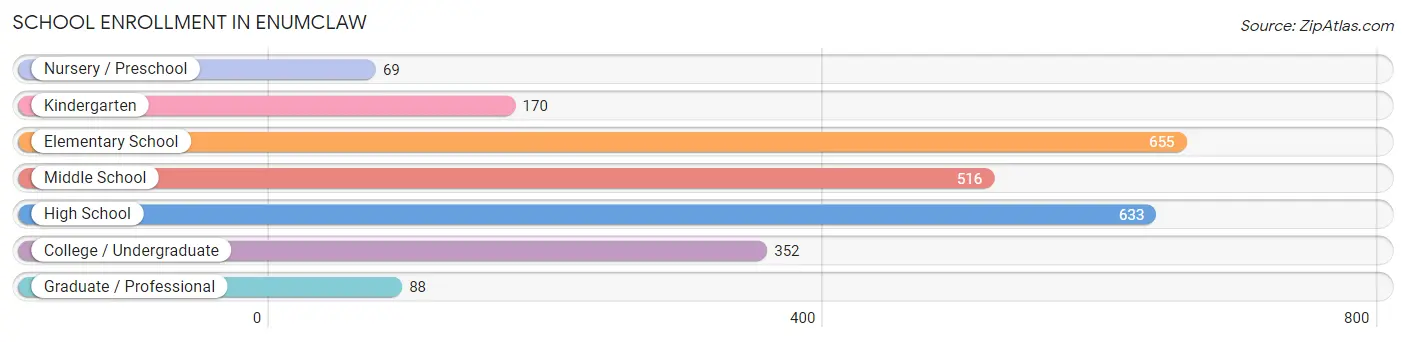
| School Level | # Students | % Students |
| Nursery / Preschool | 69 | 2.8% |
| Kindergarten | 170 | 6.9% |
| Elementary School | 655 | 26.4% |
| Middle School | 516 | 20.8% |
| High School | 633 | 25.5% |
| College / Undergraduate | 352 | 14.2% |
| Graduate / Professional | 88 | 3.5% |
| Total | 2,483 | 100.0% |
School Enrollment by Age by Funding Source in Enumclaw
Out of a total of 2,483 students who are enrolled in schools in Enumclaw, 201 (8.1%) attend a private institution, while the remaining 2,282 (91.9%) are enrolled in public schools. The age group of 25 to 34 year olds has the highest likelihood of being enrolled in private schools, with 53 (46.9% in the age bracket) enrolled. Conversely, the age group of 3 to 4 year olds has the lowest likelihood of being enrolled in a private school, with 32 (100.0% in the age bracket) attending a public institution.
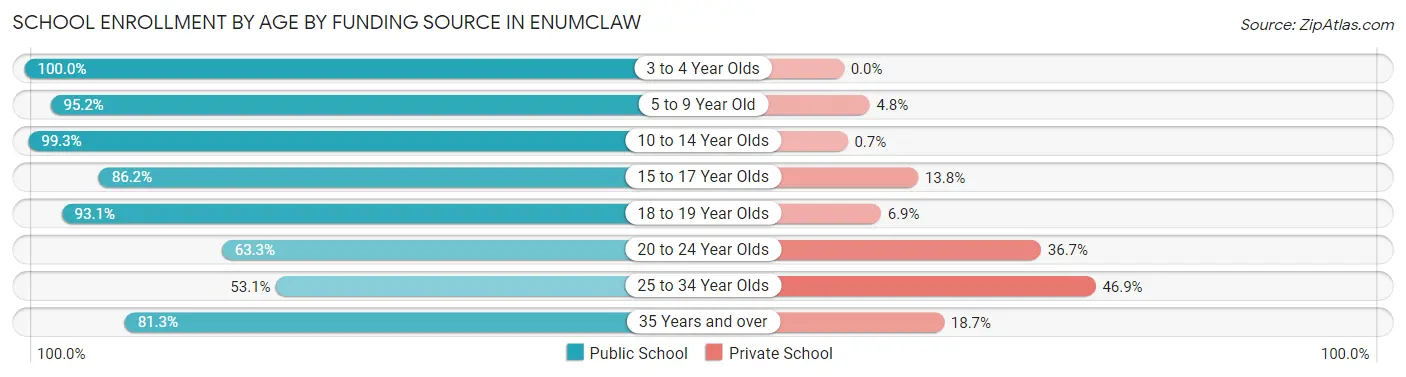
| Age Bracket | Public School | Private School |
| 3 to 4 Year Olds | 32 (100.0%) | 0 (0.0%) |
| 5 to 9 Year Old | 593 (95.2%) | 30 (4.8%) |
| 10 to 14 Year Olds | 846 (99.3%) | 6 (0.7%) |
| 15 to 17 Year Olds | 274 (86.2%) | 44 (13.8%) |
| 18 to 19 Year Olds | 337 (93.1%) | 25 (6.9%) |
| 20 to 24 Year Olds | 31 (63.3%) | 18 (36.7%) |
| 25 to 34 Year Olds | 60 (53.1%) | 53 (46.9%) |
| 35 Years and over | 109 (81.3%) | 25 (18.7%) |
| Total | 2,282 (91.9%) | 201 (8.1%) |
Educational Attainment by Field of Study in Enumclaw
Education (538 | 17.7%), liberal arts & history (418 | 13.7%), business (371 | 12.2%), science & technology (298 | 9.8%), and social sciences (198 | 6.5%) are the most common fields of study among 3,043 individuals in Enumclaw who have obtained a bachelor's degree or higher.
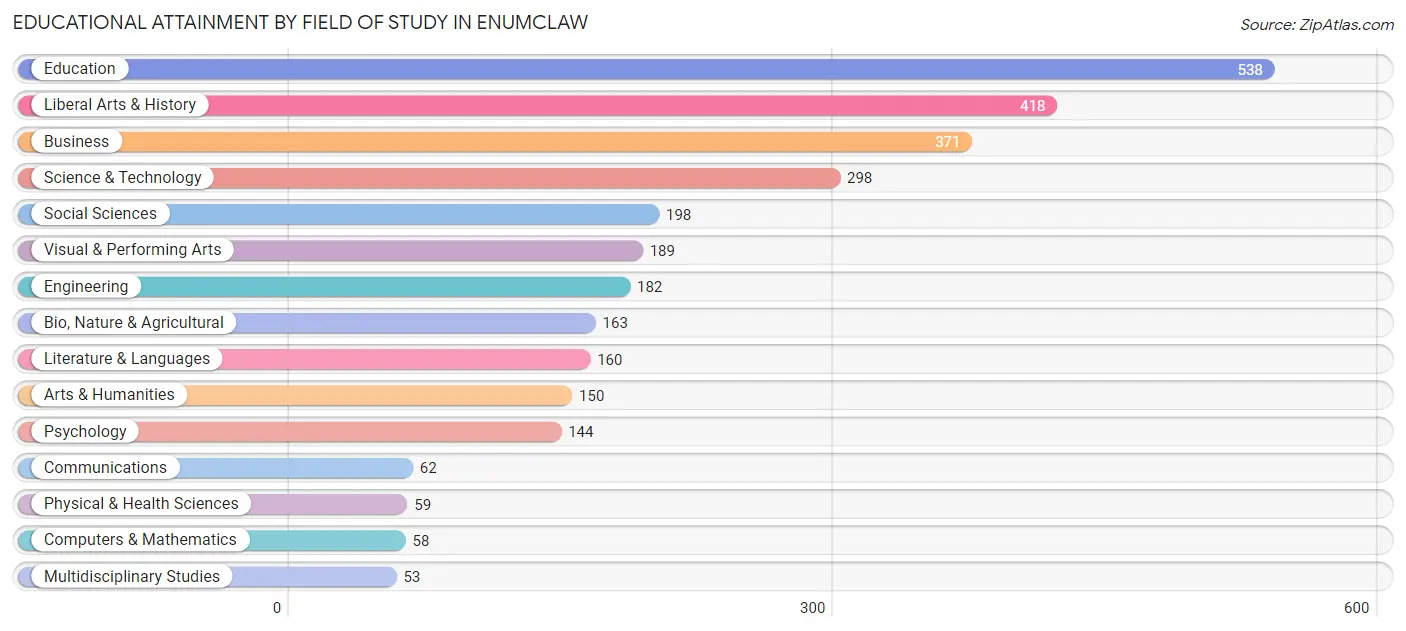
| Field of Study | # Graduates | % Graduates |
| Computers & Mathematics | 58 | 1.9% |
| Bio, Nature & Agricultural | 163 | 5.4% |
| Physical & Health Sciences | 59 | 1.9% |
| Psychology | 144 | 4.7% |
| Social Sciences | 198 | 6.5% |
| Engineering | 182 | 6.0% |
| Multidisciplinary Studies | 53 | 1.7% |
| Science & Technology | 298 | 9.8% |
| Business | 371 | 12.2% |
| Education | 538 | 17.7% |
| Literature & Languages | 160 | 5.3% |
| Liberal Arts & History | 418 | 13.7% |
| Visual & Performing Arts | 189 | 6.2% |
| Communications | 62 | 2.0% |
| Arts & Humanities | 150 | 4.9% |
| Total | 3,043 | 100.0% |
Transportation & Commute in Enumclaw
Vehicle Availability by Sex in Enumclaw
The most prevalent vehicle ownership categories in Enumclaw are males with 2 vehicles (1,287, accounting for 40.3%) and females with 2 vehicles (1,440, making up 38.5%).
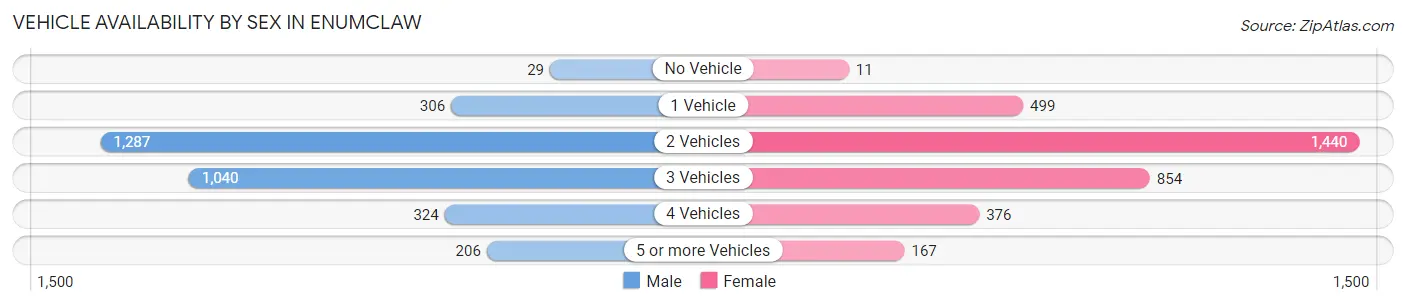
| Vehicles Available | Male | Female |
| No Vehicle | 29 (0.9%) | 11 (0.3%) |
| 1 Vehicle | 306 (9.6%) | 499 (14.9%) |
| 2 Vehicles | 1,287 (40.3%) | 1,440 (43.0%) |
| 3 Vehicles | 1,040 (32.6%) | 854 (25.5%) |
| 4 Vehicles | 324 (10.2%) | 376 (11.2%) |
| 5 or more Vehicles | 206 (6.5%) | 167 (5.0%) |
| Total | 3,192 (100.0%) | 3,347 (100.0%) |
Commute Time in Enumclaw
The most frequently occuring commute durations in Enumclaw are 45 to 59 minutes (1,063 commuters, 17.9%), 5 to 9 minutes (968 commuters, 16.3%), and 30 to 34 minutes (934 commuters, 15.7%).
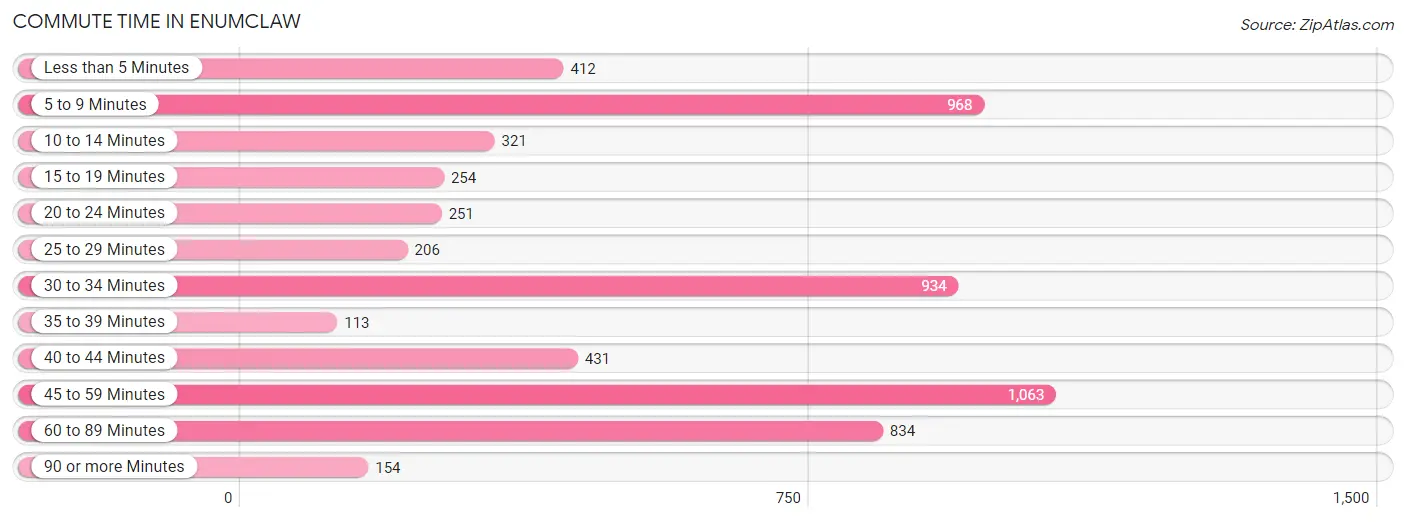
| Commute Time | # Commuters | % Commuters |
| Less than 5 Minutes | 412 | 6.9% |
| 5 to 9 Minutes | 968 | 16.3% |
| 10 to 14 Minutes | 321 | 5.4% |
| 15 to 19 Minutes | 254 | 4.3% |
| 20 to 24 Minutes | 251 | 4.2% |
| 25 to 29 Minutes | 206 | 3.5% |
| 30 to 34 Minutes | 934 | 15.7% |
| 35 to 39 Minutes | 113 | 1.9% |
| 40 to 44 Minutes | 431 | 7.2% |
| 45 to 59 Minutes | 1,063 | 17.9% |
| 60 to 89 Minutes | 834 | 14.0% |
| 90 or more Minutes | 154 | 2.6% |
Commute Time by Sex in Enumclaw
The most common commute times in Enumclaw are 45 to 59 minutes (883 commuters, 29.9%) for males and 30 to 34 minutes (675 commuters, 22.6%) for females.
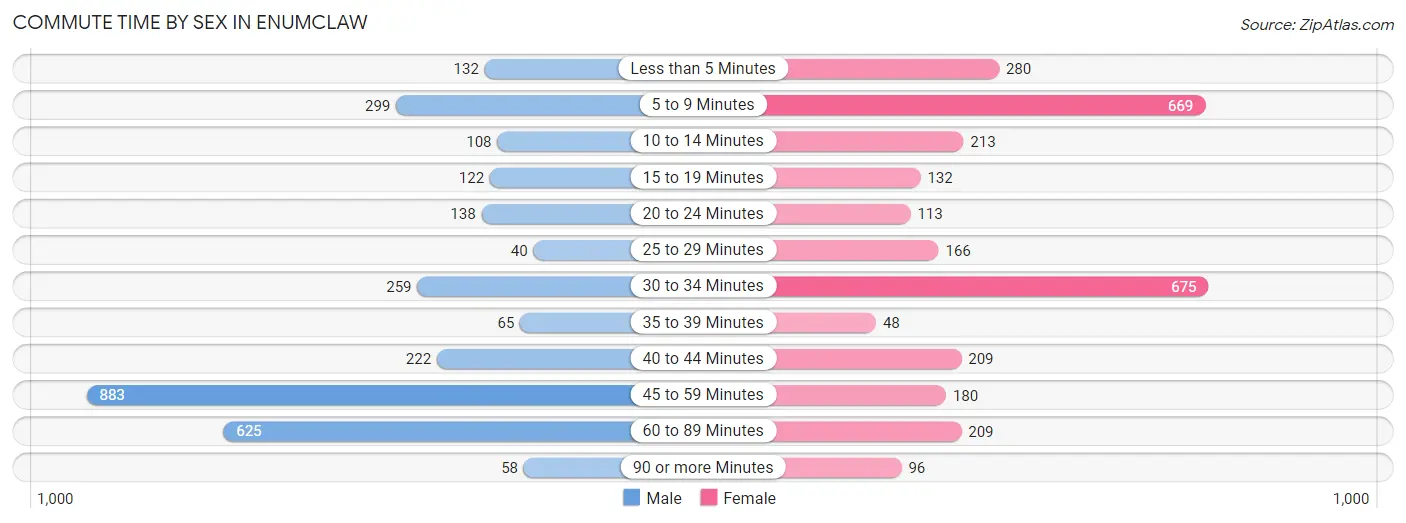
| Commute Time | Male | Female |
| Less than 5 Minutes | 132 (4.5%) | 280 (9.4%) |
| 5 to 9 Minutes | 299 (10.1%) | 669 (22.4%) |
| 10 to 14 Minutes | 108 (3.7%) | 213 (7.1%) |
| 15 to 19 Minutes | 122 (4.1%) | 132 (4.4%) |
| 20 to 24 Minutes | 138 (4.7%) | 113 (3.8%) |
| 25 to 29 Minutes | 40 (1.4%) | 166 (5.6%) |
| 30 to 34 Minutes | 259 (8.8%) | 675 (22.6%) |
| 35 to 39 Minutes | 65 (2.2%) | 48 (1.6%) |
| 40 to 44 Minutes | 222 (7.5%) | 209 (7.0%) |
| 45 to 59 Minutes | 883 (29.9%) | 180 (6.0%) |
| 60 to 89 Minutes | 625 (21.2%) | 209 (7.0%) |
| 90 or more Minutes | 58 (2.0%) | 96 (3.2%) |
Time of Departure to Work by Sex in Enumclaw
The most frequent times of departure to work in Enumclaw are 12:00 AM to 4:59 AM (876, 29.7%) for males and 7:00 AM to 7:29 AM (682, 22.8%) for females.
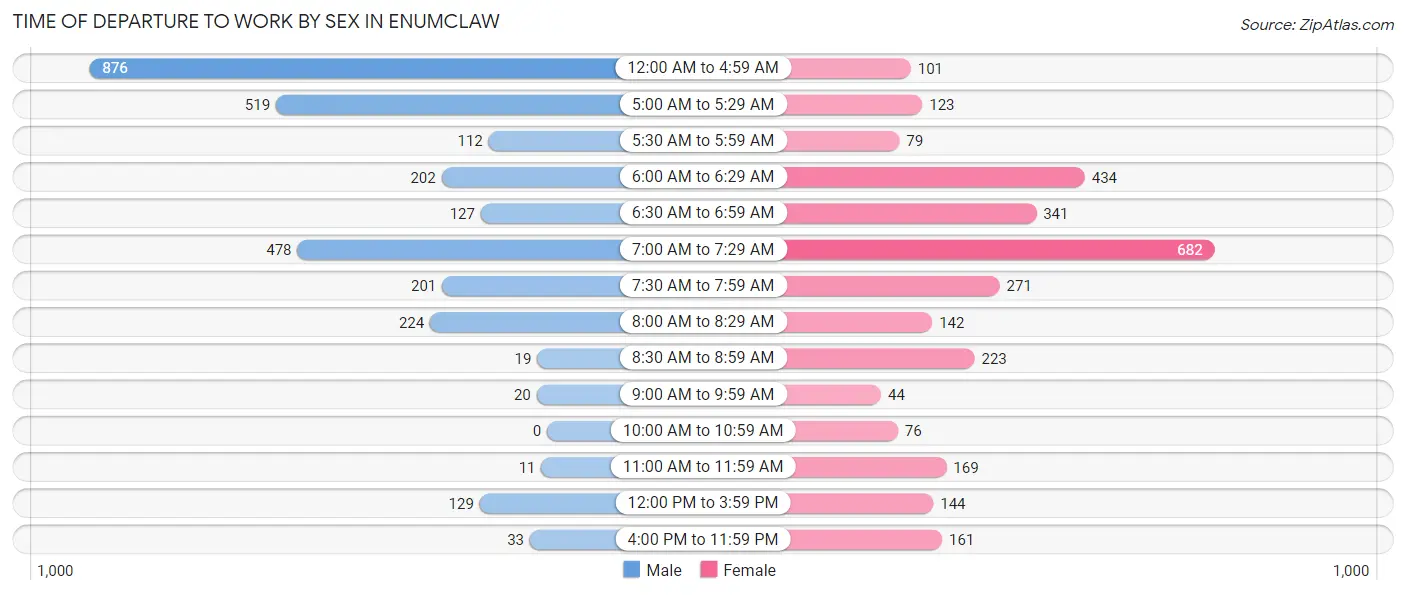
| Time of Departure | Male | Female |
| 12:00 AM to 4:59 AM | 876 (29.7%) | 101 (3.4%) |
| 5:00 AM to 5:29 AM | 519 (17.6%) | 123 (4.1%) |
| 5:30 AM to 5:59 AM | 112 (3.8%) | 79 (2.6%) |
| 6:00 AM to 6:29 AM | 202 (6.9%) | 434 (14.5%) |
| 6:30 AM to 6:59 AM | 127 (4.3%) | 341 (11.4%) |
| 7:00 AM to 7:29 AM | 478 (16.2%) | 682 (22.8%) |
| 7:30 AM to 7:59 AM | 201 (6.8%) | 271 (9.1%) |
| 8:00 AM to 8:29 AM | 224 (7.6%) | 142 (4.8%) |
| 8:30 AM to 8:59 AM | 19 (0.6%) | 223 (7.5%) |
| 9:00 AM to 9:59 AM | 20 (0.7%) | 44 (1.5%) |
| 10:00 AM to 10:59 AM | 0 (0.0%) | 76 (2.5%) |
| 11:00 AM to 11:59 AM | 11 (0.4%) | 169 (5.7%) |
| 12:00 PM to 3:59 PM | 129 (4.4%) | 144 (4.8%) |
| 4:00 PM to 11:59 PM | 33 (1.1%) | 161 (5.4%) |
| Total | 2,951 (100.0%) | 2,990 (100.0%) |
Housing Occupancy in Enumclaw
Occupancy by Ownership in Enumclaw
Of the total 5,260 dwellings in Enumclaw, owner-occupied units account for 3,860 (73.4%), while renter-occupied units make up 1,400 (26.6%).
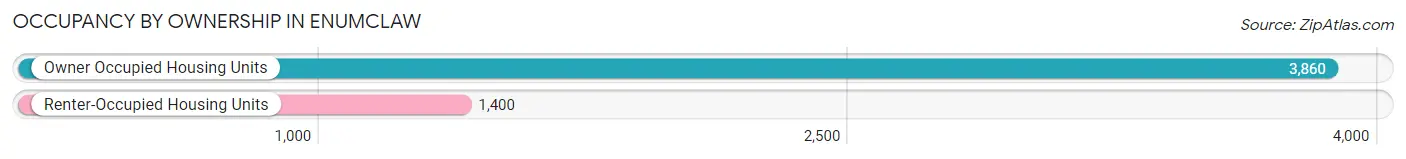
| Occupancy | # Housing Units | % Housing Units |
| Owner Occupied Housing Units | 3,860 | 73.4% |
| Renter-Occupied Housing Units | 1,400 | 26.6% |
| Total Occupied Housing Units | 5,260 | 100.0% |
Occupancy by Household Size in Enumclaw
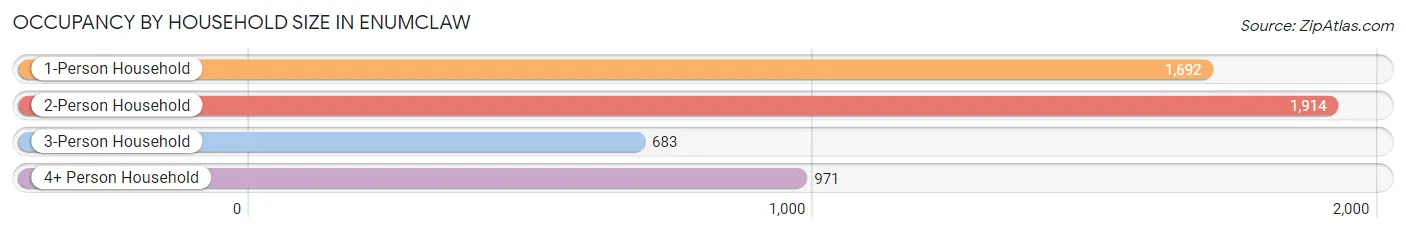
| Household Size | # Housing Units | % Housing Units |
| 1-Person Household | 1,692 | 32.2% |
| 2-Person Household | 1,914 | 36.4% |
| 3-Person Household | 683 | 13.0% |
| 4+ Person Household | 971 | 18.5% |
| Total Housing Units | 5,260 | 100.0% |
Occupancy by Ownership by Household Size in Enumclaw
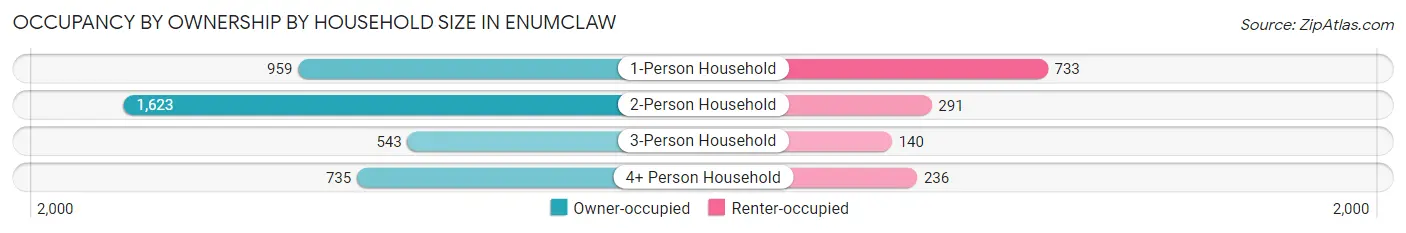
| Household Size | Owner-occupied | Renter-occupied |
| 1-Person Household | 959 (56.7%) | 733 (43.3%) |
| 2-Person Household | 1,623 (84.8%) | 291 (15.2%) |
| 3-Person Household | 543 (79.5%) | 140 (20.5%) |
| 4+ Person Household | 735 (75.7%) | 236 (24.3%) |
| Total Housing Units | 3,860 (73.4%) | 1,400 (26.6%) |
Occupancy by Educational Attainment in Enumclaw
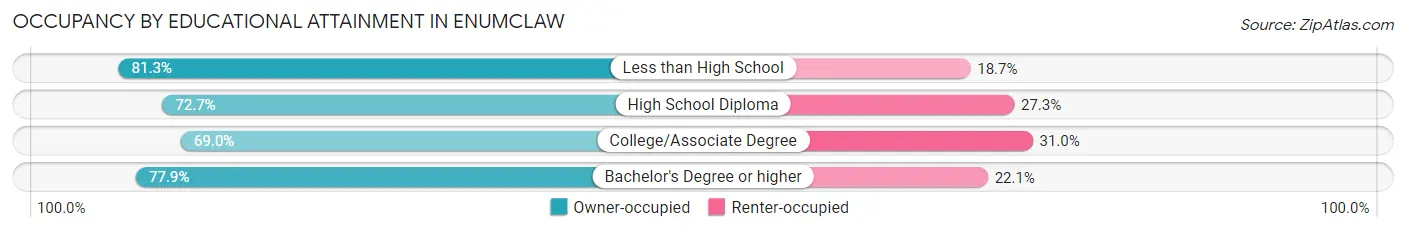
| Household Size | Owner-occupied | Renter-occupied |
| Less than High School | 109 (81.3%) | 25 (18.7%) |
| High School Diploma | 1,085 (72.7%) | 408 (27.3%) |
| College/Associate Degree | 1,271 (69.0%) | 571 (31.0%) |
| Bachelor's Degree or higher | 1,395 (77.9%) | 396 (22.1%) |
Occupancy by Age of Householder in Enumclaw
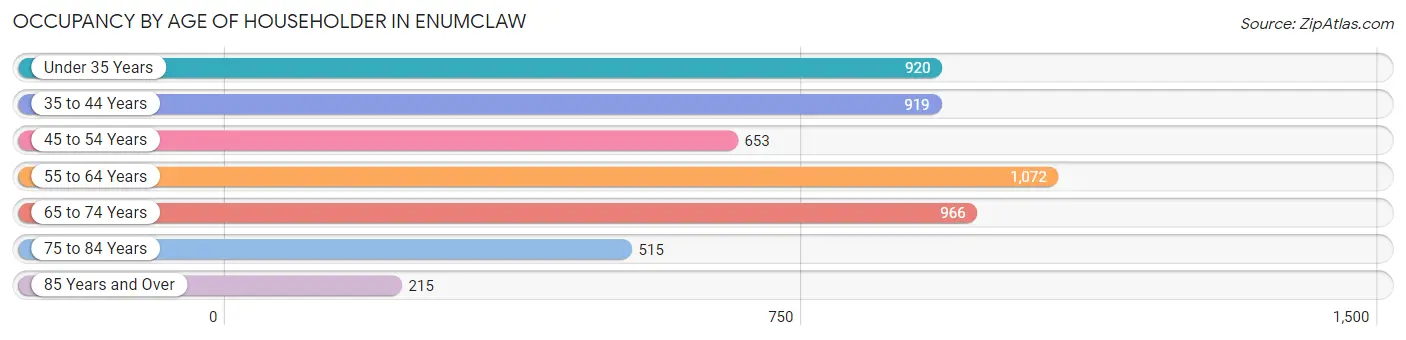
| Age Bracket | # Households | % Households |
| Under 35 Years | 920 | 17.5% |
| 35 to 44 Years | 919 | 17.5% |
| 45 to 54 Years | 653 | 12.4% |
| 55 to 64 Years | 1,072 | 20.4% |
| 65 to 74 Years | 966 | 18.4% |
| 75 to 84 Years | 515 | 9.8% |
| 85 Years and Over | 215 | 4.1% |
| Total | 5,260 | 100.0% |
Housing Finances in Enumclaw
Median Income by Occupancy in Enumclaw
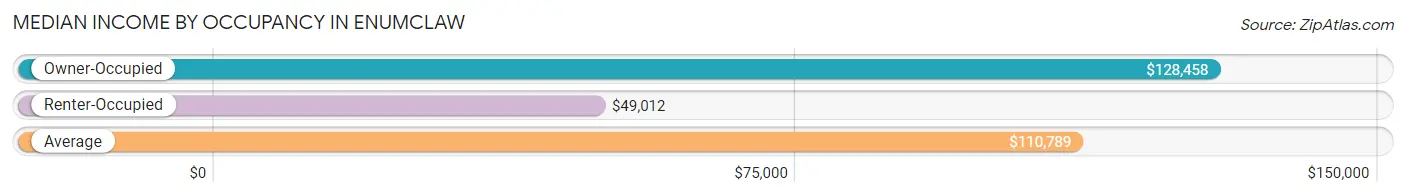
| Occupancy Type | # Households | Median Income |
| Owner-Occupied | 3,860 (73.4%) | $128,458 |
| Renter-Occupied | 1,400 (26.6%) | $49,012 |
| Average | 5,260 (100.0%) | $110,789 |
Occupancy by Householder Income Bracket in Enumclaw
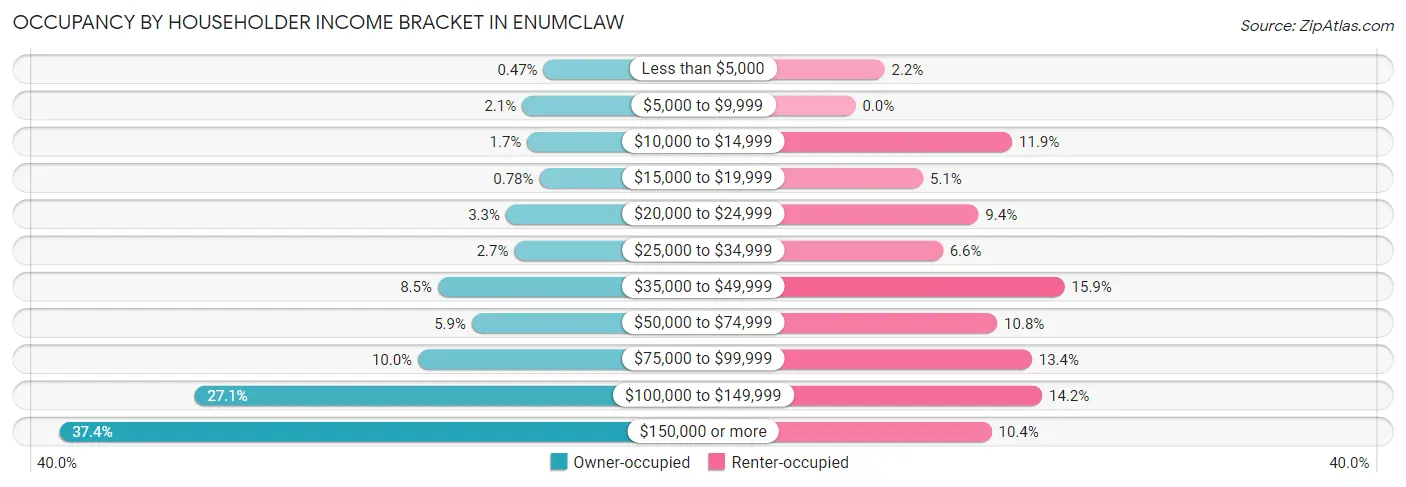
| Income Bracket | Owner-occupied | Renter-occupied |
| Less than $5,000 | 18 (0.5%) | 31 (2.2%) |
| $5,000 to $9,999 | 81 (2.1%) | 0 (0.0%) |
| $10,000 to $14,999 | 66 (1.7%) | 167 (11.9%) |
| $15,000 to $19,999 | 30 (0.8%) | 72 (5.1%) |
| $20,000 to $24,999 | 129 (3.3%) | 131 (9.4%) |
| $25,000 to $34,999 | 104 (2.7%) | 93 (6.6%) |
| $35,000 to $49,999 | 329 (8.5%) | 223 (15.9%) |
| $50,000 to $74,999 | 229 (5.9%) | 151 (10.8%) |
| $75,000 to $99,999 | 387 (10.0%) | 188 (13.4%) |
| $100,000 to $149,999 | 1,045 (27.1%) | 199 (14.2%) |
| $150,000 or more | 1,442 (37.4%) | 145 (10.4%) |
| Total | 3,860 (100.0%) | 1,400 (100.0%) |
Monthly Housing Cost Tiers in Enumclaw
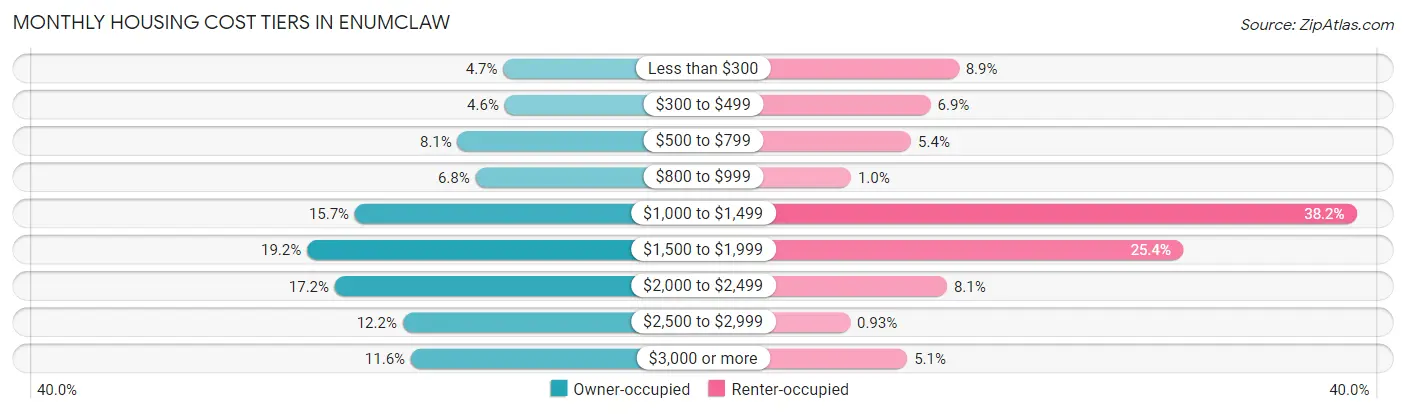
| Monthly Cost | Owner-occupied | Renter-occupied |
| Less than $300 | 183 (4.7%) | 125 (8.9%) |
| $300 to $499 | 179 (4.6%) | 96 (6.9%) |
| $500 to $799 | 313 (8.1%) | 76 (5.4%) |
| $800 to $999 | 262 (6.8%) | 14 (1.0%) |
| $1,000 to $1,499 | 605 (15.7%) | 535 (38.2%) |
| $1,500 to $1,999 | 741 (19.2%) | 356 (25.4%) |
| $2,000 to $2,499 | 662 (17.2%) | 113 (8.1%) |
| $2,500 to $2,999 | 469 (12.1%) | 13 (0.9%) |
| $3,000 or more | 446 (11.6%) | 72 (5.1%) |
| Total | 3,860 (100.0%) | 1,400 (100.0%) |
Physical Housing Characteristics in Enumclaw
Housing Structures in Enumclaw
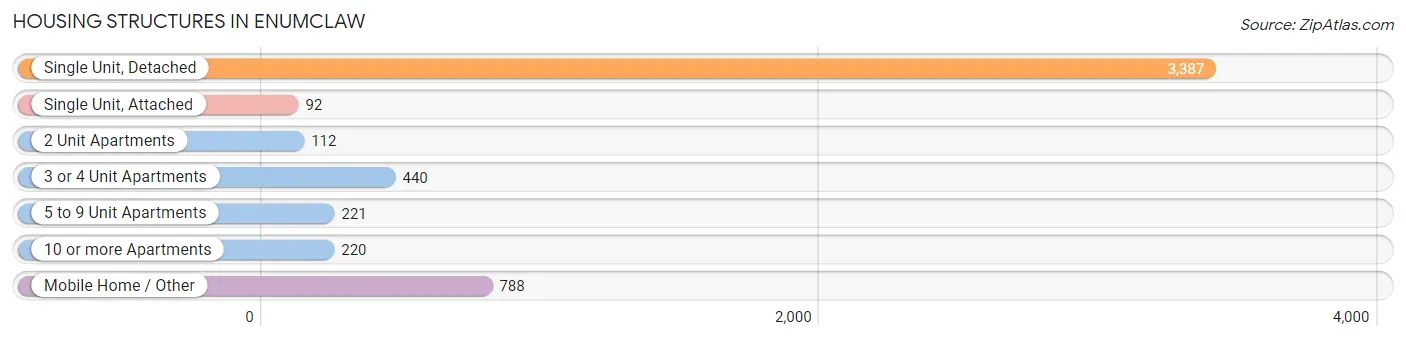
| Structure Type | # Housing Units | % Housing Units |
| Single Unit, Detached | 3,387 | 64.4% |
| Single Unit, Attached | 92 | 1.8% |
| 2 Unit Apartments | 112 | 2.1% |
| 3 or 4 Unit Apartments | 440 | 8.4% |
| 5 to 9 Unit Apartments | 221 | 4.2% |
| 10 or more Apartments | 220 | 4.2% |
| Mobile Home / Other | 788 | 15.0% |
| Total | 5,260 | 100.0% |
Housing Structures by Occupancy in Enumclaw
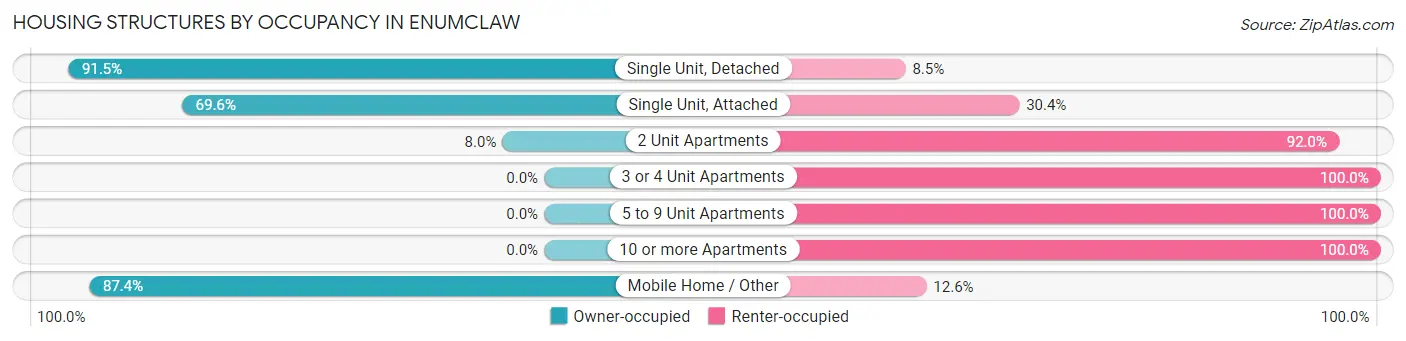
| Structure Type | Owner-occupied | Renter-occupied |
| Single Unit, Detached | 3,098 (91.5%) | 289 (8.5%) |
| Single Unit, Attached | 64 (69.6%) | 28 (30.4%) |
| 2 Unit Apartments | 9 (8.0%) | 103 (92.0%) |
| 3 or 4 Unit Apartments | 0 (0.0%) | 440 (100.0%) |
| 5 to 9 Unit Apartments | 0 (0.0%) | 221 (100.0%) |
| 10 or more Apartments | 0 (0.0%) | 220 (100.0%) |
| Mobile Home / Other | 689 (87.4%) | 99 (12.6%) |
| Total | 3,860 (73.4%) | 1,400 (26.6%) |
Housing Structures by Number of Rooms in Enumclaw
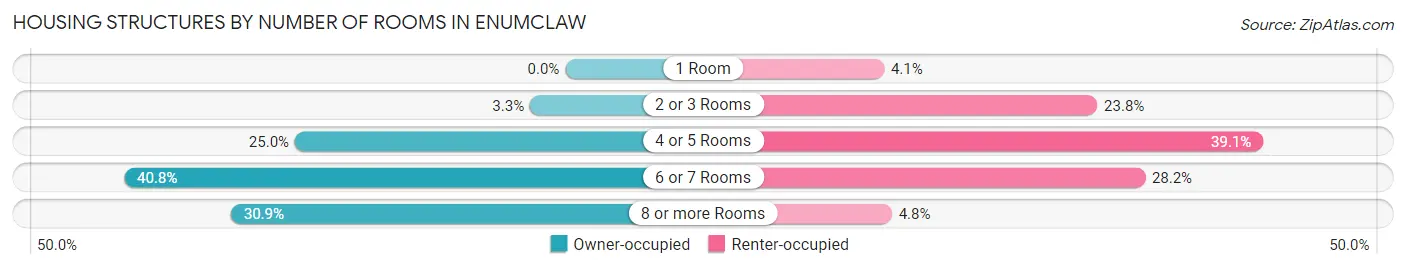
| Number of Rooms | Owner-occupied | Renter-occupied |
| 1 Room | 0 (0.0%) | 57 (4.1%) |
| 2 or 3 Rooms | 126 (3.3%) | 333 (23.8%) |
| 4 or 5 Rooms | 965 (25.0%) | 548 (39.1%) |
| 6 or 7 Rooms | 1,575 (40.8%) | 395 (28.2%) |
| 8 or more Rooms | 1,194 (30.9%) | 67 (4.8%) |
| Total | 3,860 (100.0%) | 1,400 (100.0%) |
Housing Structure by Heating Type in Enumclaw
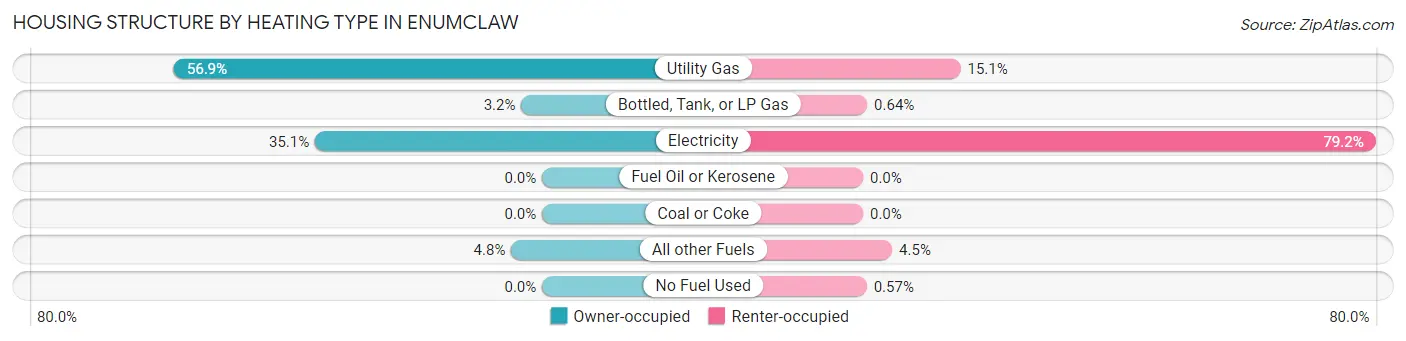
| Heating Type | Owner-occupied | Renter-occupied |
| Utility Gas | 2,197 (56.9%) | 211 (15.1%) |
| Bottled, Tank, or LP Gas | 124 (3.2%) | 9 (0.6%) |
| Electricity | 1,355 (35.1%) | 1,109 (79.2%) |
| Fuel Oil or Kerosene | 0 (0.0%) | 0 (0.0%) |
| Coal or Coke | 0 (0.0%) | 0 (0.0%) |
| All other Fuels | 184 (4.8%) | 63 (4.5%) |
| No Fuel Used | 0 (0.0%) | 8 (0.6%) |
| Total | 3,860 (100.0%) | 1,400 (100.0%) |
Household Vehicle Usage in Enumclaw
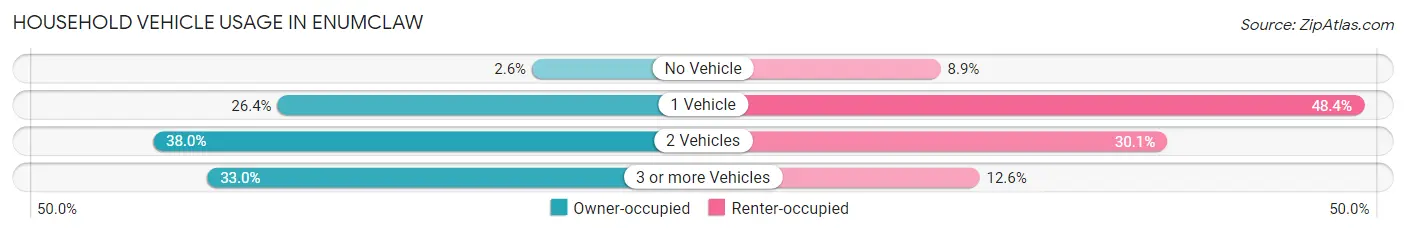
| Vehicles per Household | Owner-occupied | Renter-occupied |
| No Vehicle | 102 (2.6%) | 125 (8.9%) |
| 1 Vehicle | 1,019 (26.4%) | 678 (48.4%) |
| 2 Vehicles | 1,467 (38.0%) | 421 (30.1%) |
| 3 or more Vehicles | 1,272 (33.0%) | 176 (12.6%) |
| Total | 3,860 (100.0%) | 1,400 (100.0%) |
Real Estate & Mortgages in Enumclaw
Real Estate and Mortgage Overview in Enumclaw
| Characteristic | Without Mortgage | With Mortgage |
| Housing Units | 1,215 | 2,645 |
| Median Property Value | $265,100 | $499,100 |
| Median Household Income | $51,146 | $1,324 |
| Monthly Housing Costs | $795 | $446 |
| Real Estate Taxes | $2,553 | $107 |
Property Value by Mortgage Status in Enumclaw
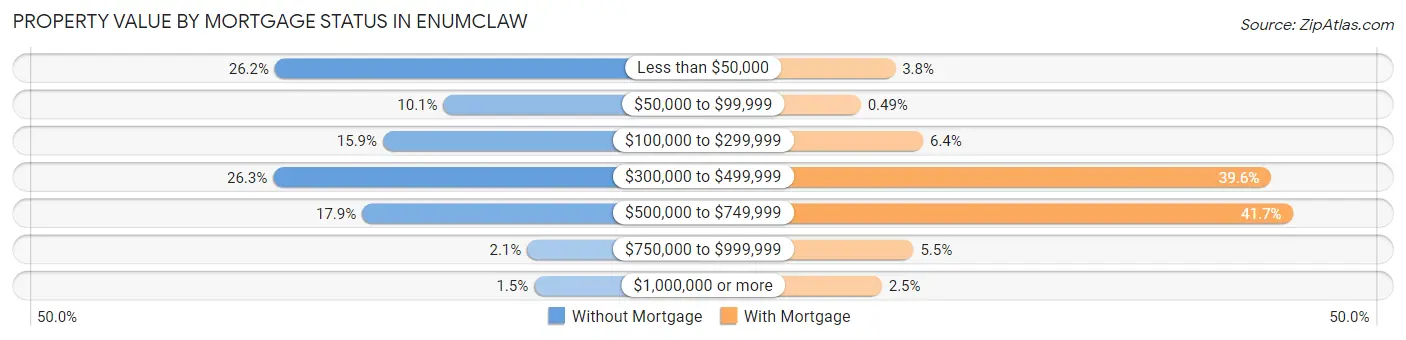
| Property Value | Without Mortgage | With Mortgage |
| Less than $50,000 | 318 (26.2%) | 100 (3.8%) |
| $50,000 to $99,999 | 123 (10.1%) | 13 (0.5%) |
| $100,000 to $299,999 | 193 (15.9%) | 170 (6.4%) |
| $300,000 to $499,999 | 320 (26.3%) | 1,047 (39.6%) |
| $500,000 to $749,999 | 217 (17.9%) | 1,103 (41.7%) |
| $750,000 to $999,999 | 26 (2.1%) | 146 (5.5%) |
| $1,000,000 or more | 18 (1.5%) | 66 (2.5%) |
| Total | 1,215 (100.0%) | 2,645 (100.0%) |
Household Income by Mortgage Status in Enumclaw
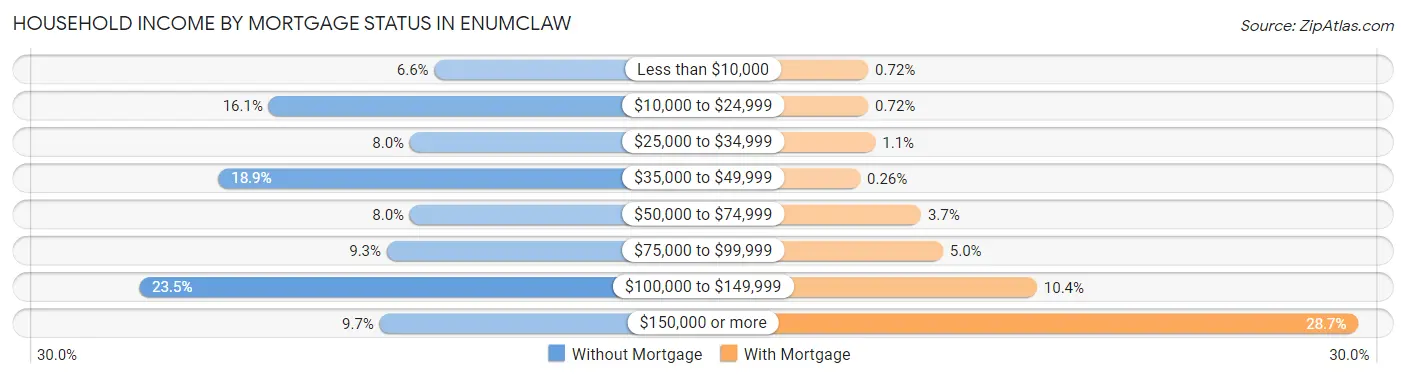
| Household Income | Without Mortgage | With Mortgage |
| Less than $10,000 | 80 (6.6%) | 19 (0.7%) |
| $10,000 to $24,999 | 195 (16.1%) | 19 (0.7%) |
| $25,000 to $34,999 | 97 (8.0%) | 30 (1.1%) |
| $35,000 to $49,999 | 230 (18.9%) | 7 (0.3%) |
| $50,000 to $74,999 | 97 (8.0%) | 99 (3.7%) |
| $75,000 to $99,999 | 113 (9.3%) | 132 (5.0%) |
| $100,000 to $149,999 | 285 (23.5%) | 274 (10.4%) |
| $150,000 or more | 118 (9.7%) | 760 (28.7%) |
| Total | 1,215 (100.0%) | 2,645 (100.0%) |
Property Value to Household Income Ratio in Enumclaw
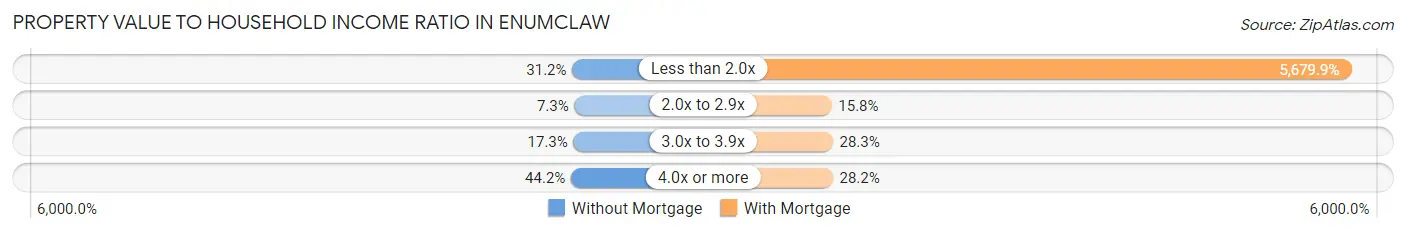
| Value-to-Income Ratio | Without Mortgage | With Mortgage |
| Less than 2.0x | 379 (31.2%) | 150,234 (5,679.9%) |
| 2.0x to 2.9x | 89 (7.3%) | 419 (15.8%) |
| 3.0x to 3.9x | 210 (17.3%) | 749 (28.3%) |
| 4.0x or more | 537 (44.2%) | 745 (28.2%) |
| Total | 1,215 (100.0%) | 2,645 (100.0%) |
Real Estate Taxes by Mortgage Status in Enumclaw
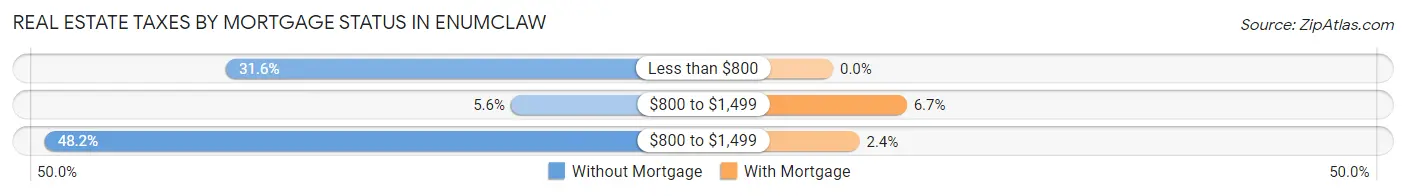
| Property Taxes | Without Mortgage | With Mortgage |
| Less than $800 | 384 (31.6%) | 0 (0.0%) |
| $800 to $1,499 | 68 (5.6%) | 178 (6.7%) |
| $800 to $1,499 | 585 (48.1%) | 64 (2.4%) |
| Total | 1,215 (100.0%) | 2,645 (100.0%) |
Health & Disability in Enumclaw
Health Insurance Coverage by Age in Enumclaw
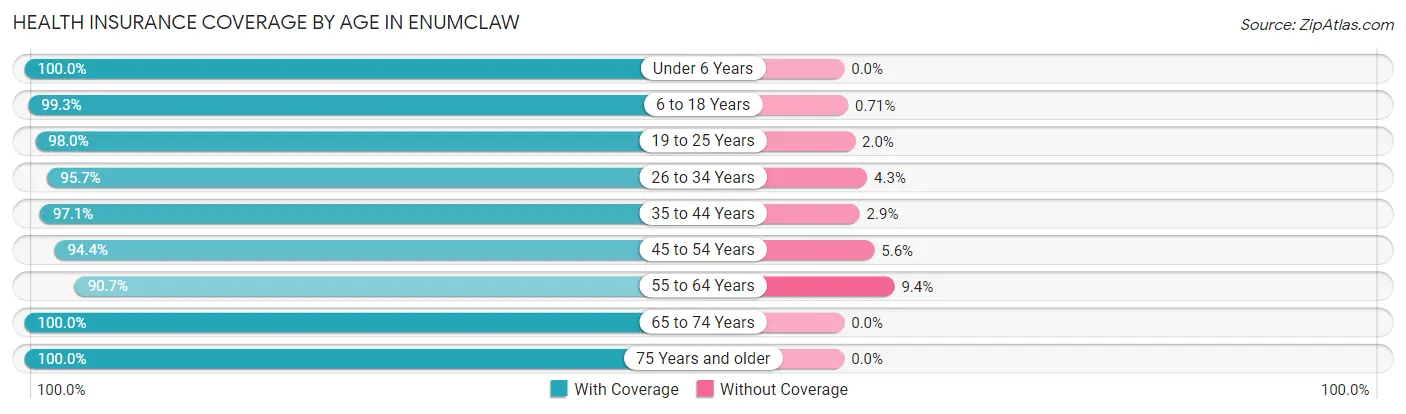
| Age Bracket | With Coverage | Without Coverage |
| Under 6 Years | 920 (100.0%) | 0 (0.0%) |
| 6 to 18 Years | 1,960 (99.3%) | 14 (0.7%) |
| 19 to 25 Years | 779 (98.0%) | 16 (2.0%) |
| 26 to 34 Years | 1,504 (95.7%) | 67 (4.3%) |
| 35 to 44 Years | 1,597 (97.1%) | 47 (2.9%) |
| 45 to 54 Years | 1,262 (94.4%) | 75 (5.6%) |
| 55 to 64 Years | 1,657 (90.6%) | 171 (9.3%) |
| 65 to 74 Years | 1,420 (100.0%) | 0 (0.0%) |
| 75 Years and older | 998 (100.0%) | 0 (0.0%) |
| Total | 12,097 (96.9%) | 390 (3.1%) |
Health Insurance Coverage by Citizenship Status in Enumclaw
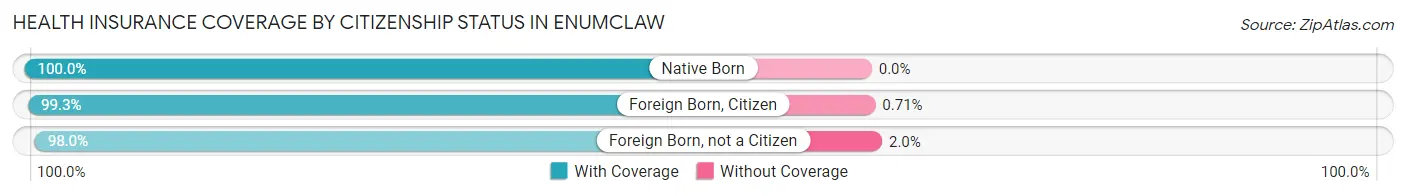
| Citizenship Status | With Coverage | Without Coverage |
| Native Born | 920 (100.0%) | 0 (0.0%) |
| Foreign Born, Citizen | 1,960 (99.3%) | 14 (0.7%) |
| Foreign Born, not a Citizen | 779 (98.0%) | 16 (2.0%) |
Health Insurance Coverage by Household Income in Enumclaw
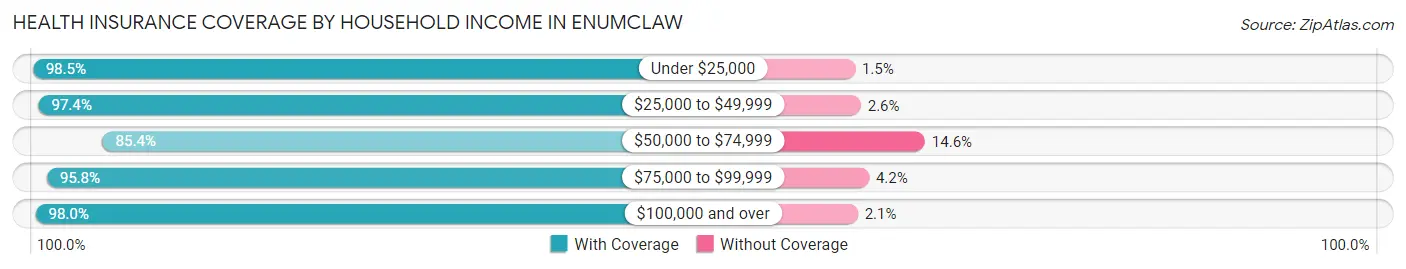
| Household Income | With Coverage | Without Coverage |
| Under $25,000 | 1,097 (98.5%) | 17 (1.5%) |
| $25,000 to $49,999 | 1,299 (97.4%) | 35 (2.6%) |
| $50,000 to $74,999 | 735 (85.4%) | 126 (14.6%) |
| $75,000 to $99,999 | 1,060 (95.8%) | 46 (4.2%) |
| $100,000 and over | 7,865 (98.0%) | 165 (2.1%) |
Public vs Private Health Insurance Coverage by Age in Enumclaw
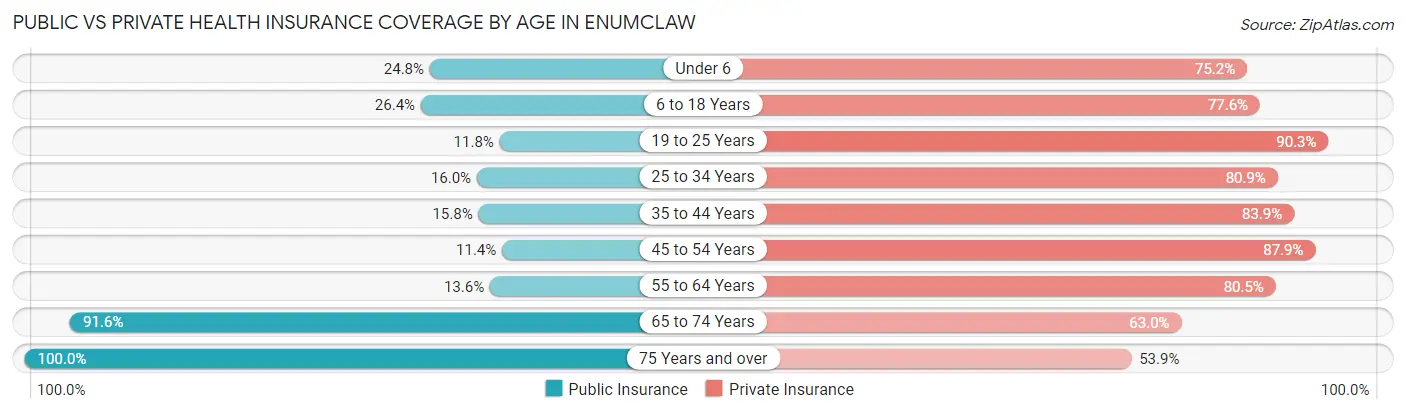
| Age Bracket | Public Insurance | Private Insurance |
| Under 6 | 228 (24.8%) | 692 (75.2%) |
| 6 to 18 Years | 522 (26.4%) | 1,532 (77.6%) |
| 19 to 25 Years | 94 (11.8%) | 718 (90.3%) |
| 25 to 34 Years | 252 (16.0%) | 1,271 (80.9%) |
| 35 to 44 Years | 259 (15.8%) | 1,380 (83.9%) |
| 45 to 54 Years | 152 (11.4%) | 1,175 (87.9%) |
| 55 to 64 Years | 249 (13.6%) | 1,472 (80.5%) |
| 65 to 74 Years | 1,300 (91.5%) | 895 (63.0%) |
| 75 Years and over | 998 (100.0%) | 538 (53.9%) |
| Total | 4,054 (32.5%) | 9,673 (77.5%) |
Disability Status by Sex by Age in Enumclaw
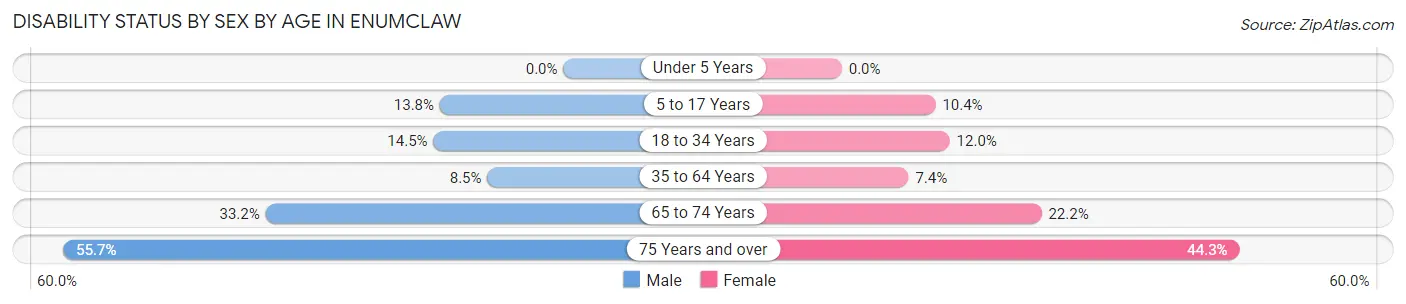
| Age Bracket | Male | Female |
| Under 5 Years | 0 (0.0%) | 0 (0.0%) |
| 5 to 17 Years | 153 (13.8%) | 73 (10.4%) |
| 18 to 34 Years | 172 (14.5%) | 176 (12.0%) |
| 35 to 64 Years | 195 (8.5%) | 186 (7.4%) |
| 65 to 74 Years | 207 (33.2%) | 177 (22.2%) |
| 75 Years and over | 215 (55.7%) | 271 (44.3%) |
Disability Class by Sex by Age in Enumclaw
Disability Class: Hearing Difficulty
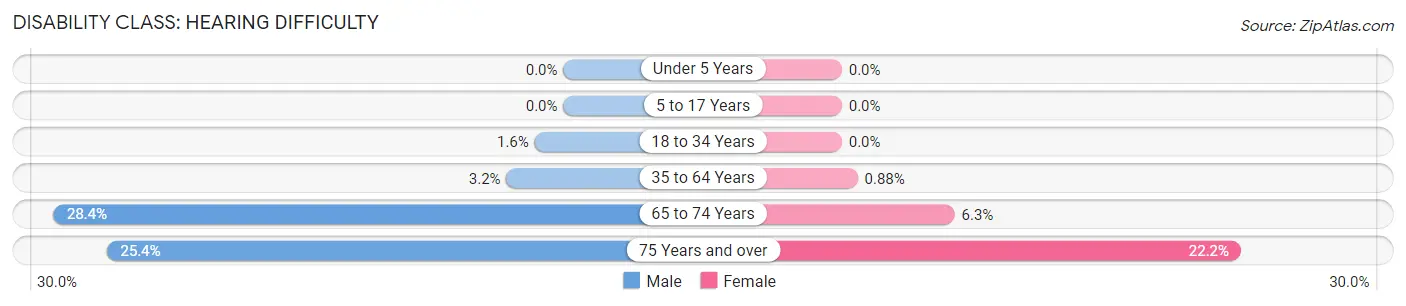
| Age Bracket | Male | Female |
| Under 5 Years | 0 (0.0%) | 0 (0.0%) |
| 5 to 17 Years | 0 (0.0%) | 0 (0.0%) |
| 18 to 34 Years | 19 (1.6%) | 0 (0.0%) |
| 35 to 64 Years | 73 (3.2%) | 22 (0.9%) |
| 65 to 74 Years | 177 (28.4%) | 50 (6.3%) |
| 75 Years and over | 98 (25.4%) | 136 (22.2%) |
Disability Class: Vision Difficulty
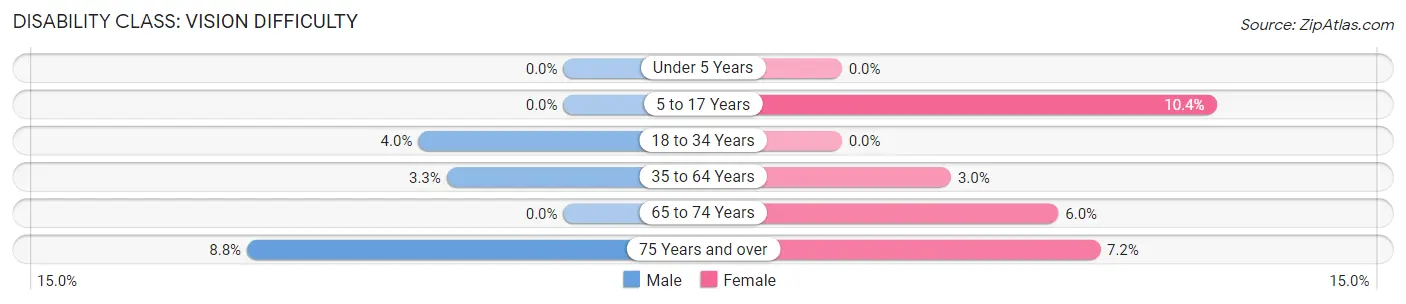
| Age Bracket | Male | Female |
| Under 5 Years | 0 (0.0%) | 0 (0.0%) |
| 5 to 17 Years | 0 (0.0%) | 73 (10.4%) |
| 18 to 34 Years | 48 (4.0%) | 0 (0.0%) |
| 35 to 64 Years | 75 (3.3%) | 76 (3.0%) |
| 65 to 74 Years | 0 (0.0%) | 48 (6.0%) |
| 75 Years and over | 34 (8.8%) | 44 (7.2%) |
Disability Class: Cognitive Difficulty
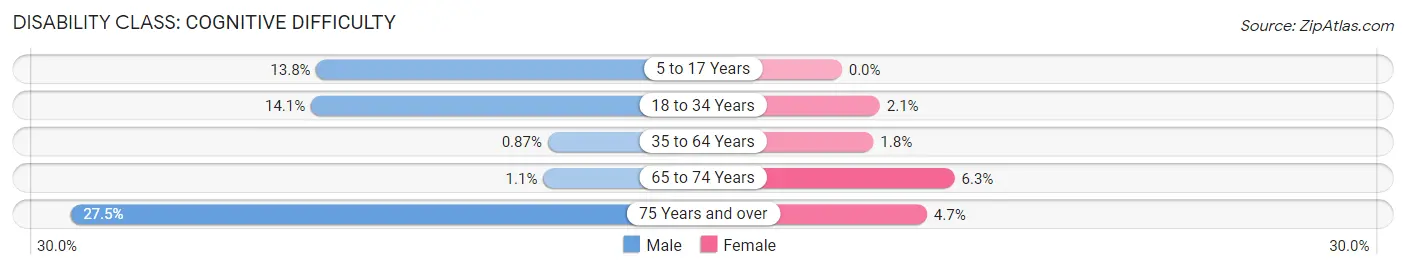
| Age Bracket | Male | Female |
| 5 to 17 Years | 153 (13.8%) | 0 (0.0%) |
| 18 to 34 Years | 167 (14.1%) | 31 (2.1%) |
| 35 to 64 Years | 20 (0.9%) | 44 (1.8%) |
| 65 to 74 Years | 7 (1.1%) | 50 (6.3%) |
| 75 Years and over | 106 (27.5%) | 29 (4.7%) |
Disability Class: Ambulatory Difficulty
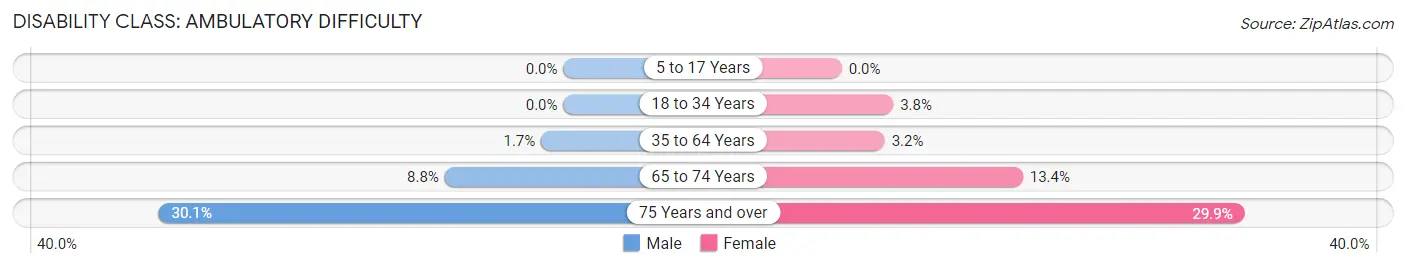
| Age Bracket | Male | Female |
| 5 to 17 Years | 0 (0.0%) | 0 (0.0%) |
| 18 to 34 Years | 0 (0.0%) | 56 (3.8%) |
| 35 to 64 Years | 38 (1.7%) | 80 (3.2%) |
| 65 to 74 Years | 55 (8.8%) | 107 (13.4%) |
| 75 Years and over | 116 (30.0%) | 183 (29.9%) |
Disability Class: Self-Care Difficulty
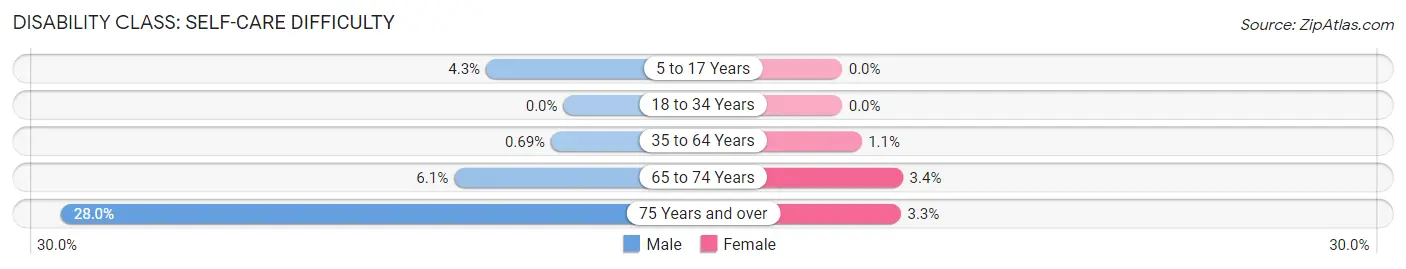
| Age Bracket | Male | Female |
| 5 to 17 Years | 48 (4.3%) | 0 (0.0%) |
| 18 to 34 Years | 0 (0.0%) | 0 (0.0%) |
| 35 to 64 Years | 16 (0.7%) | 27 (1.1%) |
| 65 to 74 Years | 38 (6.1%) | 27 (3.4%) |
| 75 Years and over | 108 (28.0%) | 20 (3.3%) |
Technology Access in Enumclaw
Computing Device Access in Enumclaw
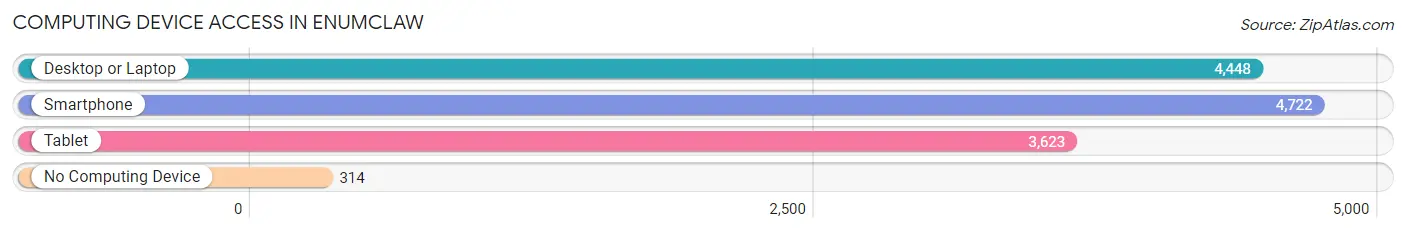
| Device Type | # Households | % Households |
| Desktop or Laptop | 4,448 | 84.6% |
| Smartphone | 4,722 | 89.8% |
| Tablet | 3,623 | 68.9% |
| No Computing Device | 314 | 6.0% |
| Total | 5,260 | 100.0% |
Internet Access in Enumclaw
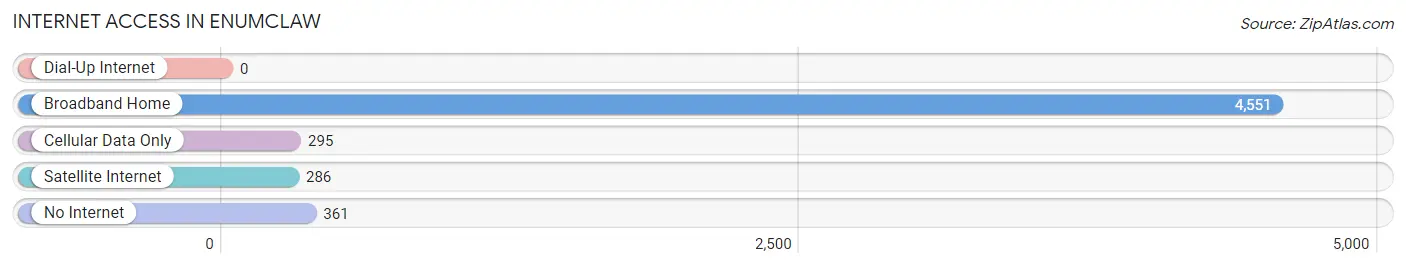
| Internet Type | # Households | % Households |
| Dial-Up Internet | 0 | 0.0% |
| Broadband Home | 4,551 | 86.5% |
| Cellular Data Only | 295 | 5.6% |
| Satellite Internet | 286 | 5.4% |
| No Internet | 361 | 6.9% |
| Total | 5,260 | 100.0% |
Enumclaw Summary
Enumclaw is a city located in King County, Washington, United States. The population was 10,669 at the 2010 census. Enumclaw is located at the base of Mount Rainier, approximately thirty miles southeast of Seattle.
History
Enumclaw was first settled in 1854 by a group of settlers from Ohio. The settlers named the area after a Native American word meaning “strong wind”. The area was originally used for logging and farming, and the first post office was established in 1883.
In the early 1900s, Enumclaw became a popular tourist destination due to its proximity to Mount Rainier. The area was also known for its mineral springs, which were believed to have healing properties.
In the 1920s, Enumclaw became a popular destination for motorcyclists, who would ride up the nearby White River Valley to the city. The city was also known for its rodeos, which were held annually from the 1920s to the 1950s.
In the 1950s, Enumclaw began to experience rapid growth due to the construction of the nearby Boeing plant. The city’s population grew from 1,500 in 1950 to over 10,000 by the year 2000.
Geography
Enumclaw is located at the base of Mount Rainier, approximately thirty miles southeast of Seattle. The city is situated in the White River Valley, which is surrounded by the Cascade Mountains. The city is located at an elevation of 1,000 feet above sea level.
The city has a total area of 5.7 square miles, of which 5.6 square miles is land and 0.1 square miles is water. The White River runs through the city, and there are several small lakes in the area.
Economy
Enumclaw’s economy is largely based on agriculture and tourism. The city is home to several farms, which produce a variety of crops, including apples, cherries, and hops. The city is also home to several wineries and breweries, which produce a variety of wines and beers.
The city is also home to several manufacturing companies, including Boeing, which has a large plant in the city. The city is also home to several retail stores, restaurants, and other businesses.
Demographics
As of the 2010 census, there were 10,669 people, 4,072 households, and 2,717 families residing in the city. The population density was 1,890.3 people per square mile. The racial makeup of the city was 87.2% White, 1.2% African American, 0.7% Native American, 1.7% Asian, 0.2% Pacific Islander, 5.3% from other races, and 3.7% from two or more races. Hispanic or Latino of any race were 11.2% of the population.
The median income for a household in the city was $50,945, and the median income for a family was $60,945. The per capita income for the city was $24,945. About 8.2% of families and 11.2% of the population were below the poverty line, including 16.2% of those under age 18 and 8.2% of those age 65 or over.
Common Questions
What is Per Capita Income in Enumclaw?
Per Capita income in Enumclaw is $54,692.
What is the Median Family Income in Enumclaw?
Median Family Income in Enumclaw is $135,588.
What is the Median Household income in Enumclaw?
Median Household Income in Enumclaw is $110,789.
What is Income or Wage Gap in Enumclaw?
Income or Wage Gap in Enumclaw is 36.7%.
Women in Enumclaw earn 63.3 cents for every dollar earned by a man.
What is Inequality or Gini Index in Enumclaw?
Inequality or Gini Index in Enumclaw is 0.43.
What is the Total Population of Enumclaw?
Total Population of Enumclaw is 12,630.
What is the Total Male Population of Enumclaw?
Total Male Population of Enumclaw is 6,243.
What is the Total Female Population of Enumclaw?
Total Female Population of Enumclaw is 6,387.
What is the Ratio of Males per 100 Females in Enumclaw?
There are 97.75 Males per 100 Females in Enumclaw.
What is the Ratio of Females per 100 Males in Enumclaw?
There are 102.31 Females per 100 Males in Enumclaw.
What is the Median Population Age in Enumclaw?
Median Population Age in Enumclaw is 40.7 Years.
What is the Average Family Size in Enumclaw
Average Family Size in Enumclaw is 3.1 People.
What is the Average Household Size in Enumclaw
Average Household Size in Enumclaw is 2.4 People.
How Large is the Labor Force in Enumclaw?
There are 6,971 People in the Labor Forcein in Enumclaw.
What is the Percentage of People in the Labor Force in Enumclaw?
67.7% of People are in the Labor Force in Enumclaw.
What is the Unemployment Rate in Enumclaw?
Unemployment Rate in Enumclaw is 4.2%.