Trout Lake, WA Map & Demographics
Trout Lake Map
Trout Lake Overview
$34,100
PER CAPITA INCOME
$79,643
AVG FAMILY INCOME
$76,875
AVG HOUSEHOLD INCOME
45.8%
WAGE / INCOME GAP [ % ]
54.2¢/ $1
WAGE / INCOME GAP [ $ ]
0.41
INEQUALITY / GINI INDEX
822
TOTAL POPULATION
487
MALE POPULATION
335
FEMALE POPULATION
145.37
MALES / 100 FEMALES
68.79
FEMALES / 100 MALES
43.4
MEDIAN AGE
3.4
AVG FAMILY SIZE
3.0
AVG HOUSEHOLD SIZE
516
LABOR FORCE [ PEOPLE ]
74.0%
PERCENT IN LABOR FORCE
0.8%
UNEMPLOYMENT RATE
Trout Lake Zip Codes
Trout Lake Area Codes
Income in Trout Lake
Income Overview in Trout Lake
Per Capita Income in Trout Lake is $34,100, while median incomes of families and households are $79,643 and $76,875 respectively.
| Characteristic | Number | Measure |
| Per Capita Income | 822 | $34,100 |
| Median Family Income | 212 | $79,643 |
| Mean Family Income | 212 | $109,722 |
| Median Household Income | 274 | $76,875 |
| Mean Household Income | 274 | $99,446 |
| Income Deficit | 212 | $0 |
| Wage / Income Gap (%) | 822 | 45.80% |
| Wage / Income Gap ($) | 822 | 54.20¢ per $1 |
| Gini / Inequality Index | 822 | 0.41 |
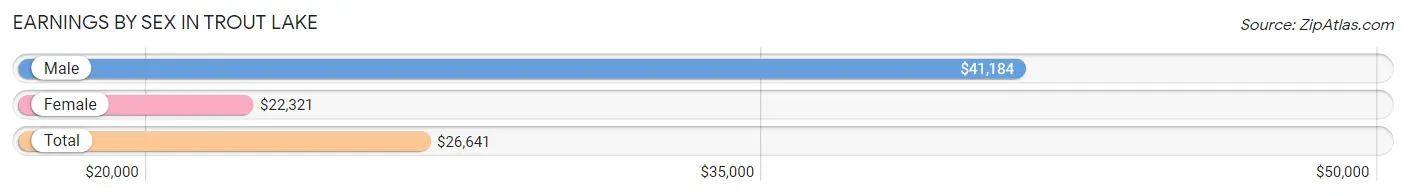
Earnings by Sex in Trout Lake
Average Earnings in Trout Lake are $26,641, $41,184 for men and $22,321 for women, a difference of 45.8%.
| Sex | Number | Average Earnings |
| Male | 350 (64.3%) | $41,184 |
| Female | 194 (35.7%) | $22,321 |
| Total | 544 (100.0%) | $26,641 |
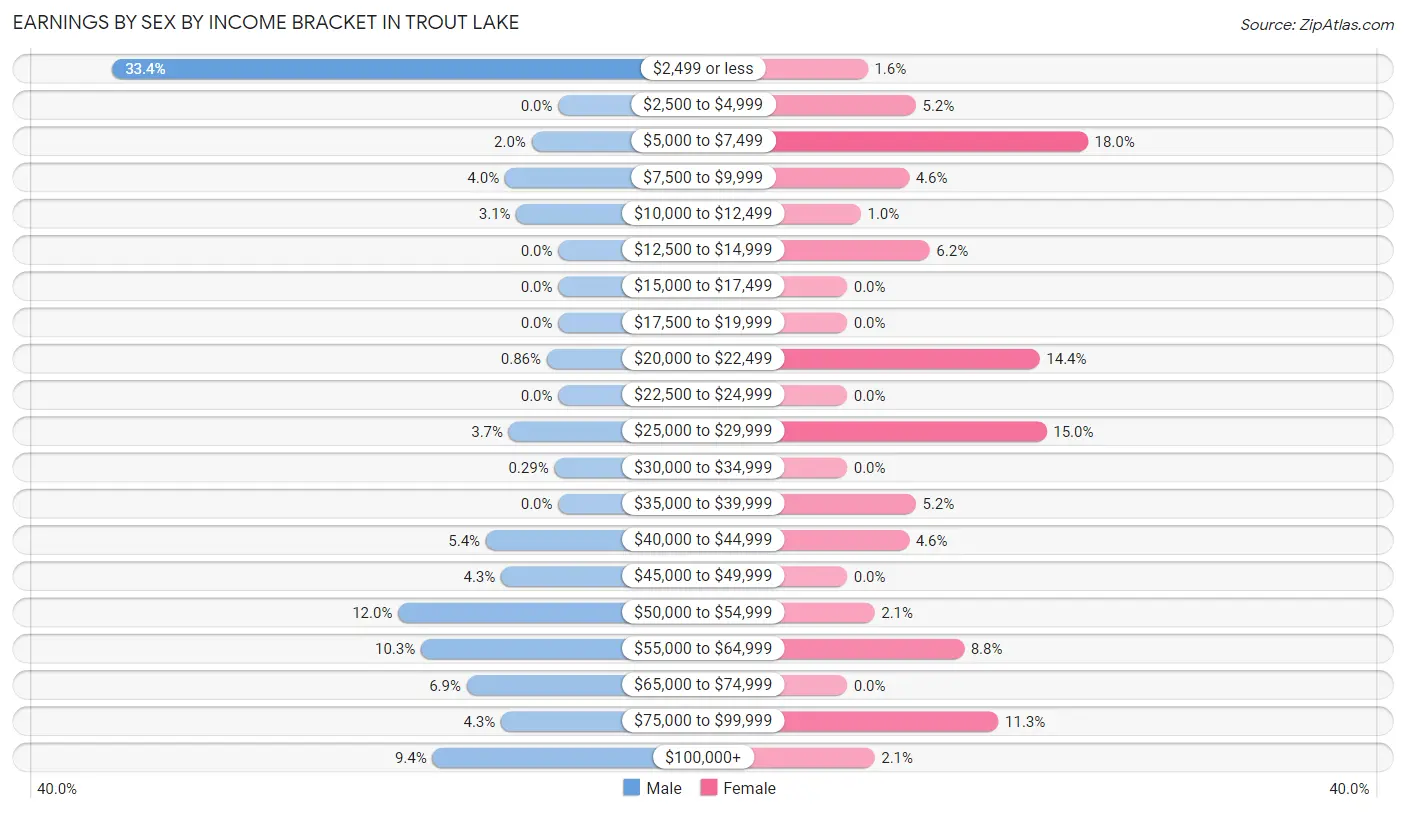
Earnings by Sex by Income Bracket in Trout Lake
The most common earnings brackets in Trout Lake are $2,499 or less for men (117 | 33.4%) and $5,000 to $7,499 for women (35 | 18.0%).
| Income | Male | Female |
| $2,499 or less | 117 (33.4%) | 3 (1.5%) |
| $2,500 to $4,999 | 0 (0.0%) | 10 (5.1%) |
| $5,000 to $7,499 | 7 (2.0%) | 35 (18.0%) |
| $7,500 to $9,999 | 14 (4.0%) | 9 (4.6%) |
| $10,000 to $12,499 | 11 (3.1%) | 2 (1.0%) |
| $12,500 to $14,999 | 0 (0.0%) | 12 (6.2%) |
| $15,000 to $17,499 | 0 (0.0%) | 0 (0.0%) |
| $17,500 to $19,999 | 0 (0.0%) | 0 (0.0%) |
| $20,000 to $22,499 | 3 (0.9%) | 28 (14.4%) |
| $22,500 to $24,999 | 0 (0.0%) | 0 (0.0%) |
| $25,000 to $29,999 | 13 (3.7%) | 29 (14.9%) |
| $30,000 to $34,999 | 1 (0.3%) | 0 (0.0%) |
| $35,000 to $39,999 | 0 (0.0%) | 10 (5.1%) |
| $40,000 to $44,999 | 19 (5.4%) | 9 (4.6%) |
| $45,000 to $49,999 | 15 (4.3%) | 0 (0.0%) |
| $50,000 to $54,999 | 42 (12.0%) | 4 (2.1%) |
| $55,000 to $64,999 | 36 (10.3%) | 17 (8.8%) |
| $65,000 to $74,999 | 24 (6.9%) | 0 (0.0%) |
| $75,000 to $99,999 | 15 (4.3%) | 22 (11.3%) |
| $100,000+ | 33 (9.4%) | 4 (2.1%) |
| Total | 350 (100.0%) | 194 (100.0%) |
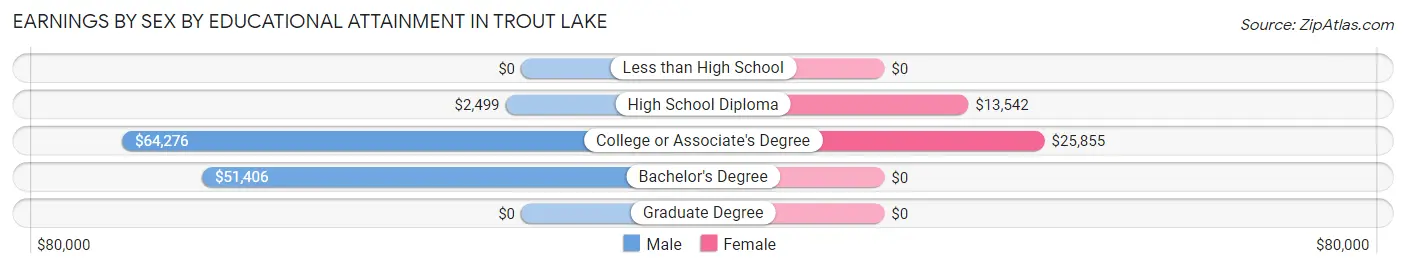
Earnings by Sex by Educational Attainment in Trout Lake
Average earnings in Trout Lake are $51,161 for men and $26,842 for women, a difference of 47.5%. Men with an educational attainment of college or associate's degree enjoy the highest average annual earnings of $64,276, while those with high school diploma education earn the least with $2,499. Women with an educational attainment of college or associate's degree earn the most with the average annual earnings of $25,855, while those with high school diploma education have the smallest earnings of $13,542.
| Educational Attainment | Male Income | Female Income |
| Less than High School | - | - |
| High School Diploma | $2,499 | $13,542 |
| College or Associate's Degree | $64,276 | $25,855 |
| Bachelor's Degree | $51,406 | $0 |
| Graduate Degree | - | - |
| Total | $51,161 | $26,842 |
Family Income in Trout Lake
Family Income Brackets in Trout Lake
According to the Trout Lake family income data, there are 36 families falling into the $25,000 to $34,999 income range, which is the most common income bracket and makes up 17.0% of all families.
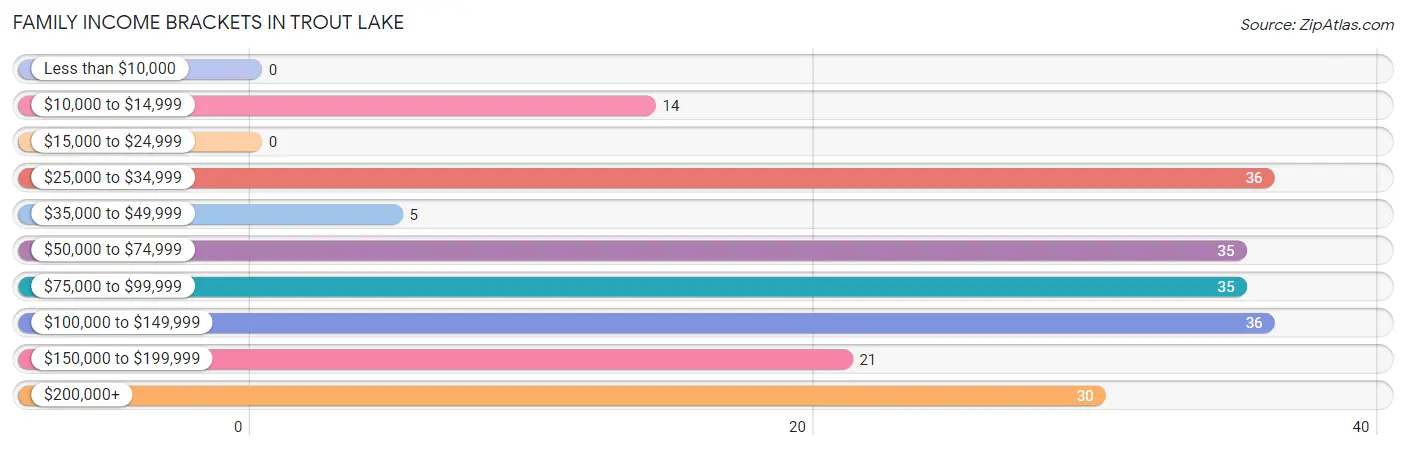
| Income Bracket | # Families | % Families |
| Less than $10,000 | 0 | 0.0% |
| $10,000 to $14,999 | 14 | 6.6% |
| $15,000 to $24,999 | 0 | 0.0% |
| $25,000 to $34,999 | 36 | 17.0% |
| $35,000 to $49,999 | 5 | 2.4% |
| $50,000 to $74,999 | 35 | 16.5% |
| $75,000 to $99,999 | 35 | 16.5% |
| $100,000 to $149,999 | 36 | 17.0% |
| $150,000 to $199,999 | 21 | 9.9% |
| $200,000+ | 30 | 14.2% |
Family Income by Famaliy Size in Trout Lake
4-person families (11 | 5.2%) account for the highest median family income in Trout Lake with $150,536 per family, while 2-person families (103 | 48.6%) have the highest median income of $38,884 per family member.
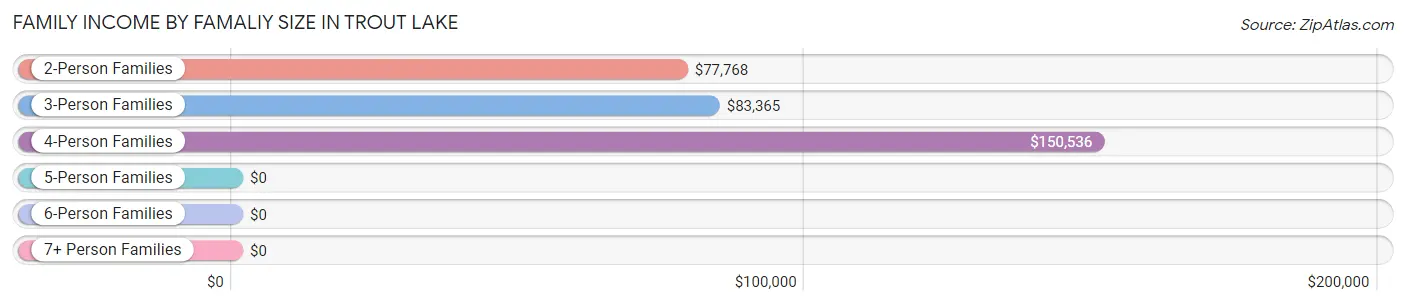
| Income Bracket | # Families | Median Income |
| 2-Person Families | 103 (48.6%) | $77,768 |
| 3-Person Families | 79 (37.3%) | $83,365 |
| 4-Person Families | 11 (5.2%) | $150,536 |
| 5-Person Families | 15 (7.1%) | $0 |
| 6-Person Families | 1 (0.5%) | $0 |
| 7+ Person Families | 3 (1.4%) | $0 |
| Total | 212 (100.0%) | $79,643 |
Family Income by Number of Earners in Trout Lake
The median family income in Trout Lake is $79,643, with families comprising 3+ earners (35) having the highest median family income of $250,001, while families with no earners (35) have the lowest median family income of $30,625, accounting for 16.5% and 16.5% of families, respectively.
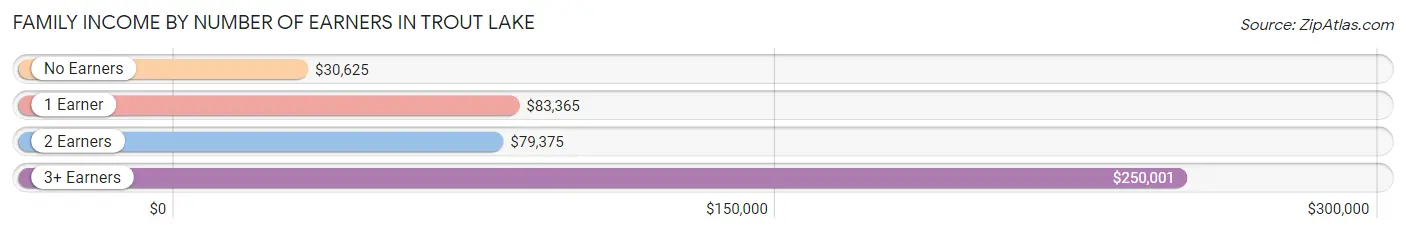
| Number of Earners | # Families | Median Income |
| No Earners | 35 (16.5%) | $30,625 |
| 1 Earner | 39 (18.4%) | $83,365 |
| 2 Earners | 103 (48.6%) | $79,375 |
| 3+ Earners | 35 (16.5%) | $250,001 |
| Total | 212 (100.0%) | $79,643 |
Household Income in Trout Lake
Household Income Brackets in Trout Lake
With 67 households falling in the category, the $50,000 to $74,999 income range is the most frequent in Trout Lake, accounting for 24.4% of all households.
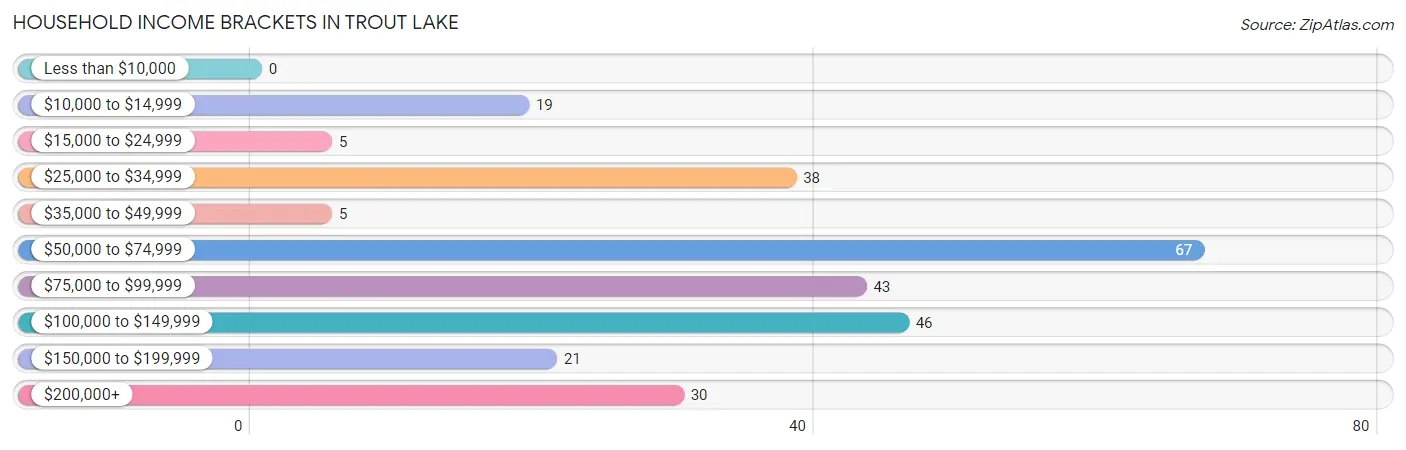
| Income Bracket | # Households | % Households |
| Less than $10,000 | 0 | 0.0% |
| $10,000 to $14,999 | 19 | 6.9% |
| $15,000 to $24,999 | 5 | 1.8% |
| $25,000 to $34,999 | 38 | 13.9% |
| $35,000 to $49,999 | 5 | 1.8% |
| $50,000 to $74,999 | 67 | 24.5% |
| $75,000 to $99,999 | 43 | 15.7% |
| $100,000 to $149,999 | 46 | 16.8% |
| $150,000 to $199,999 | 21 | 7.7% |
| $200,000+ | 30 | 10.9% |
Household Income by Householder Age in Trout Lake
The median household income in Trout Lake is $76,875, with the highest median household income of $124,125 found in the 45 to 64 years age bracket for the primary householder. A total of 115 households (42.0%) fall into this category.
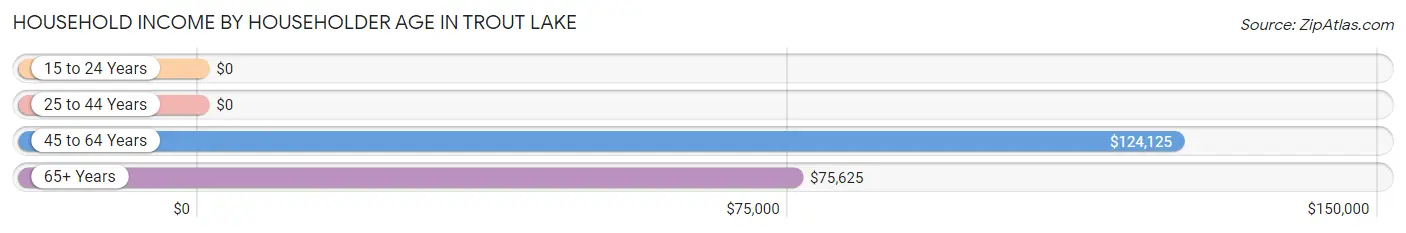
| Income Bracket | # Households | Median Income |
| 15 to 24 Years | 0 (0.0%) | $0 |
| 25 to 44 Years | 83 (30.3%) | $0 |
| 45 to 64 Years | 115 (42.0%) | $124,125 |
| 65+ Years | 76 (27.7%) | $75,625 |
| Total | 274 (100.0%) | $76,875 |
Poverty in Trout Lake
Income Below Poverty by Sex and Age in Trout Lake
With 15.6% poverty level for males and 17.3% for females among the residents of Trout Lake, 5 year old males and 16 and 17 year old females are the most vulnerable to poverty, with 4 males (100.0%) and 9 females (100.0%) in their respective age groups living below the poverty level.
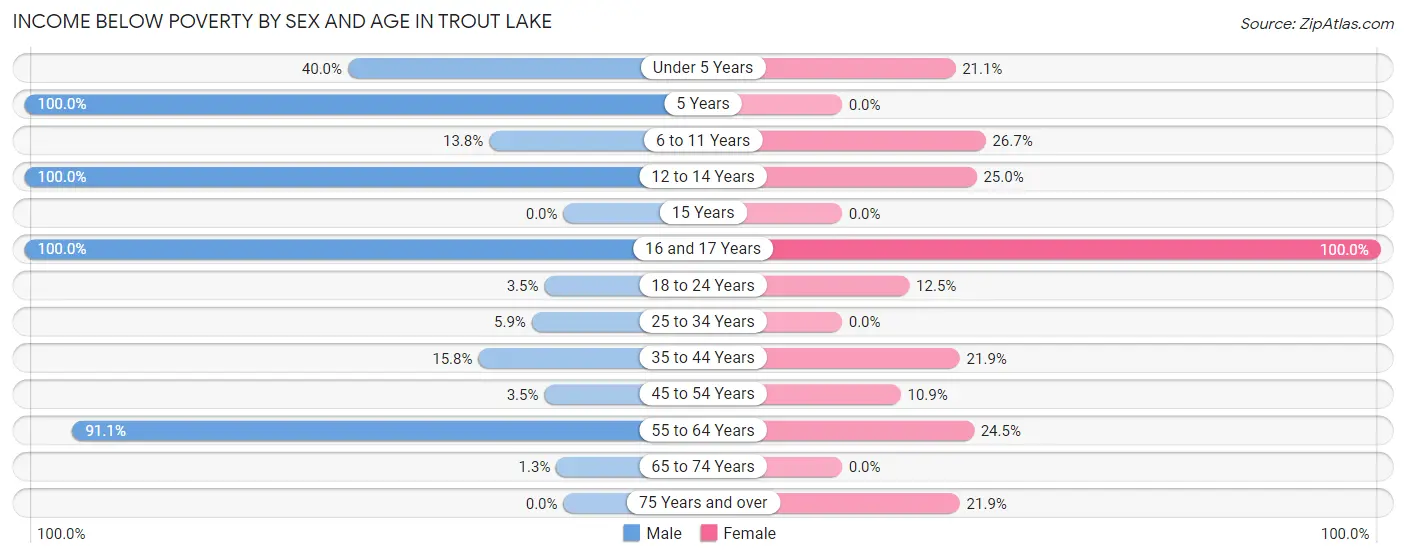
| Age Bracket | Male | Female |
| Under 5 Years | 4 (40.0%) | 4 (21.0%) |
| 5 Years | 4 (100.0%) | 0 (0.0%) |
| 6 to 11 Years | 4 (13.8%) | 8 (26.7%) |
| 12 to 14 Years | 2 (100.0%) | 1 (25.0%) |
| 15 Years | 0 (0.0%) | 0 (0.0%) |
| 16 and 17 Years | 4 (100.0%) | 9 (100.0%) |
| 18 to 24 Years | 3 (3.5%) | 4 (12.5%) |
| 25 to 34 Years | 4 (5.9%) | 0 (0.0%) |
| 35 to 44 Years | 6 (15.8%) | 7 (21.9%) |
| 45 to 54 Years | 3 (3.5%) | 6 (10.9%) |
| 55 to 64 Years | 41 (91.1%) | 12 (24.5%) |
| 65 to 74 Years | 1 (1.3%) | 0 (0.0%) |
| 75 Years and over | 0 (0.0%) | 7 (21.9%) |
| Total | 76 (15.6%) | 58 (17.3%) |
Income Above Poverty by Sex and Age in Trout Lake
According to the poverty statistics in Trout Lake, males aged 15 years and females aged 25 to 34 years are the age groups that are most secure financially, with 100.0% of males and 100.0% of females in these age groups living above the poverty line.
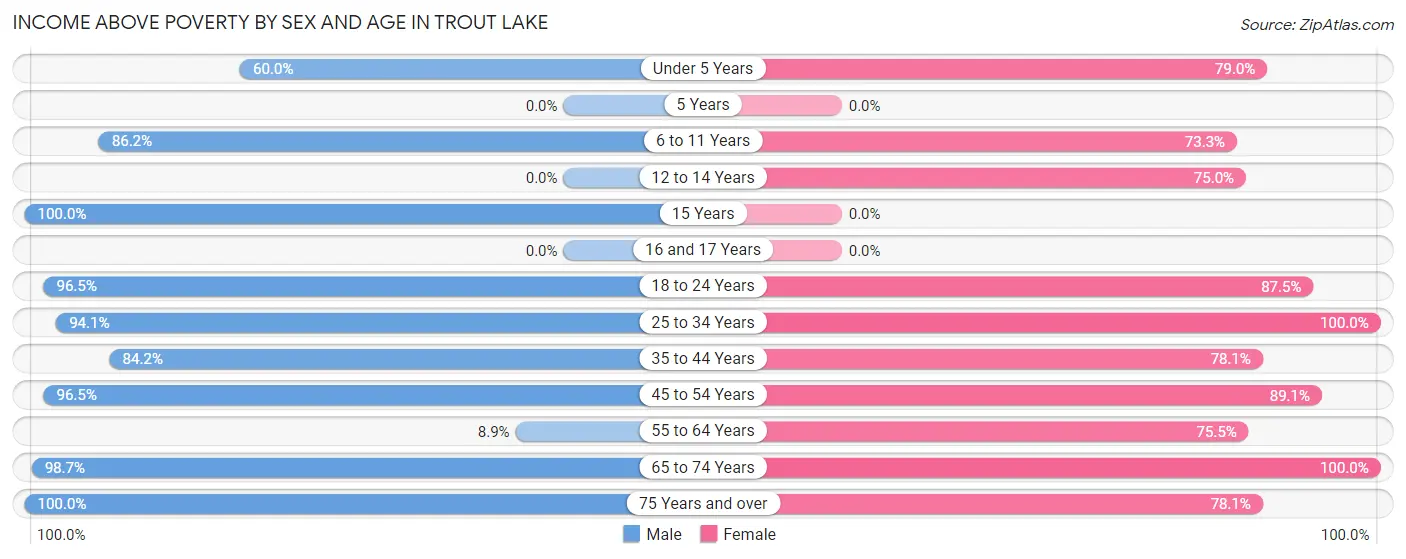
| Age Bracket | Male | Female |
| Under 5 Years | 6 (60.0%) | 15 (78.9%) |
| 5 Years | 0 (0.0%) | 0 (0.0%) |
| 6 to 11 Years | 25 (86.2%) | 22 (73.3%) |
| 12 to 14 Years | 0 (0.0%) | 3 (75.0%) |
| 15 Years | 27 (100.0%) | 0 (0.0%) |
| 16 and 17 Years | 0 (0.0%) | 0 (0.0%) |
| 18 to 24 Years | 82 (96.5%) | 28 (87.5%) |
| 25 to 34 Years | 64 (94.1%) | 38 (100.0%) |
| 35 to 44 Years | 32 (84.2%) | 25 (78.1%) |
| 45 to 54 Years | 82 (96.5%) | 49 (89.1%) |
| 55 to 64 Years | 4 (8.9%) | 37 (75.5%) |
| 65 to 74 Years | 75 (98.7%) | 35 (100.0%) |
| 75 Years and over | 14 (100.0%) | 25 (78.1%) |
| Total | 411 (84.4%) | 277 (82.7%) |
Income Below Poverty Among Married-Couple Families in Trout Lake
The poverty statistics for married-couple families in Trout Lake show that 8.7% or 18 of the total 207 families live below the poverty line. Families with 3 or 4 children have the highest poverty rate of 100.0%, comprising of 1 families. On the other hand, families with 1 or 2 children have the lowest poverty rate of 3.1%, which includes 2 families.
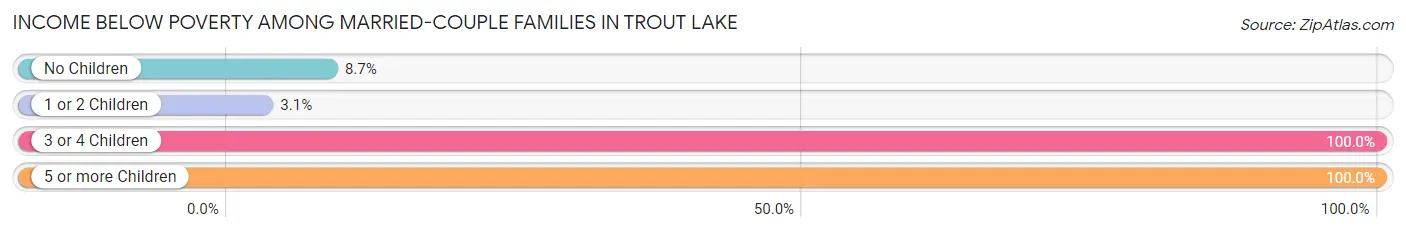
| Children | Above Poverty | Below Poverty |
| No Children | 126 (91.3%) | 12 (8.7%) |
| 1 or 2 Children | 63 (96.9%) | 2 (3.1%) |
| 3 or 4 Children | 0 (0.0%) | 1 (100.0%) |
| 5 or more Children | 0 (0.0%) | 3 (100.0%) |
| Total | 189 (91.3%) | 18 (8.7%) |
Income Below Poverty Among Single-Parent Households in Trout Lake
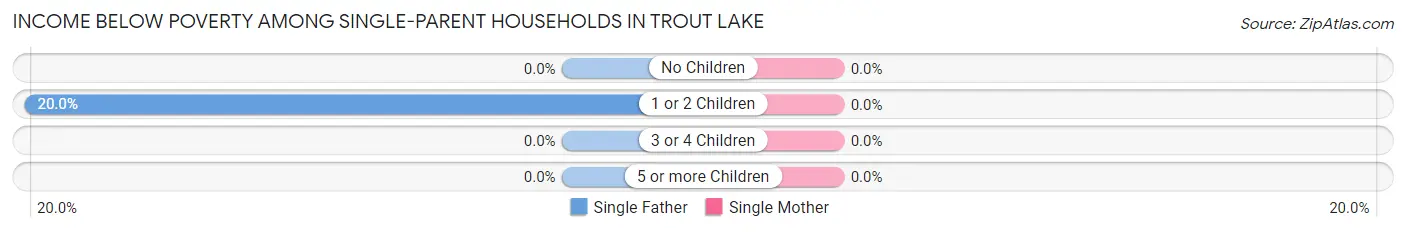
| Children | Single Father | Single Mother |
| No Children | 0 (0.0%) | 0 (0.0%) |
| 1 or 2 Children | 1 (20.0%) | 0 (0.0%) |
| 3 or 4 Children | 0 (0.0%) | 0 (0.0%) |
| 5 or more Children | 0 (0.0%) | 0 (0.0%) |
| Total | 1 (20.0%) | 0 (0.0%) |
Income Below Poverty Among Married-Couple vs Single-Parent Households in Trout Lake
The poverty data for Trout Lake shows that 18 of the married-couple family households (8.7%) and 1 of the single-parent households (20.0%) are living below the poverty level. Within the married-couple family households, those with 3 or 4 children have the highest poverty rate, with 1 households (100.0%) falling below the poverty line. Among the single-parent households, those with 1 or 2 children have the highest poverty rate, with 1 household (20.0%) living below poverty.
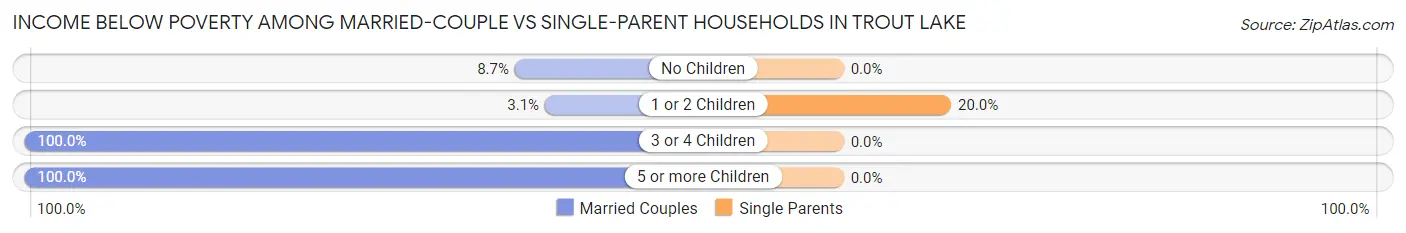
| Children | Married-Couple Families | Single-Parent Households |
| No Children | 12 (8.7%) | 0 (0.0%) |
| 1 or 2 Children | 2 (3.1%) | 1 (20.0%) |
| 3 or 4 Children | 1 (100.0%) | 0 (0.0%) |
| 5 or more Children | 3 (100.0%) | 0 (0.0%) |
| Total | 18 (8.7%) | 1 (20.0%) |
Race in Trout Lake
The most populous races in Trout Lake are White / Caucasian (739 | 89.9%), Two or more Races (83 | 10.1%), and Hispanic or Latino (33 | 4.0%).
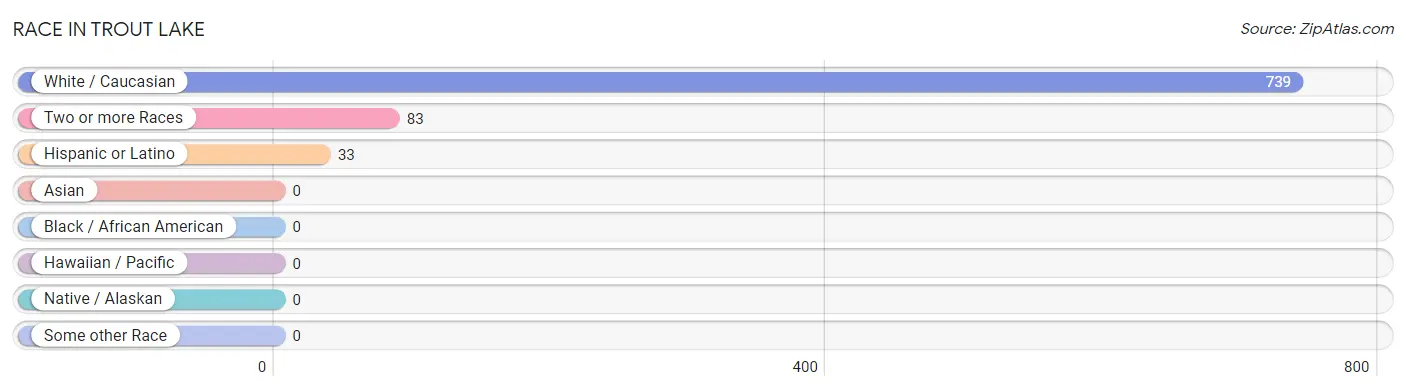
| Race | # Population | % Population |
| Asian | 0 | 0.0% |
| Black / African American | 0 | 0.0% |
| Hawaiian / Pacific | 0 | 0.0% |
| Hispanic or Latino | 33 | 4.0% |
| Native / Alaskan | 0 | 0.0% |
| White / Caucasian | 739 | 89.9% |
| Two or more Races | 83 | 10.1% |
| Some other Race | 0 | 0.0% |
| Total | 822 | 100.0% |
Ancestry in Trout Lake
The most populous ancestries reported in Trout Lake are German (184 | 22.4%), English (84 | 10.2%), Swedish (71 | 8.6%), Irish (63 | 7.7%), and American (59 | 7.2%), together accounting for 56.1% of all Trout Lake residents.
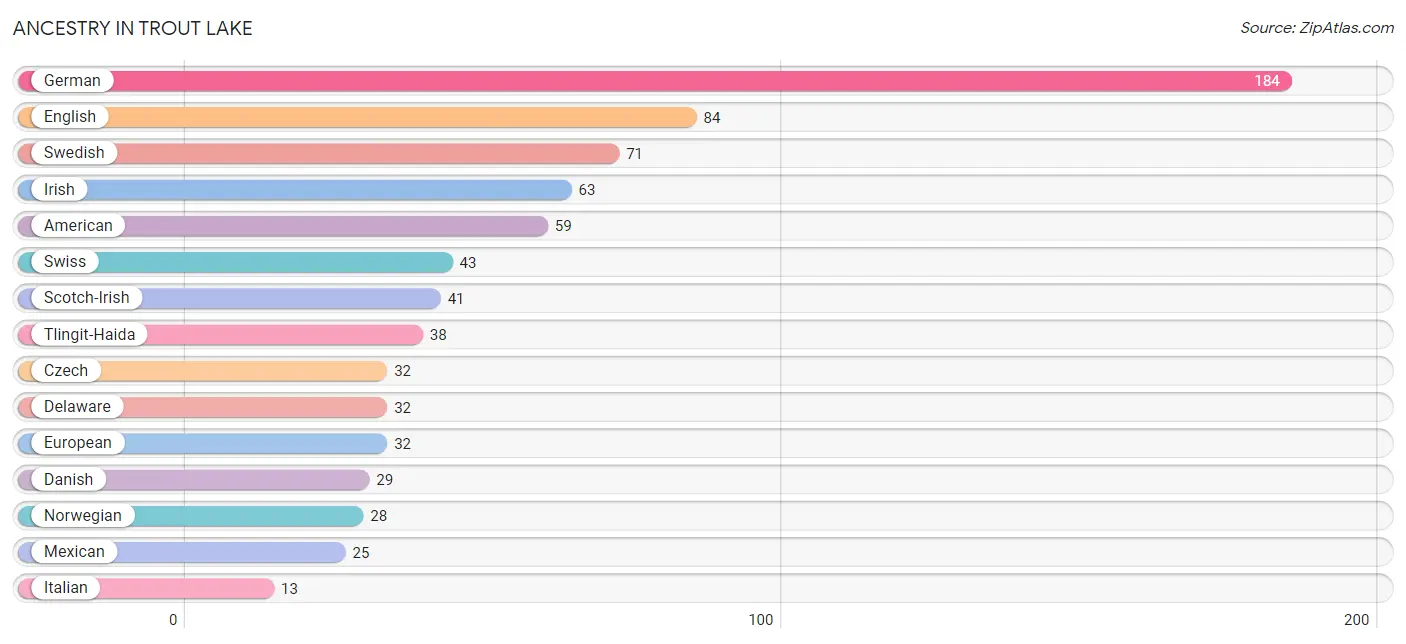
| Ancestry | # Population | % Population |
| American | 59 | 7.2% |
| Argentinean | 8 | 1.0% |
| Bulgarian | 4 | 0.5% |
| Burmese | 11 | 1.3% |
| Czech | 32 | 3.9% |
| Danish | 29 | 3.5% |
| Delaware | 32 | 3.9% |
| Dutch | 4 | 0.5% |
| English | 84 | 10.2% |
| European | 32 | 3.9% |
| French | 4 | 0.5% |
| French Canadian | 9 | 1.1% |
| German | 184 | 22.4% |
| Hungarian | 8 | 1.0% |
| Irish | 63 | 7.7% |
| Italian | 13 | 1.6% |
| Latvian | 2 | 0.2% |
| Mexican | 25 | 3.0% |
| Norwegian | 28 | 3.4% |
| Polish | 7 | 0.9% |
| Scandinavian | 6 | 0.7% |
| Scotch-Irish | 41 | 5.0% |
| Scottish | 13 | 1.6% |
| South American | 8 | 1.0% |
| Swedish | 71 | 8.6% |
| Swiss | 43 | 5.2% |
| Tlingit-Haida | 38 | 4.6% |
| Ukrainian | 10 | 1.2% | View All 28 Rows |
Immigrants in Trout Lake
The most numerous immigrant groups reported in Trout Lake came from Europe (15 | 1.8%), Denmark (11 | 1.3%), Northern Europe (11 | 1.3%), Bulgaria (4 | 0.5%), and Eastern Europe (4 | 0.5%), together accounting for 5.5% of all Trout Lake residents.
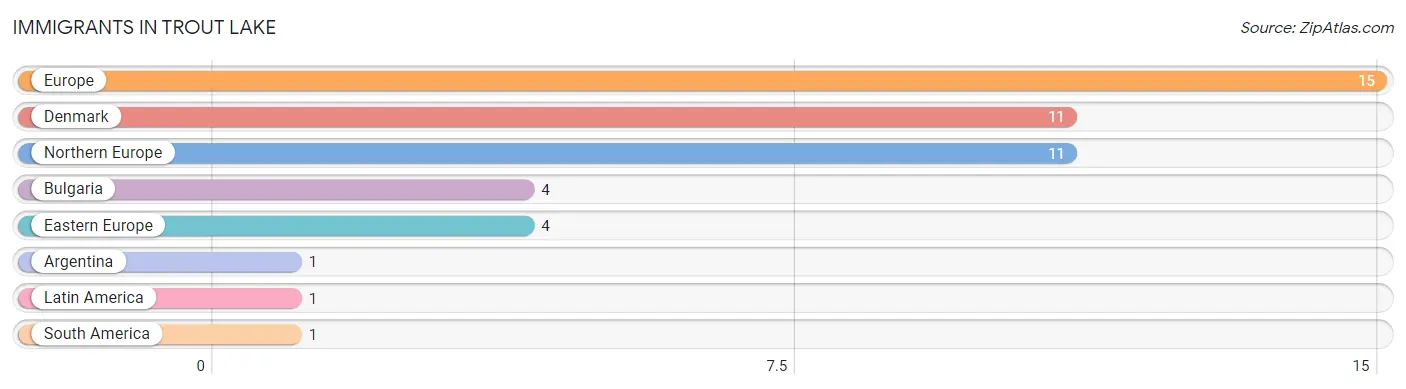
| Immigration Origin | # Population | % Population |
| Argentina | 1 | 0.1% |
| Bulgaria | 4 | 0.5% |
| Denmark | 11 | 1.3% |
| Eastern Europe | 4 | 0.5% |
| Europe | 15 | 1.8% |
| Latin America | 1 | 0.1% |
| Northern Europe | 11 | 1.3% |
| South America | 1 | 0.1% | View All 8 Rows |
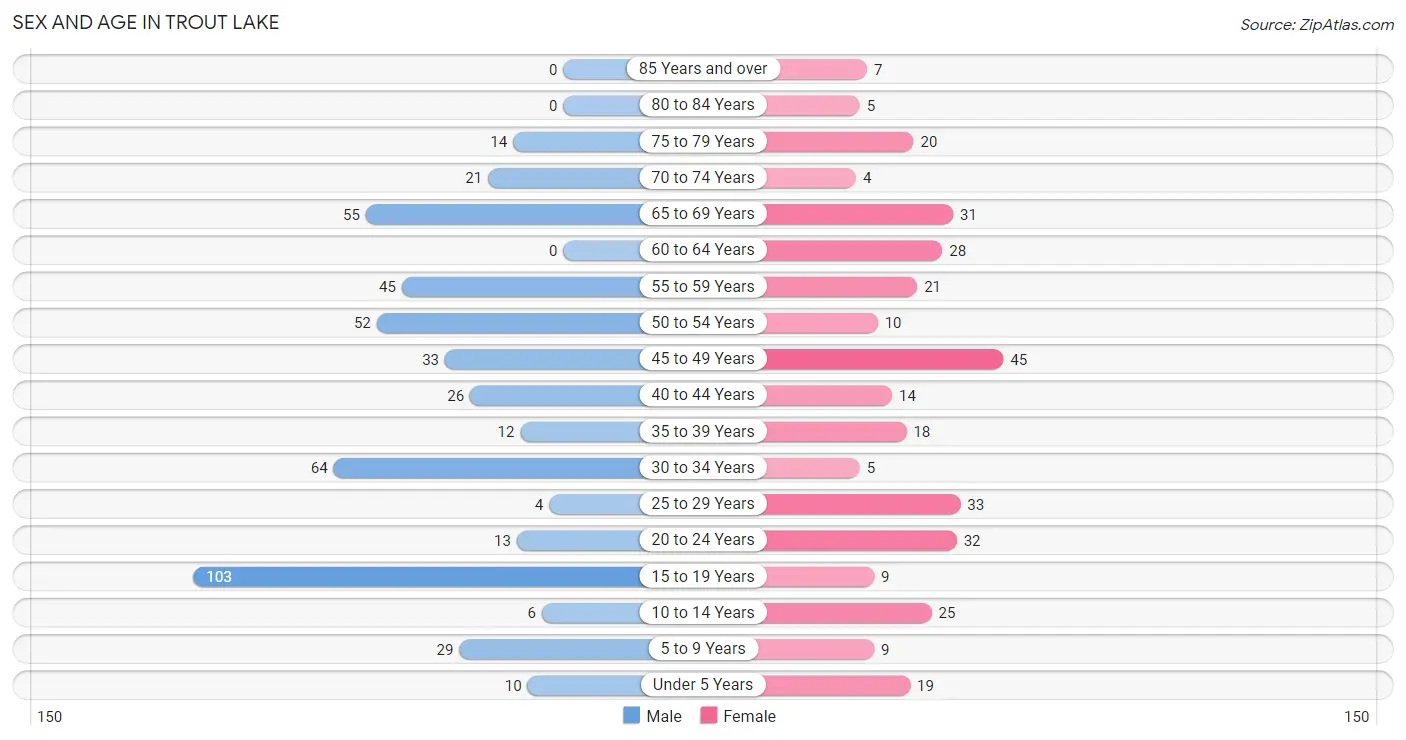
Sex and Age in Trout Lake
Sex and Age in Trout Lake
The most populous age groups in Trout Lake are 15 to 19 Years (103 | 21.1%) for men and 45 to 49 Years (45 | 13.4%) for women.
| Age Bracket | Male | Female |
| Under 5 Years | 10 (2.1%) | 19 (5.7%) |
| 5 to 9 Years | 29 (5.9%) | 9 (2.7%) |
| 10 to 14 Years | 6 (1.2%) | 25 (7.5%) |
| 15 to 19 Years | 103 (21.1%) | 9 (2.7%) |
| 20 to 24 Years | 13 (2.7%) | 32 (9.6%) |
| 25 to 29 Years | 4 (0.8%) | 33 (9.9%) |
| 30 to 34 Years | 64 (13.1%) | 5 (1.5%) |
| 35 to 39 Years | 12 (2.5%) | 18 (5.4%) |
| 40 to 44 Years | 26 (5.3%) | 14 (4.2%) |
| 45 to 49 Years | 33 (6.8%) | 45 (13.4%) |
| 50 to 54 Years | 52 (10.7%) | 10 (3.0%) |
| 55 to 59 Years | 45 (9.2%) | 21 (6.3%) |
| 60 to 64 Years | 0 (0.0%) | 28 (8.4%) |
| 65 to 69 Years | 55 (11.3%) | 31 (9.2%) |
| 70 to 74 Years | 21 (4.3%) | 4 (1.2%) |
| 75 to 79 Years | 14 (2.9%) | 20 (6.0%) |
| 80 to 84 Years | 0 (0.0%) | 5 (1.5%) |
| 85 Years and over | 0 (0.0%) | 7 (2.1%) |
| Total | 487 (100.0%) | 335 (100.0%) |
Families and Households in Trout Lake
Median Family Size in Trout Lake
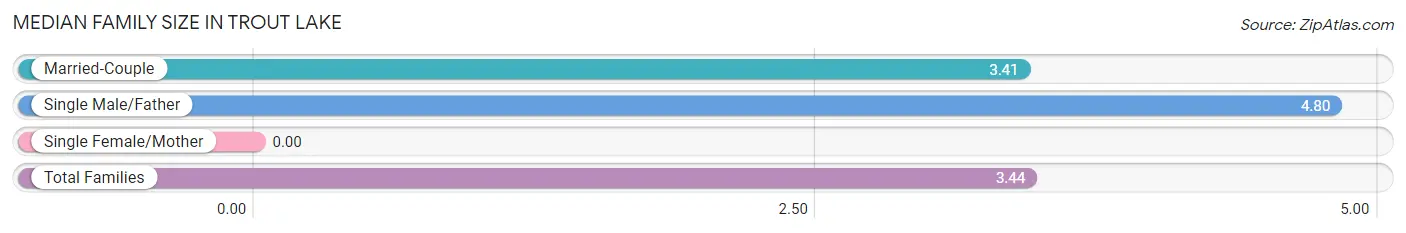
| Family Type | # Families | Family Size |
| Married-Couple | 207 (97.6%) | 3.41 |
| Single Male/Father | 5 (2.4%) | 4.80 |
| Single Female/Mother | 0 (0.0%) | - |
| Total Families | 212 (100.0%) | 3.44 |
Median Household Size in Trout Lake
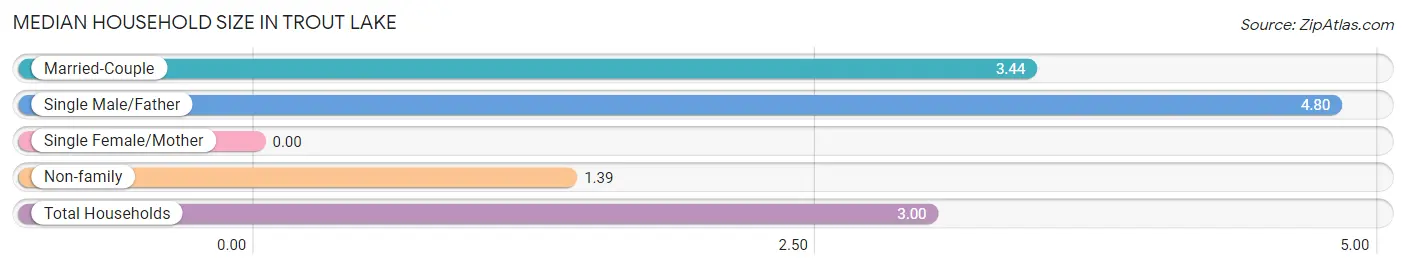
| Household Type | # Households | Household Size |
| Married-Couple | 207 (75.5%) | 3.44 |
| Single Male/Father | 5 (1.8%) | 4.80 |
| Single Female/Mother | 0 (0.0%) | - |
| Non-family | 62 (22.6%) | 1.39 |
| Total Households | 274 (100.0%) | 3.00 |
Household Size by Marriage Status in Trout Lake
Out of a total of 274 households in Trout Lake, 212 (77.4%) are family households, while 62 (22.6%) are nonfamily households. The most numerous type of family households are 2-person households, comprising 103, and the most common type of nonfamily households are 1-person households, comprising 52.
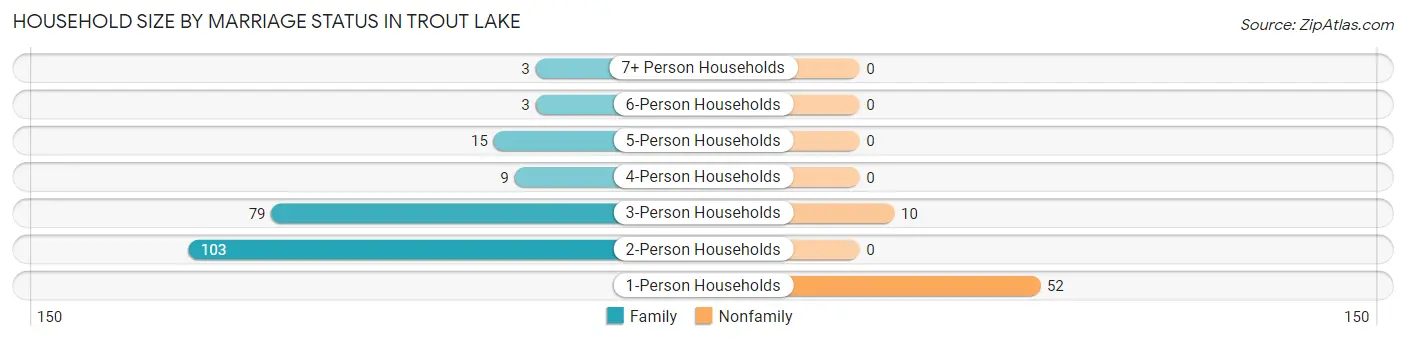
| Household Size | Family Households | Nonfamily Households |
| 1-Person Households | - | 52 (19.0%) |
| 2-Person Households | 103 (37.6%) | 0 (0.0%) |
| 3-Person Households | 79 (28.8%) | 10 (3.6%) |
| 4-Person Households | 9 (3.3%) | 0 (0.0%) |
| 5-Person Households | 15 (5.5%) | 0 (0.0%) |
| 6-Person Households | 3 (1.1%) | 0 (0.0%) |
| 7+ Person Households | 3 (1.1%) | 0 (0.0%) |
| Total | 212 (77.4%) | 62 (22.6%) |
Female Fertility in Trout Lake
Fertility by Age in Trout Lake
Average fertility rate in Trout Lake is 122.0 births per 1,000 women. Women in the age bracket of 20 to 34 years have the highest fertility rate with 271.0 births per 1,000 women. Women in the age bracket of 20 to 34 years acount for 100.0% of all women with births.
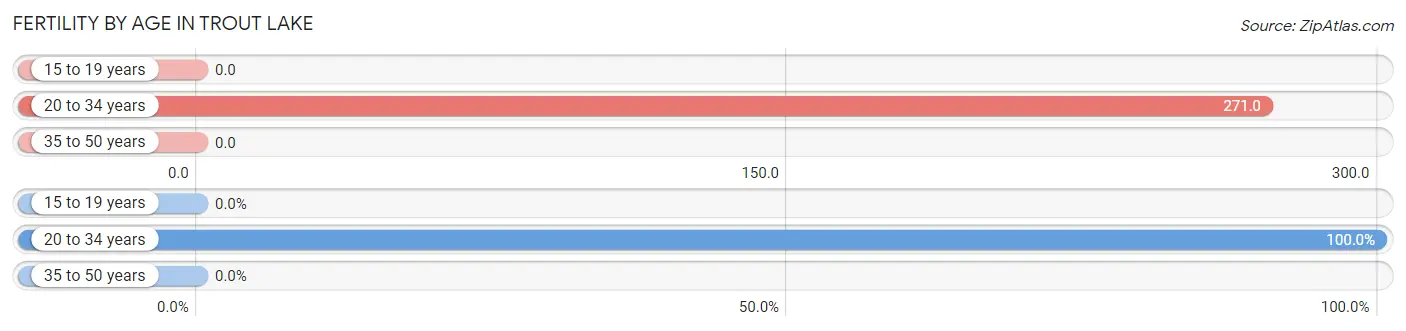
| Age Bracket | Women with Births | Births / 1,000 Women |
| 15 to 19 years | 0 (0.0%) | 0.0 |
| 20 to 34 years | 19 (100.0%) | 271.0 |
| 35 to 50 years | 0 (0.0%) | 0.0 |
| Total | 19 (100.0%) | 122.0 |
Fertility by Age by Marriage Status in Trout Lake
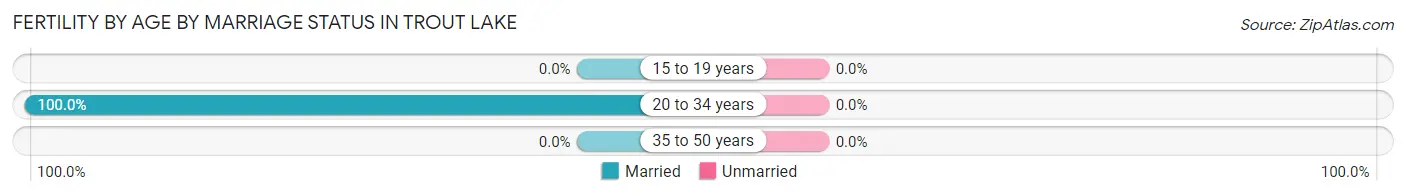
| Age Bracket | Married | Unmarried |
| 15 to 19 years | 0 (0.0%) | 0 (0.0%) |
| 20 to 34 years | 19 (100.0%) | 0 (0.0%) |
| 35 to 50 years | 0 (0.0%) | 0 (0.0%) |
| Total | 19 (100.0%) | 0 (0.0%) |
Fertility by Education in Trout Lake
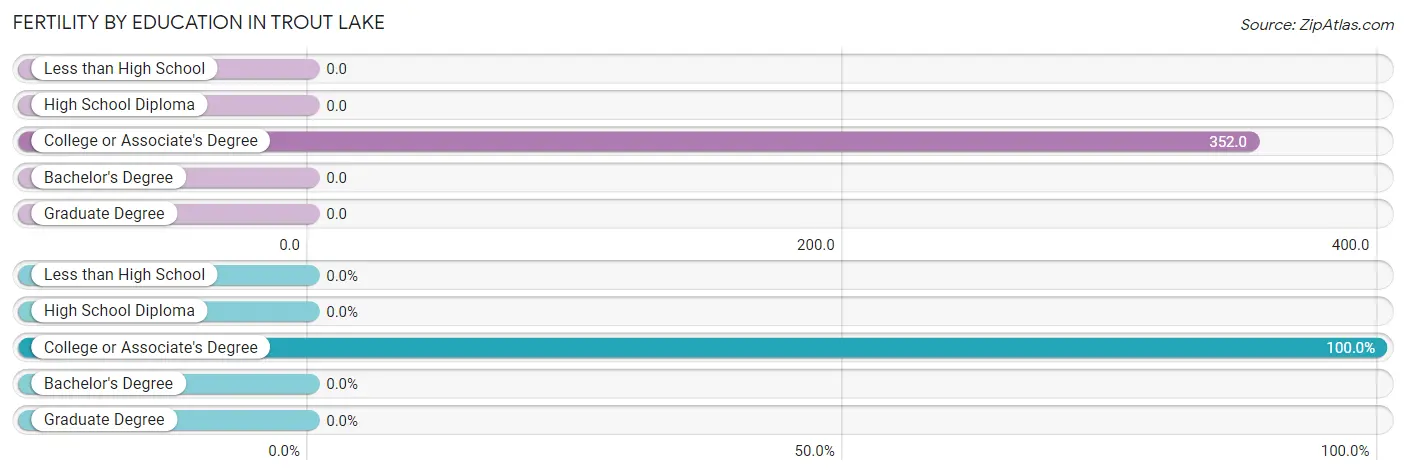
| Educational Attainment | Women with Births | Births / 1,000 Women |
| Less than High School | 0 (0.0%) | 0.0 |
| High School Diploma | 0 (0.0%) | 0.0 |
| College or Associate's Degree | 19 (100.0%) | 352.0 |
| Bachelor's Degree | 0 (0.0%) | 0.0 |
| Graduate Degree | 0 (0.0%) | 0.0 |
| Total | 19 (100.0%) | 122.0 |
Fertility by Education by Marriage Status in Trout Lake
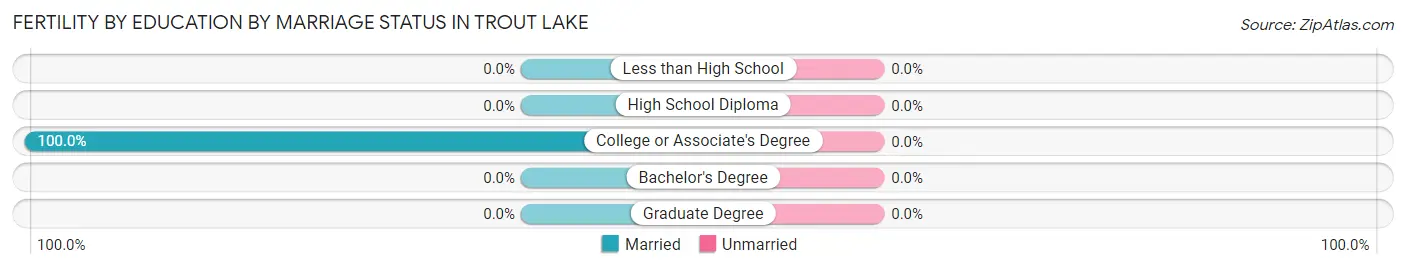
| Educational Attainment | Married | Unmarried |
| Less than High School | 0 (0.0%) | 0 (0.0%) |
| High School Diploma | 0 (0.0%) | 0 (0.0%) |
| College or Associate's Degree | 19 (100.0%) | 0 (0.0%) |
| Bachelor's Degree | 0 (0.0%) | 0 (0.0%) |
| Graduate Degree | 0 (0.0%) | 0 (0.0%) |
| Total | 19 (100.0%) | 0 (0.0%) |
Employment Characteristics in Trout Lake
Employment by Class of Employer in Trout Lake
Among the 489 employed individuals in Trout Lake, private company employees (208 | 42.5%), self-employed (not incorporated) (114 | 23.3%), and local government employees (90 | 18.4%) make up the most common classes of employment.
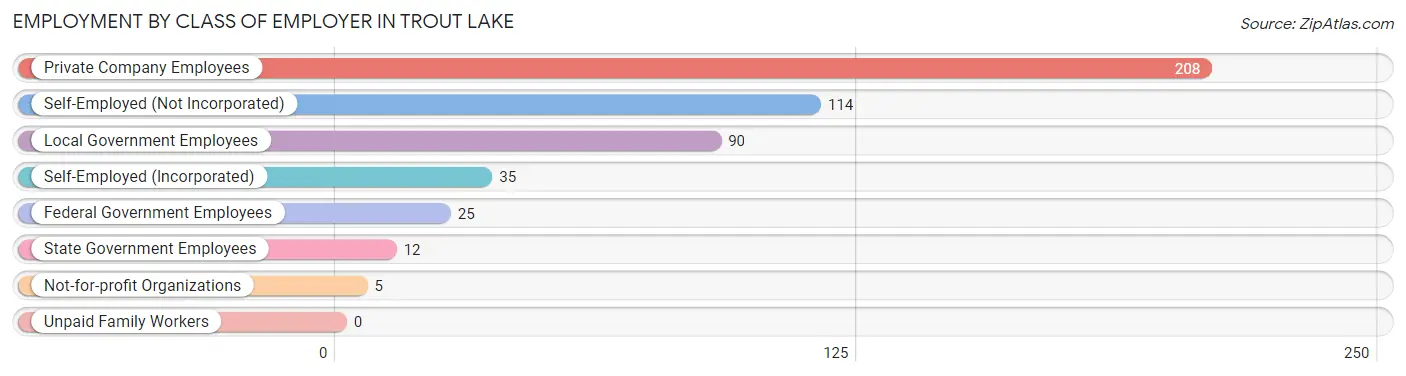
| Employer Class | # Employees | % Employees |
| Private Company Employees | 208 | 42.5% |
| Self-Employed (Incorporated) | 35 | 7.2% |
| Self-Employed (Not Incorporated) | 114 | 23.3% |
| Not-for-profit Organizations | 5 | 1.0% |
| Local Government Employees | 90 | 18.4% |
| State Government Employees | 12 | 2.5% |
| Federal Government Employees | 25 | 5.1% |
| Unpaid Family Workers | 0 | 0.0% |
| Total | 489 | 100.0% |
Employment Status by Age in Trout Lake
According to the labor force statistics for Trout Lake, out of the total population over 16 years of age (697), 74.0% or 516 individuals are in the labor force, with 0.8% or 4 of them unemployed. The age group with the highest labor force participation rate is 20 to 24 years, with 100.0% or 45 individuals in the labor force. Within the labor force, the 25 to 29 years age range has the highest percentage of unemployed individuals, with 10.8% or 4 of them being unemployed.
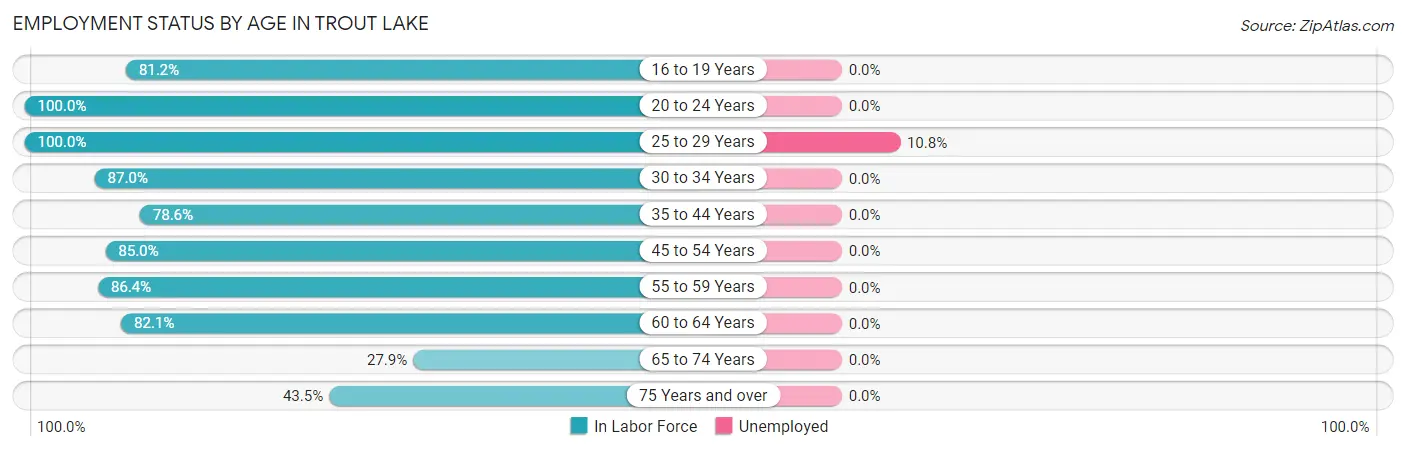
| Age Bracket | In Labor Force | Unemployed |
| 16 to 19 Years | 69 (81.2%) | 0 (0.0%) |
| 20 to 24 Years | 45 (100.0%) | 0 (0.0%) |
| 25 to 29 Years | 37 (100.0%) | 4 (10.8%) |
| 30 to 34 Years | 60 (87.0%) | 0 (0.0%) |
| 35 to 44 Years | 55 (78.6%) | 0 (0.0%) |
| 45 to 54 Years | 119 (85.0%) | 0 (0.0%) |
| 55 to 59 Years | 57 (86.4%) | 0 (0.0%) |
| 60 to 64 Years | 23 (82.1%) | 0 (0.0%) |
| 65 to 74 Years | 31 (27.9%) | 0 (0.0%) |
| 75 Years and over | 20 (43.5%) | 0 (0.0%) |
| Total | 516 (74.0%) | 4 (0.8%) |
Employment Status by Educational Attainment in Trout Lake
According to labor force statistics for Trout Lake, 85.6% of individuals (351) out of the total population between 25 and 64 years of age (410) are in the labor force, with 1.1% or 4 of them being unemployed. The group with the highest labor force participation rate are those with the educational attainment of bachelor's degree or higher, with 89.1% or 123 individuals in the labor force. Within the labor force, individuals with less than high school education have the highest percentage of unemployment, with 100.0% or 4 of them being unemployed.
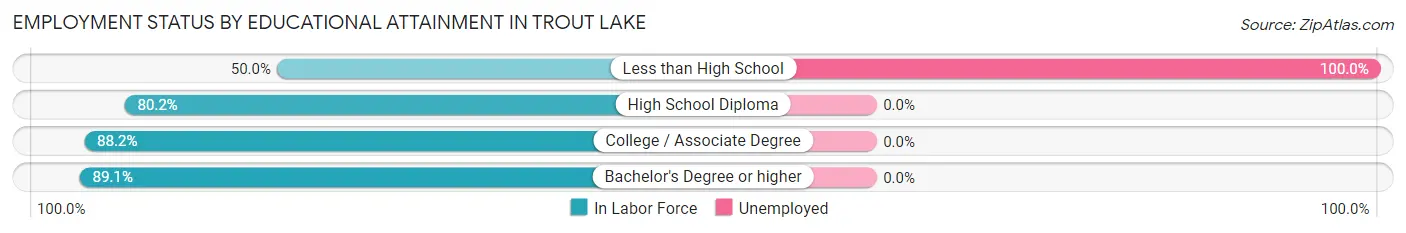
| Educational Attainment | In Labor Force | Unemployed |
| Less than High School | 4 (50.0%) | 8 (100.0%) |
| High School Diploma | 89 (80.2%) | 0 (0.0%) |
| College / Associate Degree | 135 (88.2%) | 0 (0.0%) |
| Bachelor's Degree or higher | 123 (89.1%) | 0 (0.0%) |
| Total | 351 (85.6%) | 5 (1.1%) |
Employment Occupations by Sex in Trout Lake
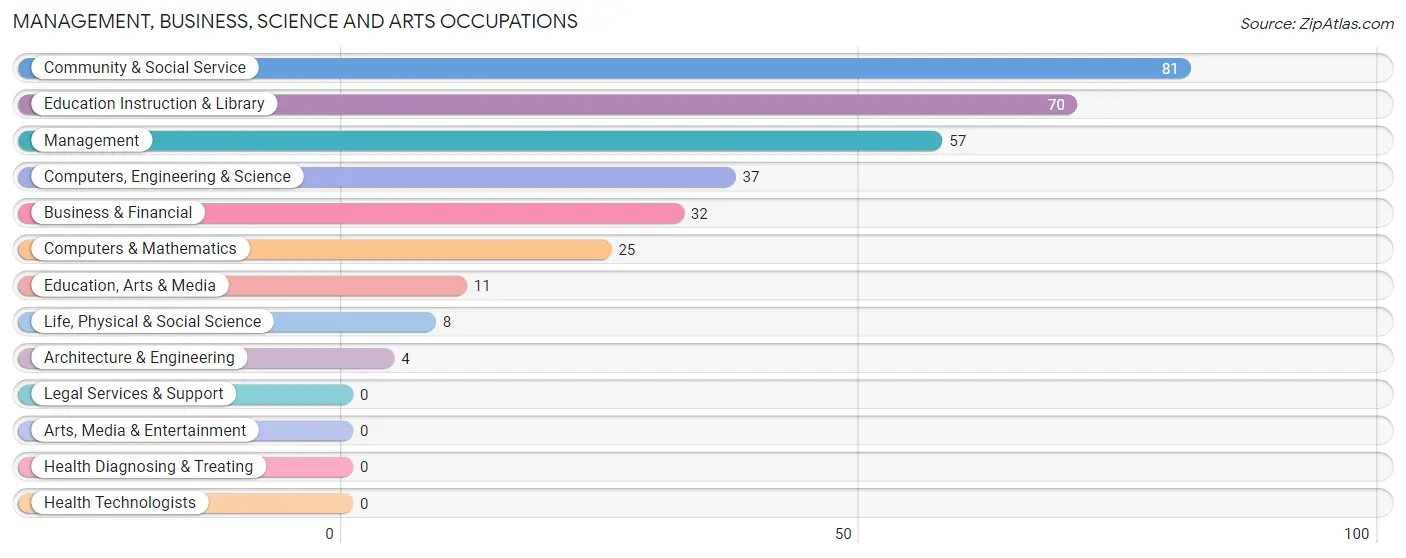
Management, Business, Science and Arts Occupations
The most common Management, Business, Science and Arts occupations in Trout Lake are Community & Social Service (81 | 15.8%), Education Instruction & Library (70 | 13.7%), Management (57 | 11.1%), Computers, Engineering & Science (37 | 7.2%), and Business & Financial (32 | 6.2%).
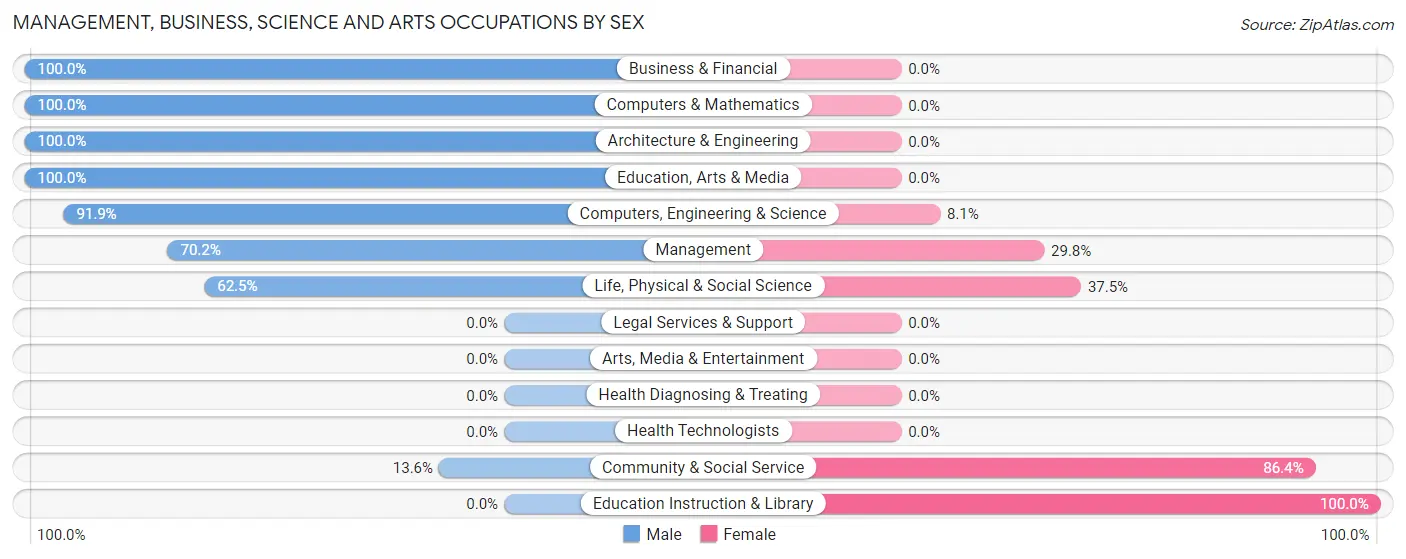
Management, Business, Science and Arts Occupations by Sex
Within the Management, Business, Science and Arts occupations in Trout Lake, the most male-oriented occupations are Business & Financial (100.0%), Computers & Mathematics (100.0%), and Architecture & Engineering (100.0%), while the most female-oriented occupations are Education Instruction & Library (100.0%), Community & Social Service (86.4%), and Life, Physical & Social Science (37.5%).
| Occupation | Male | Female |
| Management | 40 (70.2%) | 17 (29.8%) |
| Business & Financial | 32 (100.0%) | 0 (0.0%) |
| Computers, Engineering & Science | 34 (91.9%) | 3 (8.1%) |
| Computers & Mathematics | 25 (100.0%) | 0 (0.0%) |
| Architecture & Engineering | 4 (100.0%) | 0 (0.0%) |
| Life, Physical & Social Science | 5 (62.5%) | 3 (37.5%) |
| Community & Social Service | 11 (13.6%) | 70 (86.4%) |
| Education, Arts & Media | 11 (100.0%) | 0 (0.0%) |
| Legal Services & Support | 0 (0.0%) | 0 (0.0%) |
| Education Instruction & Library | 0 (0.0%) | 70 (100.0%) |
| Arts, Media & Entertainment | 0 (0.0%) | 0 (0.0%) |
| Health Diagnosing & Treating | 0 (0.0%) | 0 (0.0%) |
| Health Technologists | 0 (0.0%) | 0 (0.0%) |
| Total (Category) | 117 (56.5%) | 90 (43.5%) |
| Total (Overall) | 320 (62.5%) | 192 (37.5%) |
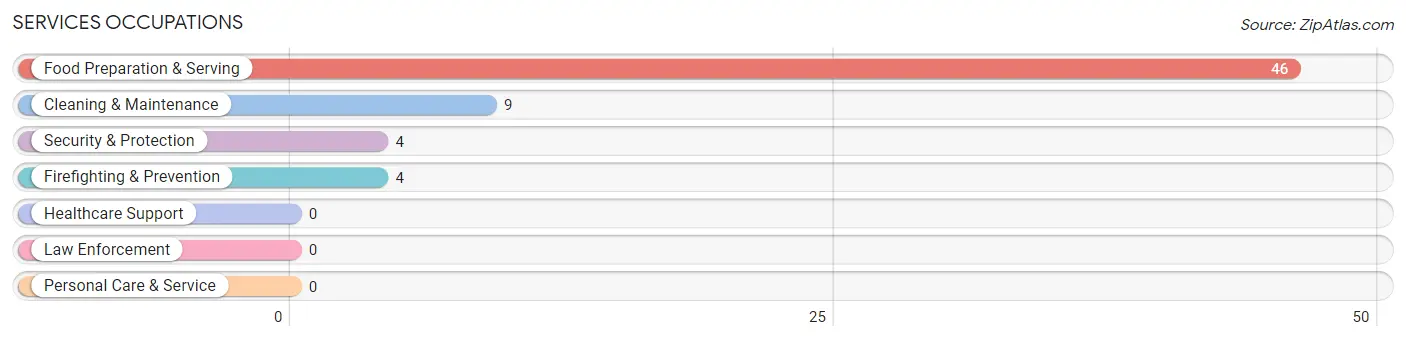
Services Occupations
The most common Services occupations in Trout Lake are Food Preparation & Serving (46 | 9.0%), Cleaning & Maintenance (9 | 1.8%), Security & Protection (4 | 0.8%), and Firefighting & Prevention (4 | 0.8%).
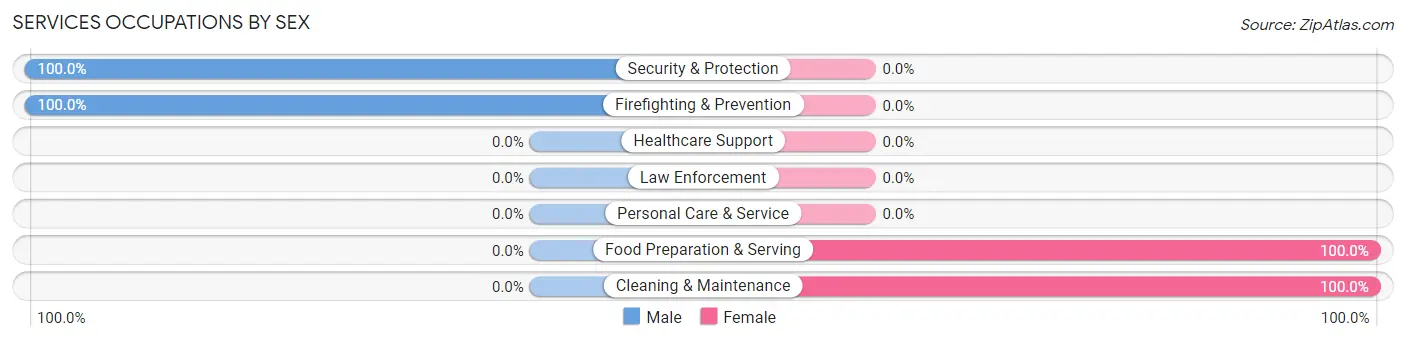
Services Occupations by Sex
Within the Services occupations in Trout Lake, the most male-oriented occupations are Security & Protection (100.0%), and Firefighting & Prevention (100.0%), while the most female-oriented occupations are Food Preparation & Serving (100.0%), and Cleaning & Maintenance (100.0%).
| Occupation | Male | Female |
| Healthcare Support | 0 (0.0%) | 0 (0.0%) |
| Security & Protection | 4 (100.0%) | 0 (0.0%) |
| Firefighting & Prevention | 4 (100.0%) | 0 (0.0%) |
| Law Enforcement | 0 (0.0%) | 0 (0.0%) |
| Food Preparation & Serving | 0 (0.0%) | 46 (100.0%) |
| Cleaning & Maintenance | 0 (0.0%) | 9 (100.0%) |
| Personal Care & Service | 0 (0.0%) | 0 (0.0%) |
| Total (Category) | 4 (6.8%) | 55 (93.2%) |
| Total (Overall) | 320 (62.5%) | 192 (37.5%) |
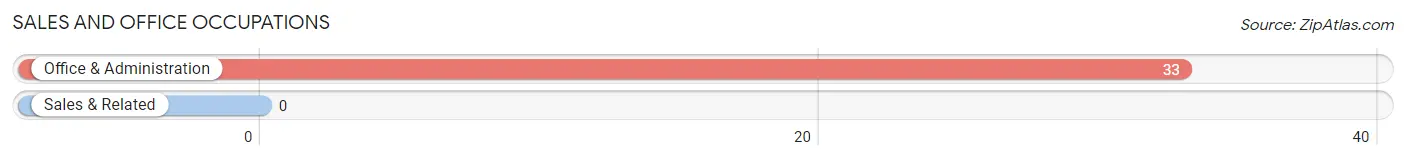
Sales and Office Occupations
The most common Sales and Office occupations in Trout Lake are , and Office & Administration (33 | 6.5%).
Sales and Office Occupations by Sex
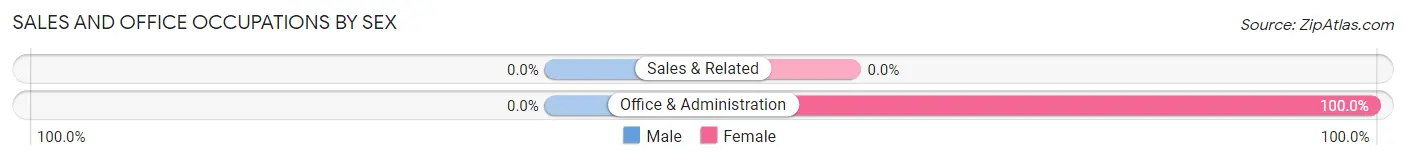
| Occupation | Male | Female |
| Sales & Related | 0 (0.0%) | 0 (0.0%) |
| Office & Administration | 0 (0.0%) | 33 (100.0%) |
| Total (Category) | 0 (0.0%) | 33 (100.0%) |
| Total (Overall) | 320 (62.5%) | 192 (37.5%) |
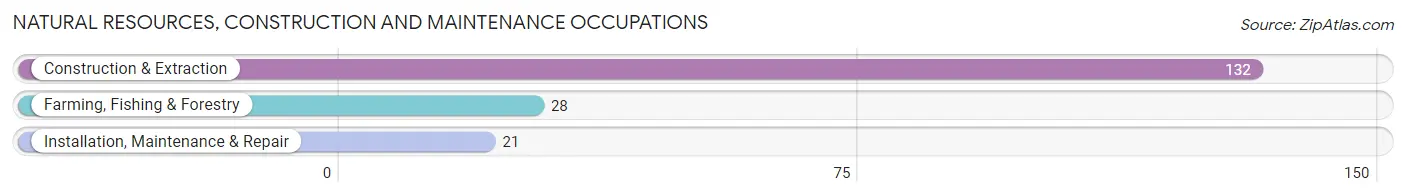
Natural Resources, Construction and Maintenance Occupations
The most common Natural Resources, Construction and Maintenance occupations in Trout Lake are Construction & Extraction (132 | 25.8%), Farming, Fishing & Forestry (28 | 5.5%), and Installation, Maintenance & Repair (21 | 4.1%).
Natural Resources, Construction and Maintenance Occupations by Sex
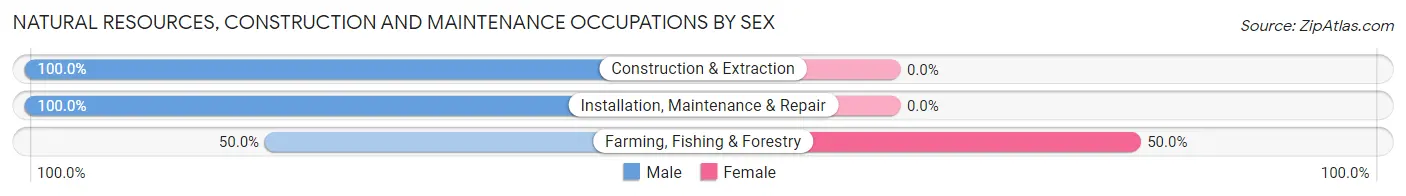
| Occupation | Male | Female |
| Farming, Fishing & Forestry | 14 (50.0%) | 14 (50.0%) |
| Construction & Extraction | 132 (100.0%) | 0 (0.0%) |
| Installation, Maintenance & Repair | 21 (100.0%) | 0 (0.0%) |
| Total (Category) | 167 (92.3%) | 14 (7.7%) |
| Total (Overall) | 320 (62.5%) | 192 (37.5%) |
Production, Transportation and Moving Occupations
The most common Production, Transportation and Moving occupations in Trout Lake are Production (28 | 5.5%), and Material Moving (4 | 0.8%).
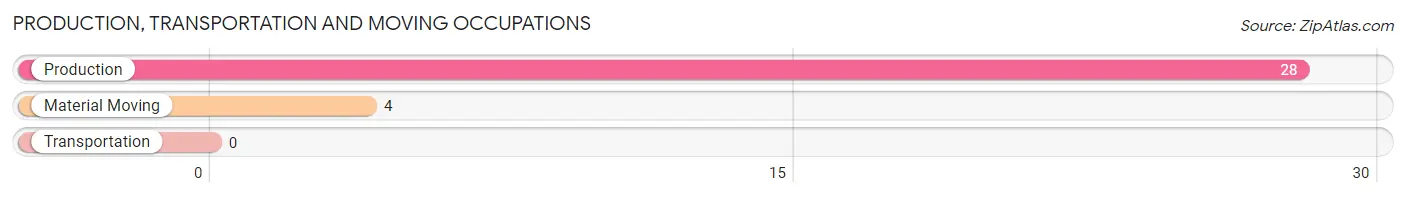
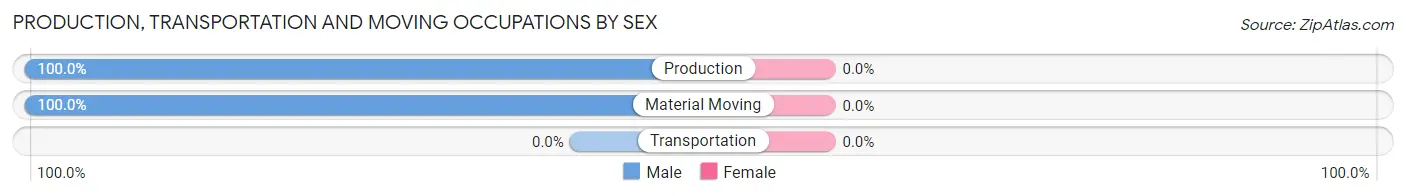
Production, Transportation and Moving Occupations by Sex
| Occupation | Male | Female |
| Production | 28 (100.0%) | 0 (0.0%) |
| Transportation | 0 (0.0%) | 0 (0.0%) |
| Material Moving | 4 (100.0%) | 0 (0.0%) |
| Total (Category) | 32 (100.0%) | 0 (0.0%) |
| Total (Overall) | 320 (62.5%) | 192 (37.5%) |
Employment Industries by Sex in Trout Lake
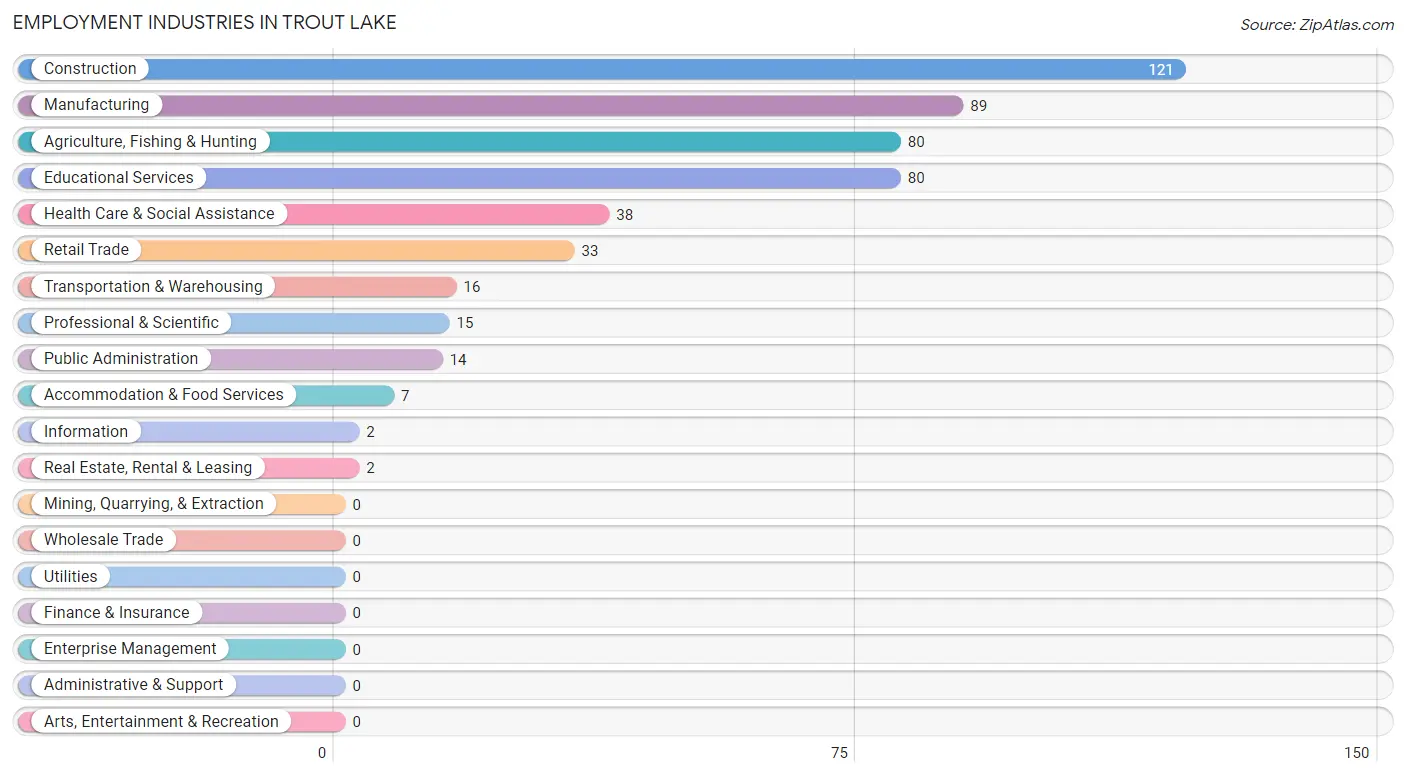
Employment Industries in Trout Lake
The major employment industries in Trout Lake include Construction (121 | 23.6%), Manufacturing (89 | 17.4%), Agriculture, Fishing & Hunting (80 | 15.6%), Educational Services (80 | 15.6%), and Health Care & Social Assistance (38 | 7.4%).
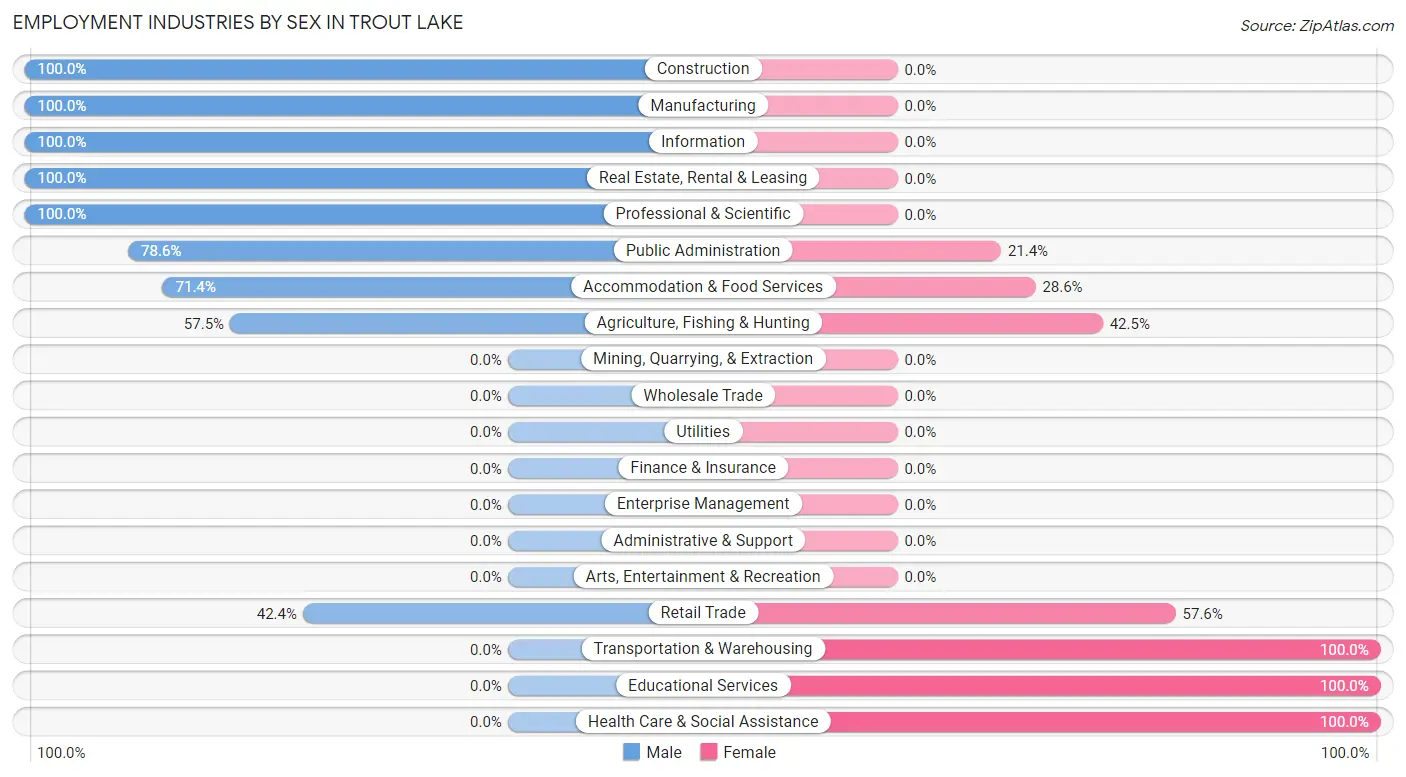
Employment Industries by Sex in Trout Lake
The Trout Lake industries that see more men than women are Construction (100.0%), Manufacturing (100.0%), and Information (100.0%), whereas the industries that tend to have a higher number of women are Transportation & Warehousing (100.0%), Educational Services (100.0%), and Health Care & Social Assistance (100.0%).
| Industry | Male | Female |
| Agriculture, Fishing & Hunting | 46 (57.5%) | 34 (42.5%) |
| Mining, Quarrying, & Extraction | 0 (0.0%) | 0 (0.0%) |
| Construction | 121 (100.0%) | 0 (0.0%) |
| Manufacturing | 89 (100.0%) | 0 (0.0%) |
| Wholesale Trade | 0 (0.0%) | 0 (0.0%) |
| Retail Trade | 14 (42.4%) | 19 (57.6%) |
| Transportation & Warehousing | 0 (0.0%) | 16 (100.0%) |
| Utilities | 0 (0.0%) | 0 (0.0%) |
| Information | 2 (100.0%) | 0 (0.0%) |
| Finance & Insurance | 0 (0.0%) | 0 (0.0%) |
| Real Estate, Rental & Leasing | 2 (100.0%) | 0 (0.0%) |
| Professional & Scientific | 15 (100.0%) | 0 (0.0%) |
| Enterprise Management | 0 (0.0%) | 0 (0.0%) |
| Administrative & Support | 0 (0.0%) | 0 (0.0%) |
| Educational Services | 0 (0.0%) | 80 (100.0%) |
| Health Care & Social Assistance | 0 (0.0%) | 38 (100.0%) |
| Arts, Entertainment & Recreation | 0 (0.0%) | 0 (0.0%) |
| Accommodation & Food Services | 5 (71.4%) | 2 (28.6%) |
| Public Administration | 11 (78.6%) | 3 (21.4%) |
| Total | 320 (62.5%) | 192 (37.5%) |
Education in Trout Lake
School Enrollment in Trout Lake
The most common levels of schooling among the 151 students in Trout Lake are high school (40 | 26.5%), elementary school (36 | 23.8%), and college / undergraduate (32 | 21.2%).
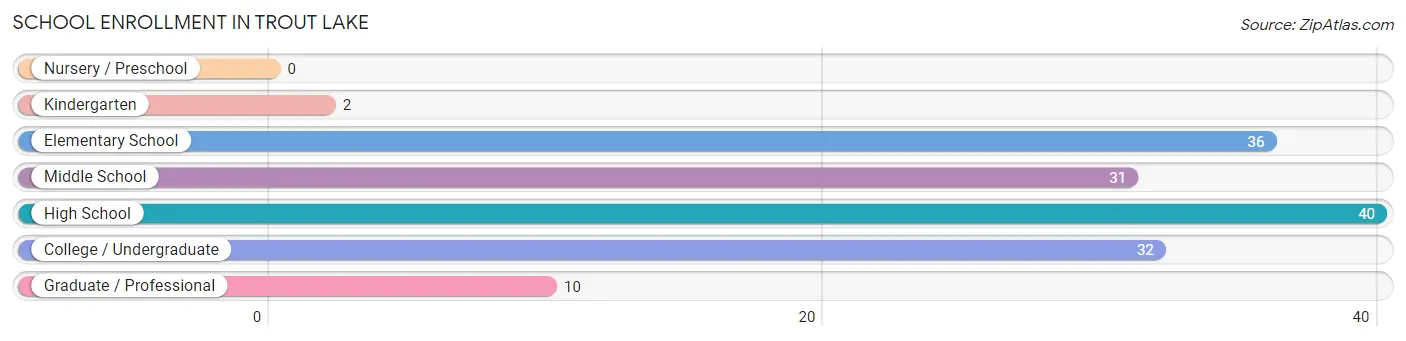
| School Level | # Students | % Students |
| Nursery / Preschool | 0 | 0.0% |
| Kindergarten | 2 | 1.3% |
| Elementary School | 36 | 23.8% |
| Middle School | 31 | 20.5% |
| High School | 40 | 26.5% |
| College / Undergraduate | 32 | 21.2% |
| Graduate / Professional | 10 | 6.6% |
| Total | 151 | 100.0% |
School Enrollment by Age by Funding Source in Trout Lake
Out of a total of 151 students who are enrolled in schools in Trout Lake, 31 (20.5%) attend a private institution, while the remaining 120 (79.5%) are enrolled in public schools. The age group of 10 to 14 year olds has the highest likelihood of being enrolled in private schools, with 11 (35.5% in the age bracket) enrolled. Conversely, the age group of 25 to 34 year olds has the lowest likelihood of being enrolled in a private school, with 10 (100.0% in the age bracket) attending a public institution.
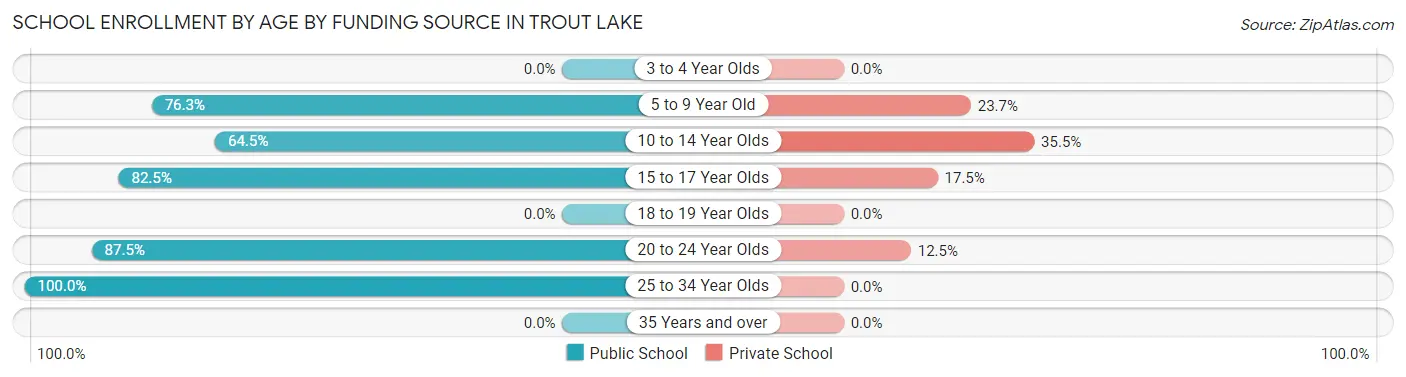
| Age Bracket | Public School | Private School |
| 3 to 4 Year Olds | 0 (0.0%) | 0 (0.0%) |
| 5 to 9 Year Old | 29 (76.3%) | 9 (23.7%) |
| 10 to 14 Year Olds | 20 (64.5%) | 11 (35.5%) |
| 15 to 17 Year Olds | 33 (82.5%) | 7 (17.5%) |
| 18 to 19 Year Olds | 0 (0.0%) | 0 (0.0%) |
| 20 to 24 Year Olds | 28 (87.5%) | 4 (12.5%) |
| 25 to 34 Year Olds | 10 (100.0%) | 0 (0.0%) |
| 35 Years and over | 0 (0.0%) | 0 (0.0%) |
| Total | 120 (79.5%) | 31 (20.5%) |
Educational Attainment by Field of Study in Trout Lake
Business (50 | 19.1%), literature & languages (50 | 19.1%), liberal arts & history (50 | 19.1%), bio, nature & agricultural (35 | 13.4%), and education (34 | 13.0%) are the most common fields of study among 262 individuals in Trout Lake who have obtained a bachelor's degree or higher.
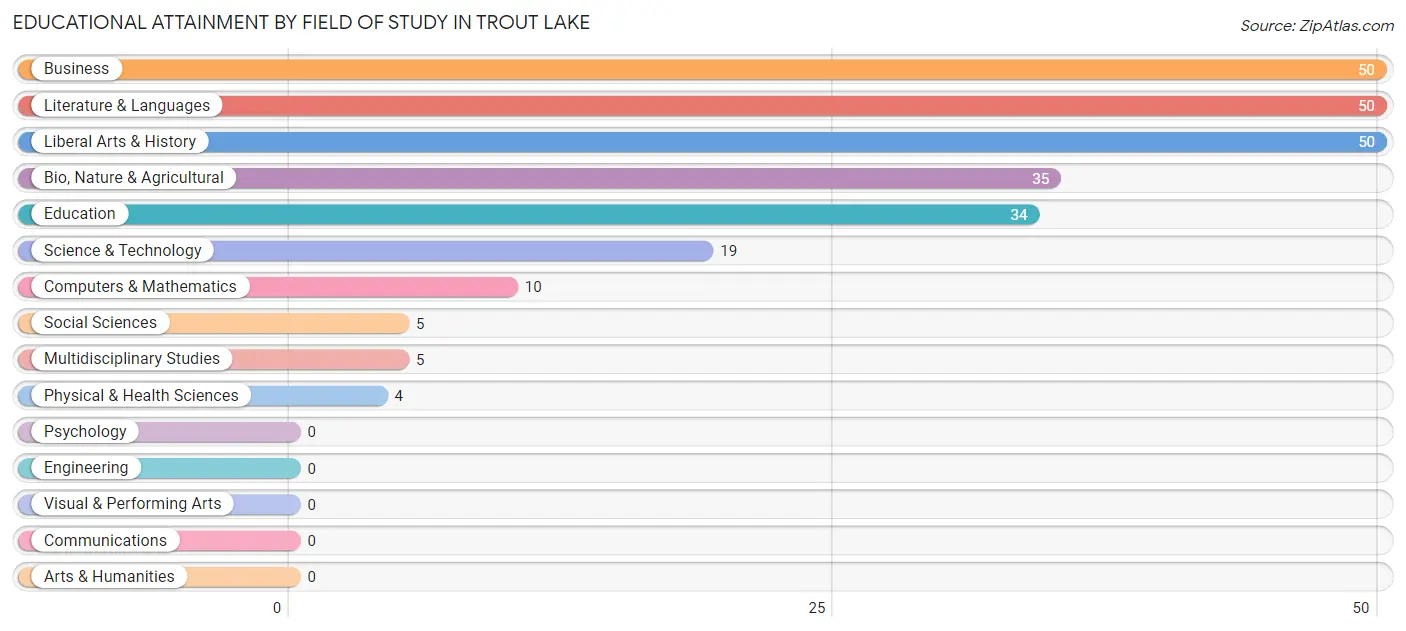
| Field of Study | # Graduates | % Graduates |
| Computers & Mathematics | 10 | 3.8% |
| Bio, Nature & Agricultural | 35 | 13.4% |
| Physical & Health Sciences | 4 | 1.5% |
| Psychology | 0 | 0.0% |
| Social Sciences | 5 | 1.9% |
| Engineering | 0 | 0.0% |
| Multidisciplinary Studies | 5 | 1.9% |
| Science & Technology | 19 | 7.2% |
| Business | 50 | 19.1% |
| Education | 34 | 13.0% |
| Literature & Languages | 50 | 19.1% |
| Liberal Arts & History | 50 | 19.1% |
| Visual & Performing Arts | 0 | 0.0% |
| Communications | 0 | 0.0% |
| Arts & Humanities | 0 | 0.0% |
| Total | 262 | 100.0% |
Transportation & Commute in Trout Lake
Vehicle Availability by Sex in Trout Lake
The most prevalent vehicle ownership categories in Trout Lake are males with 2 vehicles (122, accounting for 38.6%) and females with 2 vehicles (35, making up 70.5%).
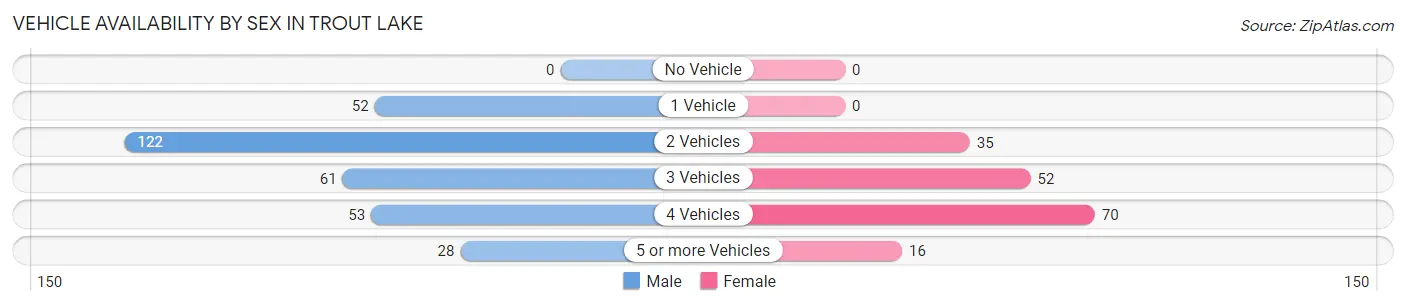
| Vehicles Available | Male | Female |
| No Vehicle | 0 (0.0%) | 0 (0.0%) |
| 1 Vehicle | 52 (16.5%) | 0 (0.0%) |
| 2 Vehicles | 122 (38.6%) | 35 (20.2%) |
| 3 Vehicles | 61 (19.3%) | 52 (30.1%) |
| 4 Vehicles | 53 (16.8%) | 70 (40.5%) |
| 5 or more Vehicles | 28 (8.9%) | 16 (9.2%) |
| Total | 316 (100.0%) | 173 (100.0%) |
Commute Time in Trout Lake
The most frequently occuring commute durations in Trout Lake are 30 to 34 minutes (113 commuters, 28.4%), 5 to 9 minutes (101 commuters, 25.4%), and less than 5 minutes (64 commuters, 16.1%).
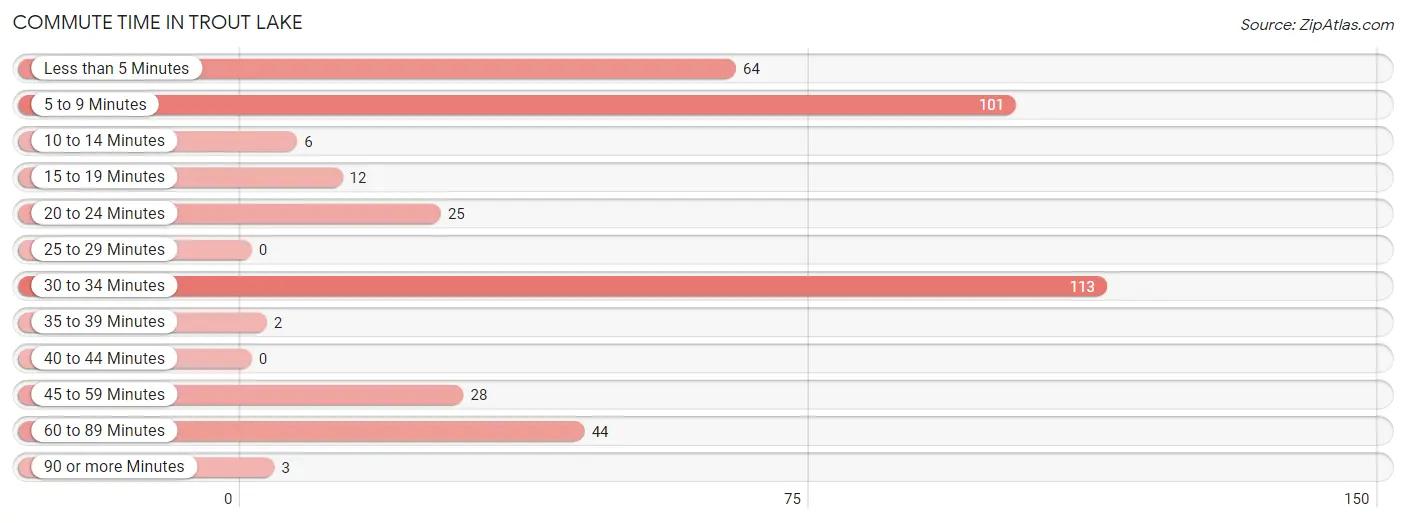
| Commute Time | # Commuters | % Commuters |
| Less than 5 Minutes | 64 | 16.1% |
| 5 to 9 Minutes | 101 | 25.4% |
| 10 to 14 Minutes | 6 | 1.5% |
| 15 to 19 Minutes | 12 | 3.0% |
| 20 to 24 Minutes | 25 | 6.3% |
| 25 to 29 Minutes | 0 | 0.0% |
| 30 to 34 Minutes | 113 | 28.4% |
| 35 to 39 Minutes | 2 | 0.5% |
| 40 to 44 Minutes | 0 | 0.0% |
| 45 to 59 Minutes | 28 | 7.0% |
| 60 to 89 Minutes | 44 | 11.1% |
| 90 or more Minutes | 3 | 0.7% |
Commute Time by Sex in Trout Lake
The most common commute times in Trout Lake are 5 to 9 minutes (78 commuters, 29.8%) for males and less than 5 minutes (42 commuters, 30.9%) for females.
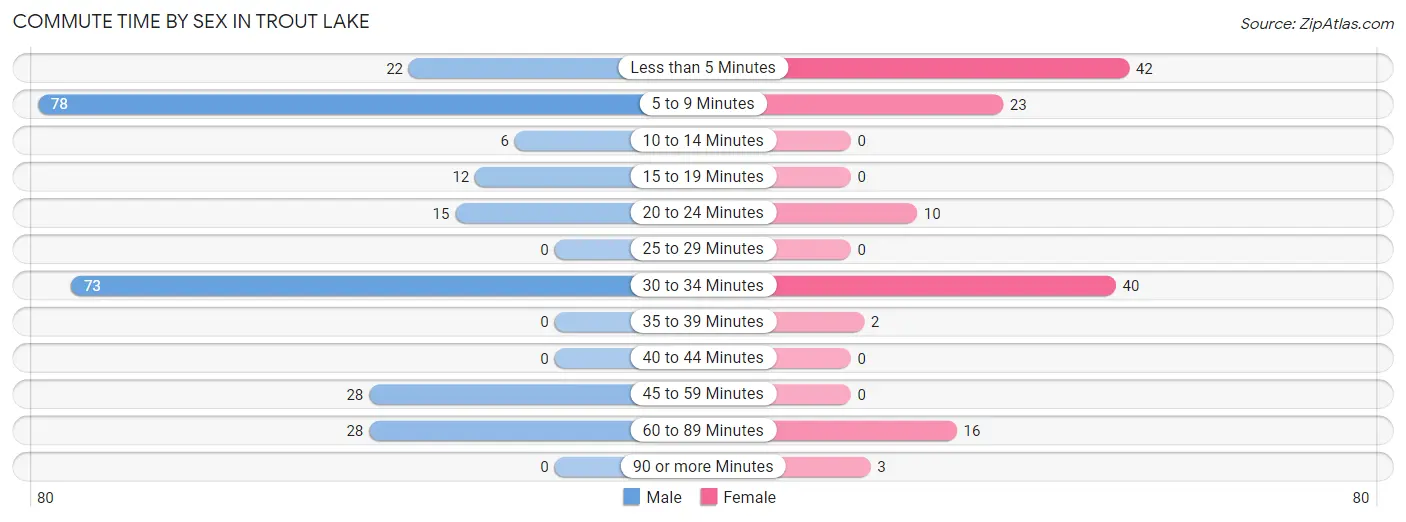
| Commute Time | Male | Female |
| Less than 5 Minutes | 22 (8.4%) | 42 (30.9%) |
| 5 to 9 Minutes | 78 (29.8%) | 23 (16.9%) |
| 10 to 14 Minutes | 6 (2.3%) | 0 (0.0%) |
| 15 to 19 Minutes | 12 (4.6%) | 0 (0.0%) |
| 20 to 24 Minutes | 15 (5.7%) | 10 (7.3%) |
| 25 to 29 Minutes | 0 (0.0%) | 0 (0.0%) |
| 30 to 34 Minutes | 73 (27.9%) | 40 (29.4%) |
| 35 to 39 Minutes | 0 (0.0%) | 2 (1.5%) |
| 40 to 44 Minutes | 0 (0.0%) | 0 (0.0%) |
| 45 to 59 Minutes | 28 (10.7%) | 0 (0.0%) |
| 60 to 89 Minutes | 28 (10.7%) | 16 (11.8%) |
| 90 or more Minutes | 0 (0.0%) | 3 (2.2%) |
Time of Departure to Work by Sex in Trout Lake
The most frequent times of departure to work in Trout Lake are 8:00 AM to 8:29 AM (69, 26.3%) for males and 7:00 AM to 7:29 AM (43, 31.6%) for females.
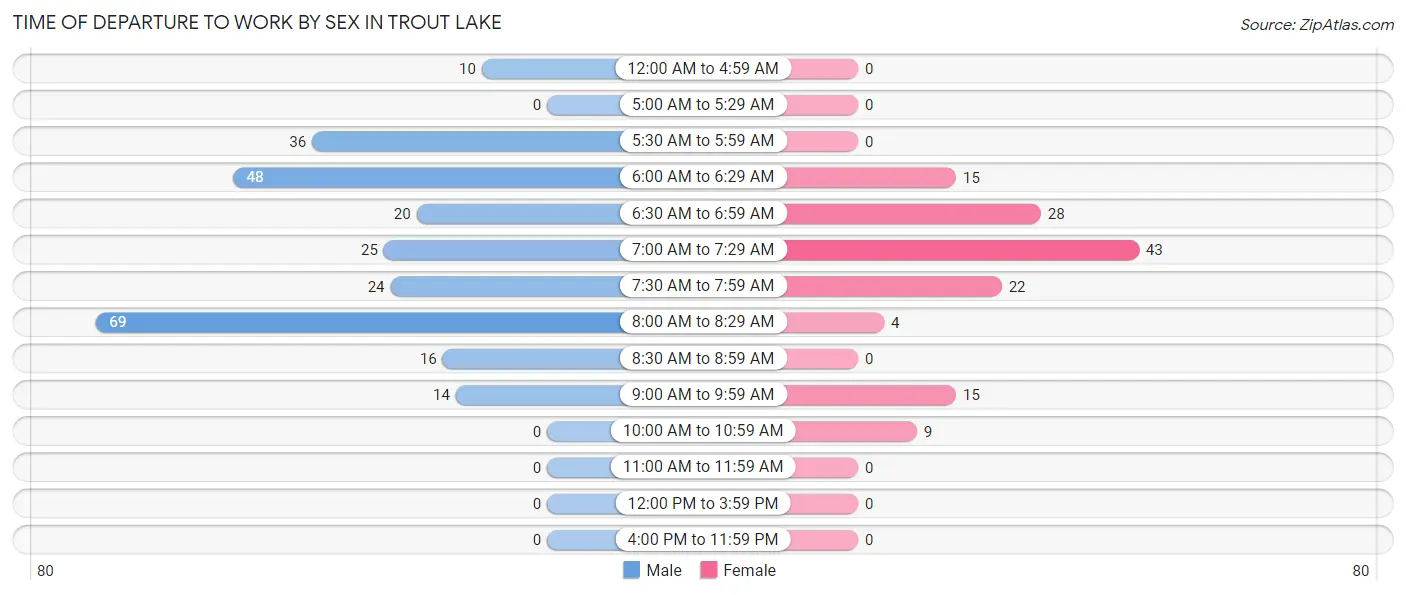
| Time of Departure | Male | Female |
| 12:00 AM to 4:59 AM | 10 (3.8%) | 0 (0.0%) |
| 5:00 AM to 5:29 AM | 0 (0.0%) | 0 (0.0%) |
| 5:30 AM to 5:59 AM | 36 (13.7%) | 0 (0.0%) |
| 6:00 AM to 6:29 AM | 48 (18.3%) | 15 (11.0%) |
| 6:30 AM to 6:59 AM | 20 (7.6%) | 28 (20.6%) |
| 7:00 AM to 7:29 AM | 25 (9.5%) | 43 (31.6%) |
| 7:30 AM to 7:59 AM | 24 (9.2%) | 22 (16.2%) |
| 8:00 AM to 8:29 AM | 69 (26.3%) | 4 (2.9%) |
| 8:30 AM to 8:59 AM | 16 (6.1%) | 0 (0.0%) |
| 9:00 AM to 9:59 AM | 14 (5.3%) | 15 (11.0%) |
| 10:00 AM to 10:59 AM | 0 (0.0%) | 9 (6.6%) |
| 11:00 AM to 11:59 AM | 0 (0.0%) | 0 (0.0%) |
| 12:00 PM to 3:59 PM | 0 (0.0%) | 0 (0.0%) |
| 4:00 PM to 11:59 PM | 0 (0.0%) | 0 (0.0%) |
| Total | 262 (100.0%) | 136 (100.0%) |
Housing Occupancy in Trout Lake
Occupancy by Ownership in Trout Lake
Of the total 274 dwellings in Trout Lake, owner-occupied units account for 232 (84.7%), while renter-occupied units make up 42 (15.3%).
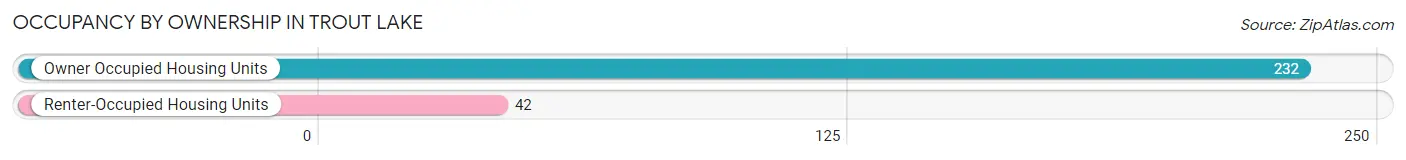
| Occupancy | # Housing Units | % Housing Units |
| Owner Occupied Housing Units | 232 | 84.7% |
| Renter-Occupied Housing Units | 42 | 15.3% |
| Total Occupied Housing Units | 274 | 100.0% |
Occupancy by Household Size in Trout Lake
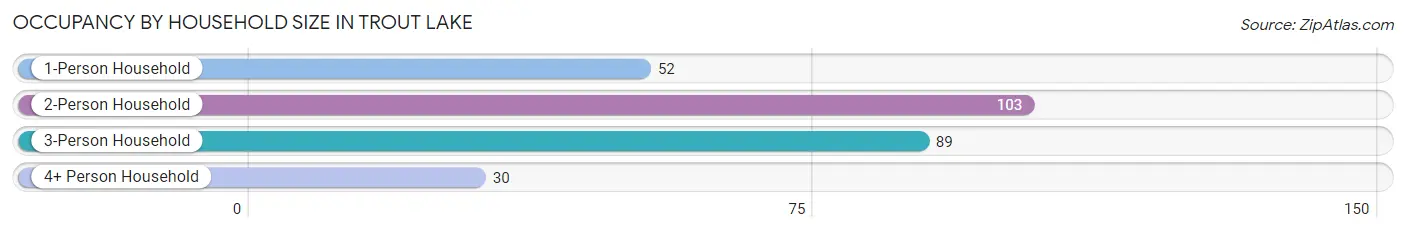
| Household Size | # Housing Units | % Housing Units |
| 1-Person Household | 52 | 19.0% |
| 2-Person Household | 103 | 37.6% |
| 3-Person Household | 89 | 32.5% |
| 4+ Person Household | 30 | 11.0% |
| Total Housing Units | 274 | 100.0% |
Occupancy by Ownership by Household Size in Trout Lake
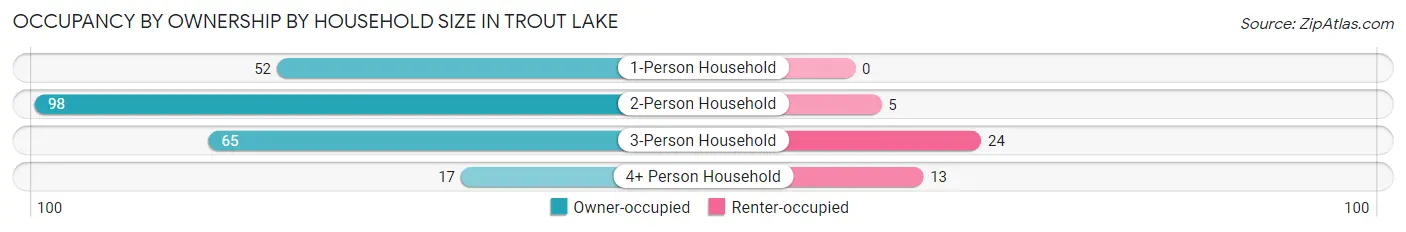
| Household Size | Owner-occupied | Renter-occupied |
| 1-Person Household | 52 (100.0%) | 0 (0.0%) |
| 2-Person Household | 98 (95.2%) | 5 (4.9%) |
| 3-Person Household | 65 (73.0%) | 24 (27.0%) |
| 4+ Person Household | 17 (56.7%) | 13 (43.3%) |
| Total Housing Units | 232 (84.7%) | 42 (15.3%) |
Occupancy by Educational Attainment in Trout Lake
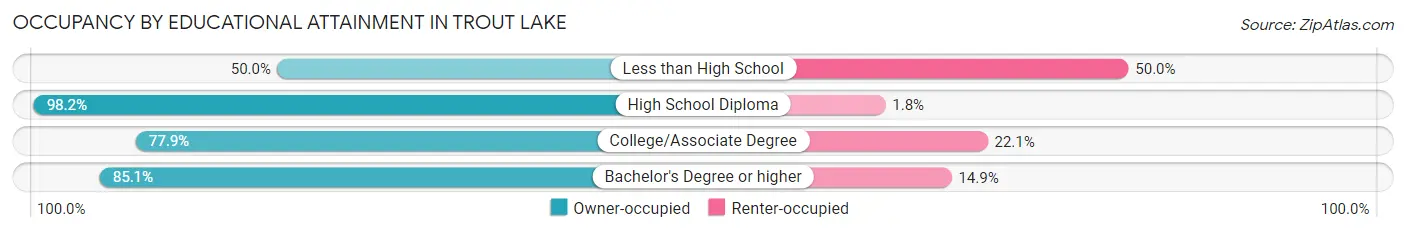
| Household Size | Owner-occupied | Renter-occupied |
| Less than High School | 4 (50.0%) | 4 (50.0%) |
| High School Diploma | 54 (98.2%) | 1 (1.8%) |
| College/Associate Degree | 60 (77.9%) | 17 (22.1%) |
| Bachelor's Degree or higher | 114 (85.1%) | 20 (14.9%) |
Occupancy by Age of Householder in Trout Lake
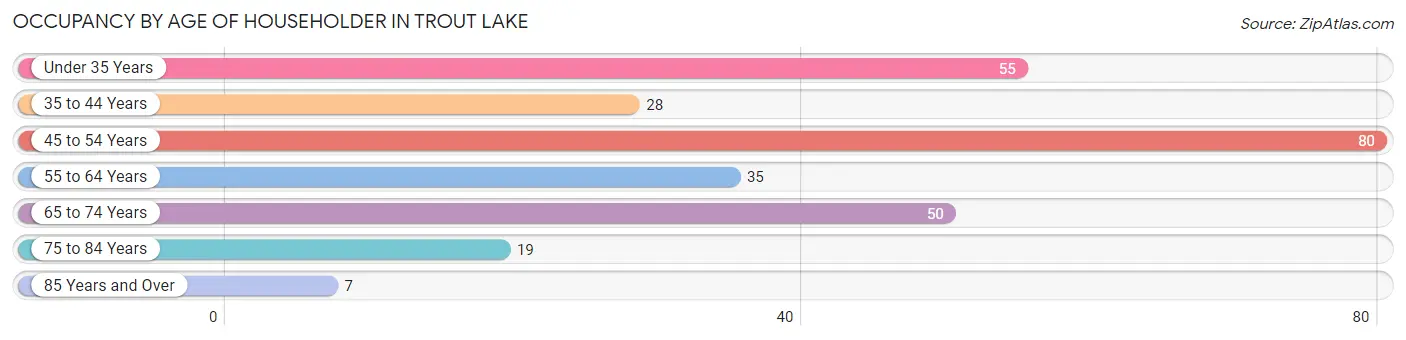
| Age Bracket | # Households | % Households |
| Under 35 Years | 55 | 20.1% |
| 35 to 44 Years | 28 | 10.2% |
| 45 to 54 Years | 80 | 29.2% |
| 55 to 64 Years | 35 | 12.8% |
| 65 to 74 Years | 50 | 18.2% |
| 75 to 84 Years | 19 | 6.9% |
| 85 Years and Over | 7 | 2.5% |
| Total | 274 | 100.0% |
Housing Finances in Trout Lake
Median Income by Occupancy in Trout Lake
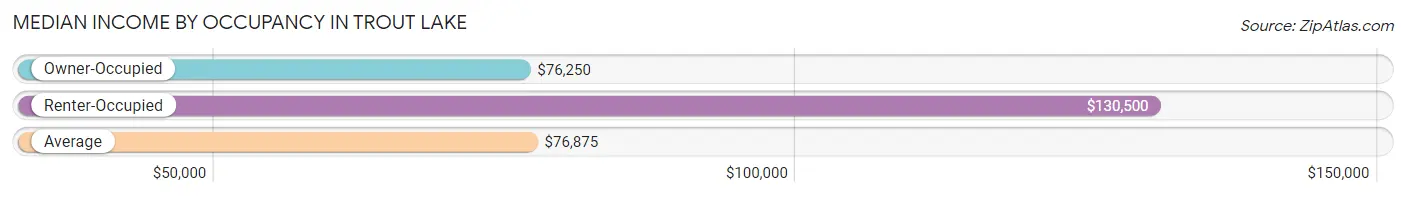
| Occupancy Type | # Households | Median Income |
| Owner-Occupied | 232 (84.7%) | $76,250 |
| Renter-Occupied | 42 (15.3%) | $130,500 |
| Average | 274 (100.0%) | $76,875 |
Occupancy by Householder Income Bracket in Trout Lake
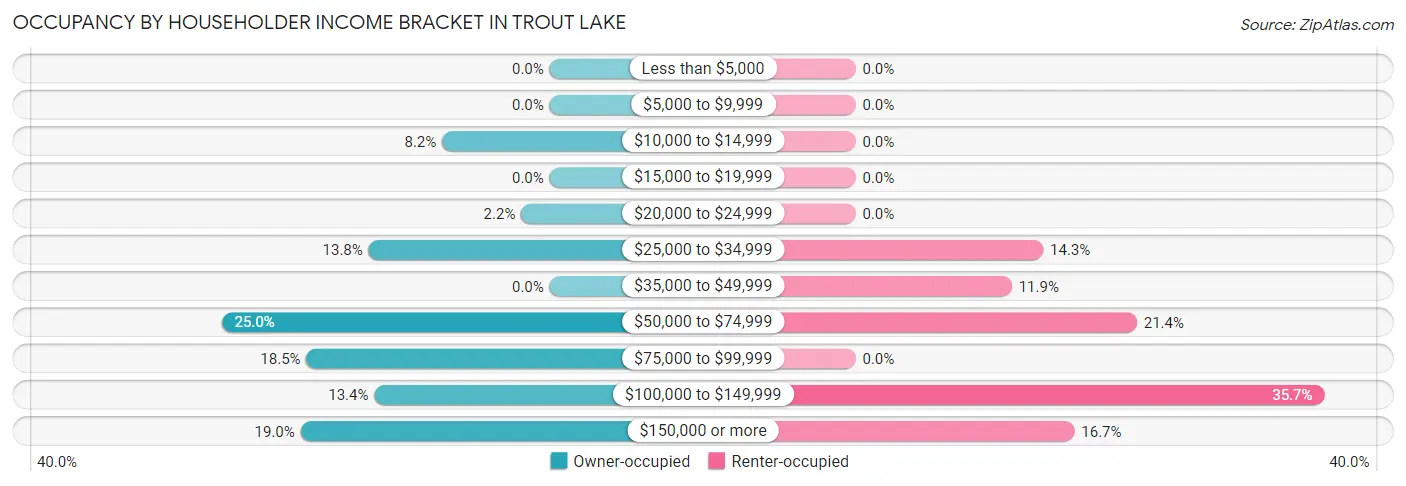
| Income Bracket | Owner-occupied | Renter-occupied |
| Less than $5,000 | 0 (0.0%) | 0 (0.0%) |
| $5,000 to $9,999 | 0 (0.0%) | 0 (0.0%) |
| $10,000 to $14,999 | 19 (8.2%) | 0 (0.0%) |
| $15,000 to $19,999 | 0 (0.0%) | 0 (0.0%) |
| $20,000 to $24,999 | 5 (2.2%) | 0 (0.0%) |
| $25,000 to $34,999 | 32 (13.8%) | 6 (14.3%) |
| $35,000 to $49,999 | 0 (0.0%) | 5 (11.9%) |
| $50,000 to $74,999 | 58 (25.0%) | 9 (21.4%) |
| $75,000 to $99,999 | 43 (18.5%) | 0 (0.0%) |
| $100,000 to $149,999 | 31 (13.4%) | 15 (35.7%) |
| $150,000 or more | 44 (19.0%) | 7 (16.7%) |
| Total | 232 (100.0%) | 42 (100.0%) |
Monthly Housing Cost Tiers in Trout Lake
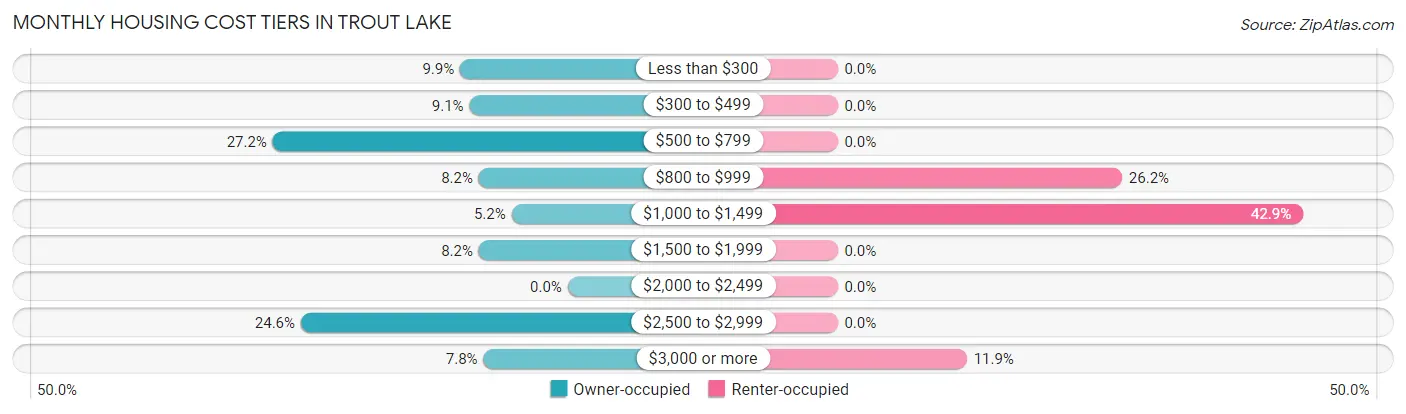
| Monthly Cost | Owner-occupied | Renter-occupied |
| Less than $300 | 23 (9.9%) | 0 (0.0%) |
| $300 to $499 | 21 (9.0%) | 0 (0.0%) |
| $500 to $799 | 63 (27.2%) | 0 (0.0%) |
| $800 to $999 | 19 (8.2%) | 11 (26.2%) |
| $1,000 to $1,499 | 12 (5.2%) | 18 (42.9%) |
| $1,500 to $1,999 | 19 (8.2%) | 0 (0.0%) |
| $2,000 to $2,499 | 0 (0.0%) | 0 (0.0%) |
| $2,500 to $2,999 | 57 (24.6%) | 0 (0.0%) |
| $3,000 or more | 18 (7.8%) | 5 (11.9%) |
| Total | 232 (100.0%) | 42 (100.0%) |
Physical Housing Characteristics in Trout Lake
Housing Structures in Trout Lake
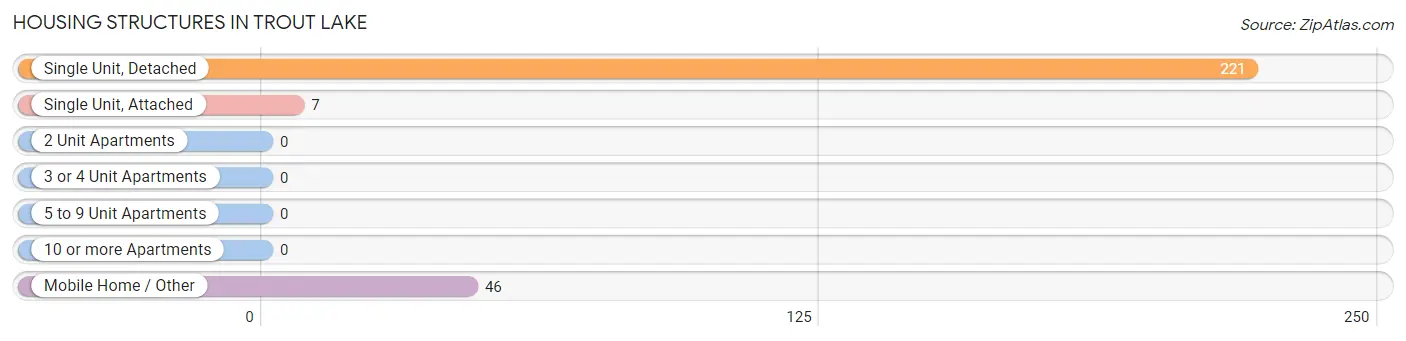
| Structure Type | # Housing Units | % Housing Units |
| Single Unit, Detached | 221 | 80.7% |
| Single Unit, Attached | 7 | 2.5% |
| 2 Unit Apartments | 0 | 0.0% |
| 3 or 4 Unit Apartments | 0 | 0.0% |
| 5 to 9 Unit Apartments | 0 | 0.0% |
| 10 or more Apartments | 0 | 0.0% |
| Mobile Home / Other | 46 | 16.8% |
| Total | 274 | 100.0% |
Housing Structures by Occupancy in Trout Lake
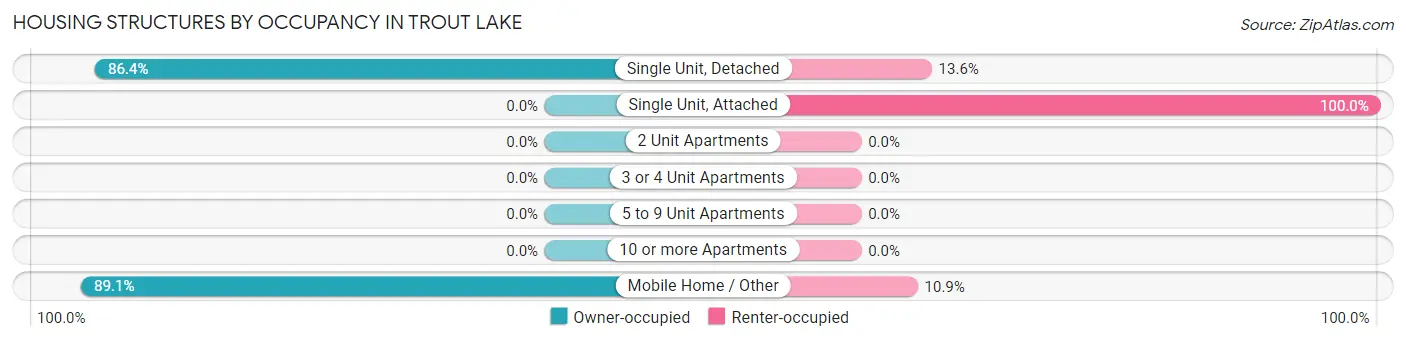
| Structure Type | Owner-occupied | Renter-occupied |
| Single Unit, Detached | 191 (86.4%) | 30 (13.6%) |
| Single Unit, Attached | 0 (0.0%) | 7 (100.0%) |
| 2 Unit Apartments | 0 (0.0%) | 0 (0.0%) |
| 3 or 4 Unit Apartments | 0 (0.0%) | 0 (0.0%) |
| 5 to 9 Unit Apartments | 0 (0.0%) | 0 (0.0%) |
| 10 or more Apartments | 0 (0.0%) | 0 (0.0%) |
| Mobile Home / Other | 41 (89.1%) | 5 (10.9%) |
| Total | 232 (84.7%) | 42 (15.3%) |
Housing Structures by Number of Rooms in Trout Lake
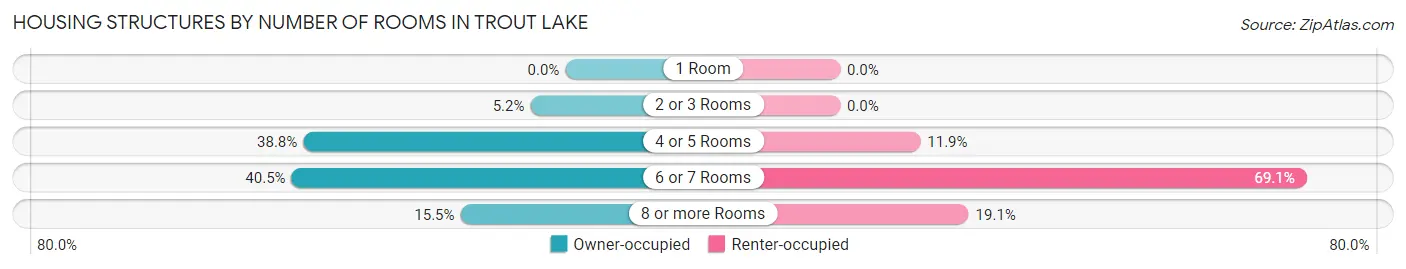
| Number of Rooms | Owner-occupied | Renter-occupied |
| 1 Room | 0 (0.0%) | 0 (0.0%) |
| 2 or 3 Rooms | 12 (5.2%) | 0 (0.0%) |
| 4 or 5 Rooms | 90 (38.8%) | 5 (11.9%) |
| 6 or 7 Rooms | 94 (40.5%) | 29 (69.1%) |
| 8 or more Rooms | 36 (15.5%) | 8 (19.1%) |
| Total | 232 (100.0%) | 42 (100.0%) |
Housing Structure by Heating Type in Trout Lake
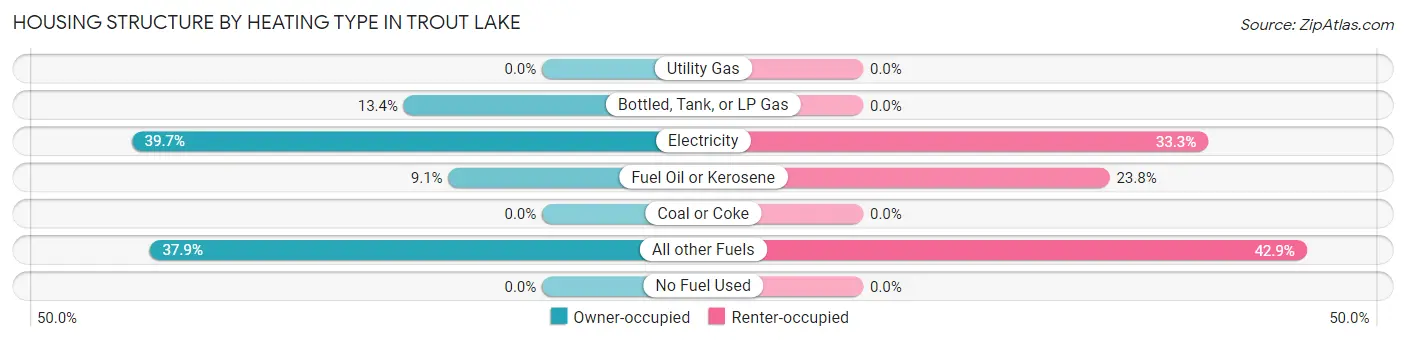
| Heating Type | Owner-occupied | Renter-occupied |
| Utility Gas | 0 (0.0%) | 0 (0.0%) |
| Bottled, Tank, or LP Gas | 31 (13.4%) | 0 (0.0%) |
| Electricity | 92 (39.7%) | 14 (33.3%) |
| Fuel Oil or Kerosene | 21 (9.0%) | 10 (23.8%) |
| Coal or Coke | 0 (0.0%) | 0 (0.0%) |
| All other Fuels | 88 (37.9%) | 18 (42.9%) |
| No Fuel Used | 0 (0.0%) | 0 (0.0%) |
| Total | 232 (100.0%) | 42 (100.0%) |
Household Vehicle Usage in Trout Lake
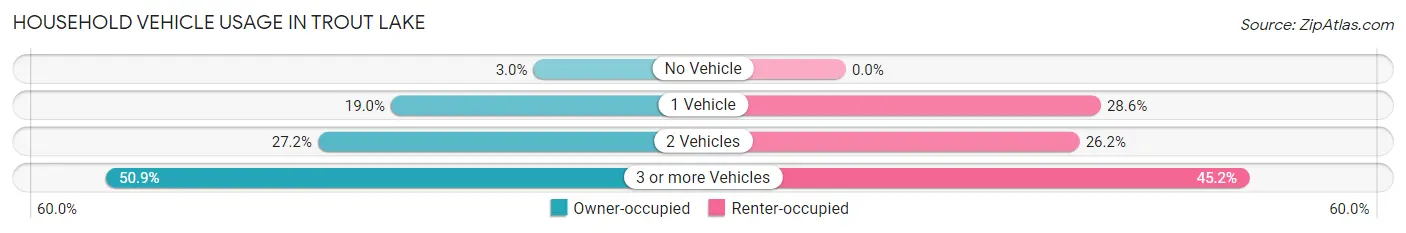
| Vehicles per Household | Owner-occupied | Renter-occupied |
| No Vehicle | 7 (3.0%) | 0 (0.0%) |
| 1 Vehicle | 44 (19.0%) | 12 (28.6%) |
| 2 Vehicles | 63 (27.2%) | 11 (26.2%) |
| 3 or more Vehicles | 118 (50.9%) | 19 (45.2%) |
| Total | 232 (100.0%) | 42 (100.0%) |
Real Estate & Mortgages in Trout Lake
Real Estate and Mortgage Overview in Trout Lake
| Characteristic | Without Mortgage | With Mortgage |
| Housing Units | 126 | 106 |
| Median Property Value | $583,300 | $754,600 |
| Median Household Income | $51,484 | $36 |
| Monthly Housing Costs | $538 | $18 |
| Real Estate Taxes | $2,750 | $0 |
Property Value by Mortgage Status in Trout Lake
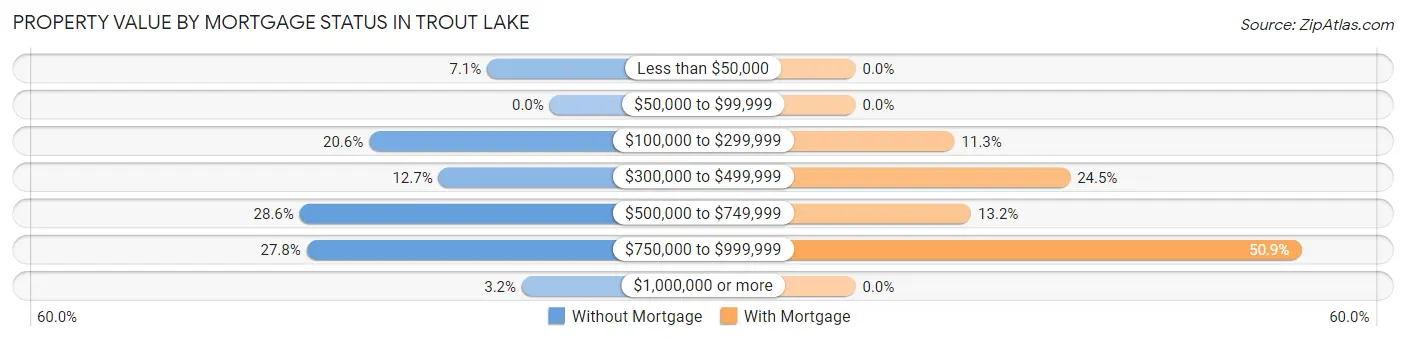
| Property Value | Without Mortgage | With Mortgage |
| Less than $50,000 | 9 (7.1%) | 0 (0.0%) |
| $50,000 to $99,999 | 0 (0.0%) | 0 (0.0%) |
| $100,000 to $299,999 | 26 (20.6%) | 12 (11.3%) |
| $300,000 to $499,999 | 16 (12.7%) | 26 (24.5%) |
| $500,000 to $749,999 | 36 (28.6%) | 14 (13.2%) |
| $750,000 to $999,999 | 35 (27.8%) | 54 (50.9%) |
| $1,000,000 or more | 4 (3.2%) | 0 (0.0%) |
| Total | 126 (100.0%) | 106 (100.0%) |
Household Income by Mortgage Status in Trout Lake
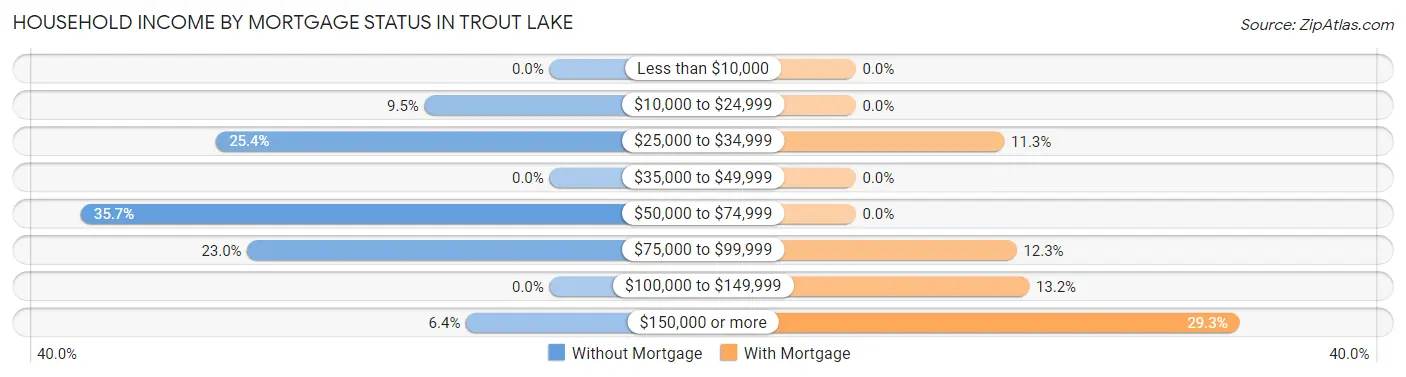
| Household Income | Without Mortgage | With Mortgage |
| Less than $10,000 | 0 (0.0%) | 0 (0.0%) |
| $10,000 to $24,999 | 12 (9.5%) | 0 (0.0%) |
| $25,000 to $34,999 | 32 (25.4%) | 12 (11.3%) |
| $35,000 to $49,999 | 0 (0.0%) | 0 (0.0%) |
| $50,000 to $74,999 | 45 (35.7%) | 0 (0.0%) |
| $75,000 to $99,999 | 29 (23.0%) | 13 (12.3%) |
| $100,000 to $149,999 | 0 (0.0%) | 14 (13.2%) |
| $150,000 or more | 8 (6.4%) | 31 (29.2%) |
| Total | 126 (100.0%) | 106 (100.0%) |
Property Value to Household Income Ratio in Trout Lake
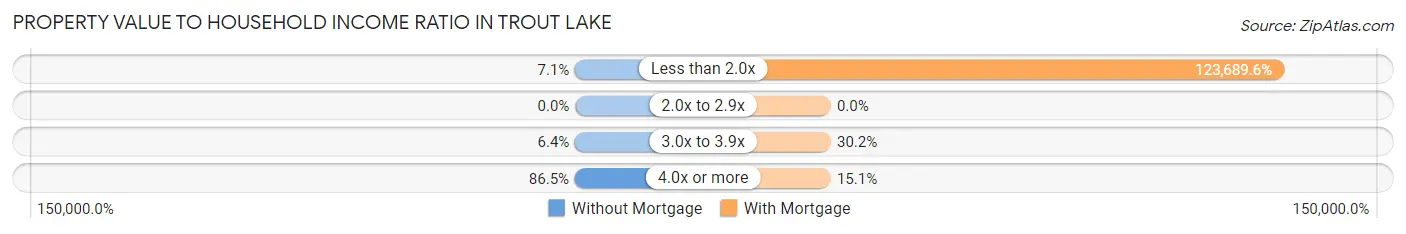
| Value-to-Income Ratio | Without Mortgage | With Mortgage |
| Less than 2.0x | 9 (7.1%) | 131,111 (123,689.6%) |
| 2.0x to 2.9x | 0 (0.0%) | 0 (0.0%) |
| 3.0x to 3.9x | 8 (6.4%) | 32 (30.2%) |
| 4.0x or more | 109 (86.5%) | 16 (15.1%) |
| Total | 126 (100.0%) | 106 (100.0%) |
Real Estate Taxes by Mortgage Status in Trout Lake
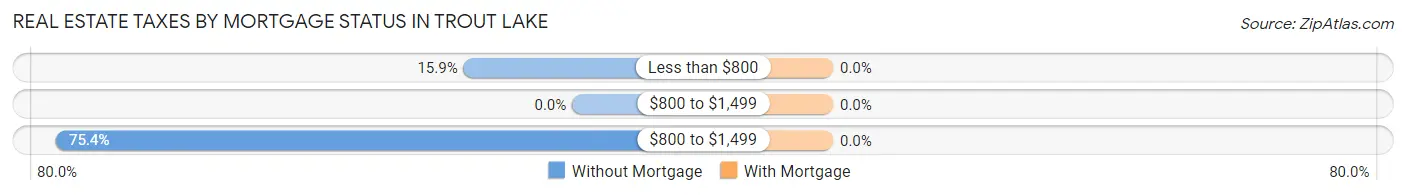
| Property Taxes | Without Mortgage | With Mortgage |
| Less than $800 | 20 (15.9%) | 0 (0.0%) |
| $800 to $1,499 | 0 (0.0%) | 0 (0.0%) |
| $800 to $1,499 | 95 (75.4%) | 0 (0.0%) |
| Total | 126 (100.0%) | 106 (100.0%) |
Health & Disability in Trout Lake
Health Insurance Coverage by Age in Trout Lake
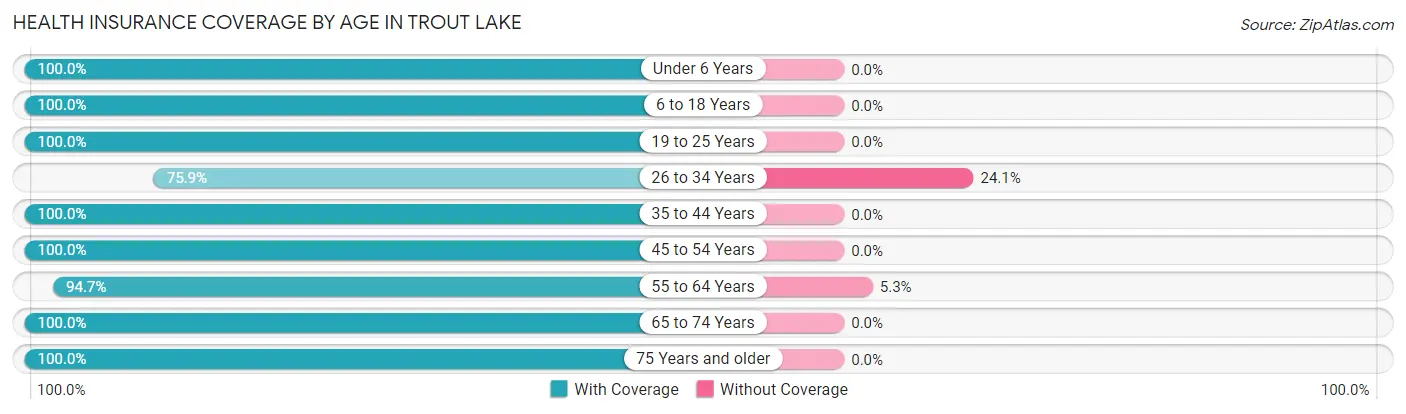
| Age Bracket | With Coverage | Without Coverage |
| Under 6 Years | 33 (100.0%) | 0 (0.0%) |
| 6 to 18 Years | 108 (100.0%) | 0 (0.0%) |
| 19 to 25 Years | 137 (100.0%) | 0 (0.0%) |
| 26 to 34 Years | 63 (75.9%) | 20 (24.1%) |
| 35 to 44 Years | 70 (100.0%) | 0 (0.0%) |
| 45 to 54 Years | 140 (100.0%) | 0 (0.0%) |
| 55 to 64 Years | 89 (94.7%) | 5 (5.3%) |
| 65 to 74 Years | 111 (100.0%) | 0 (0.0%) |
| 75 Years and older | 46 (100.0%) | 0 (0.0%) |
| Total | 797 (97.0%) | 25 (3.0%) |
Health Insurance Coverage by Citizenship Status in Trout Lake
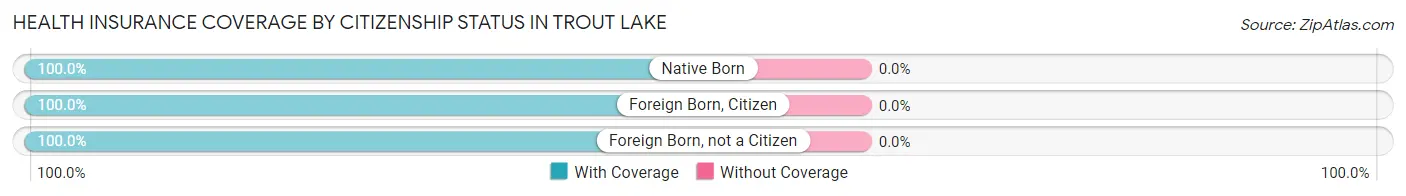
| Citizenship Status | With Coverage | Without Coverage |
| Native Born | 33 (100.0%) | 0 (0.0%) |
| Foreign Born, Citizen | 108 (100.0%) | 0 (0.0%) |
| Foreign Born, not a Citizen | 137 (100.0%) | 0 (0.0%) |
Health Insurance Coverage by Household Income in Trout Lake
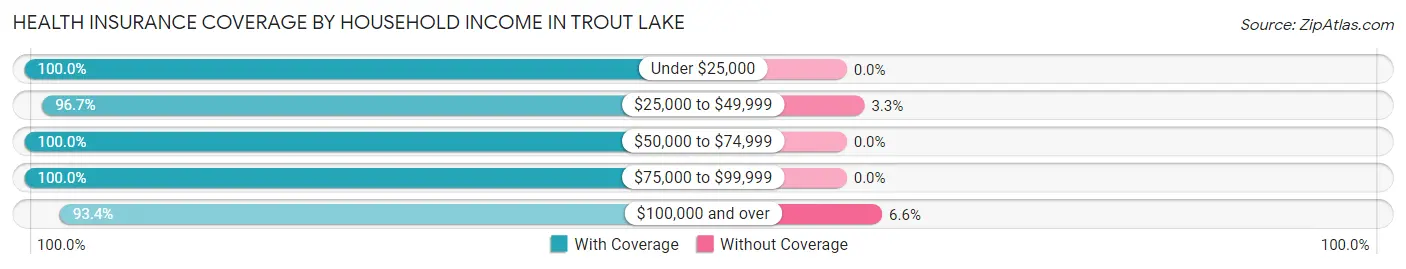
| Household Income | With Coverage | Without Coverage |
| Under $25,000 | 65 (100.0%) | 0 (0.0%) |
| $25,000 to $49,999 | 146 (96.7%) | 5 (3.3%) |
| $50,000 to $74,999 | 140 (100.0%) | 0 (0.0%) |
| $75,000 to $99,999 | 164 (100.0%) | 0 (0.0%) |
| $100,000 and over | 282 (93.4%) | 20 (6.6%) |
Public vs Private Health Insurance Coverage by Age in Trout Lake
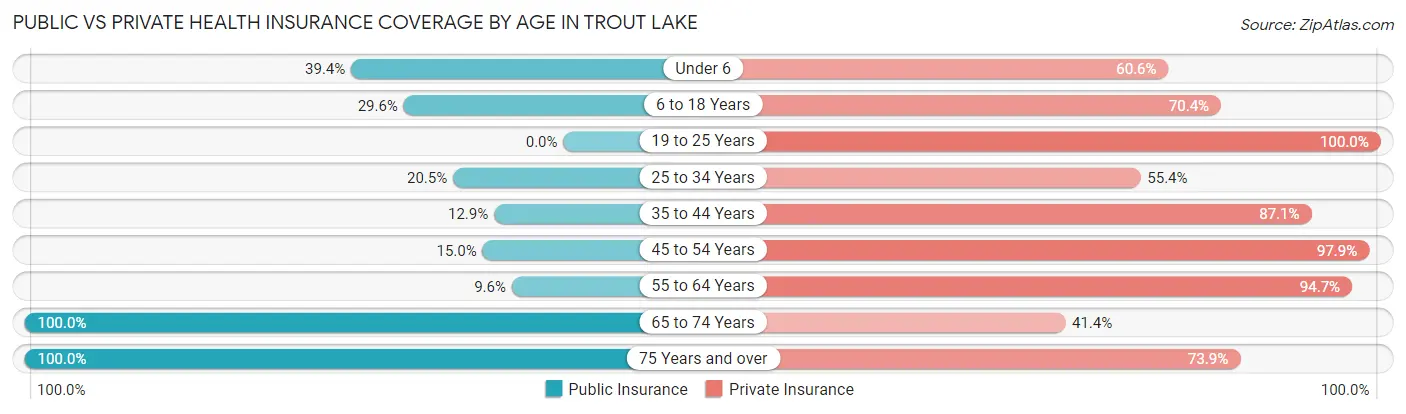
| Age Bracket | Public Insurance | Private Insurance |
| Under 6 | 13 (39.4%) | 20 (60.6%) |
| 6 to 18 Years | 32 (29.6%) | 76 (70.4%) |
| 19 to 25 Years | 0 (0.0%) | 137 (100.0%) |
| 25 to 34 Years | 17 (20.5%) | 46 (55.4%) |
| 35 to 44 Years | 9 (12.9%) | 61 (87.1%) |
| 45 to 54 Years | 21 (15.0%) | 137 (97.9%) |
| 55 to 64 Years | 9 (9.6%) | 89 (94.7%) |
| 65 to 74 Years | 111 (100.0%) | 46 (41.4%) |
| 75 Years and over | 46 (100.0%) | 34 (73.9%) |
| Total | 258 (31.4%) | 646 (78.6%) |
Disability Status by Sex by Age in Trout Lake
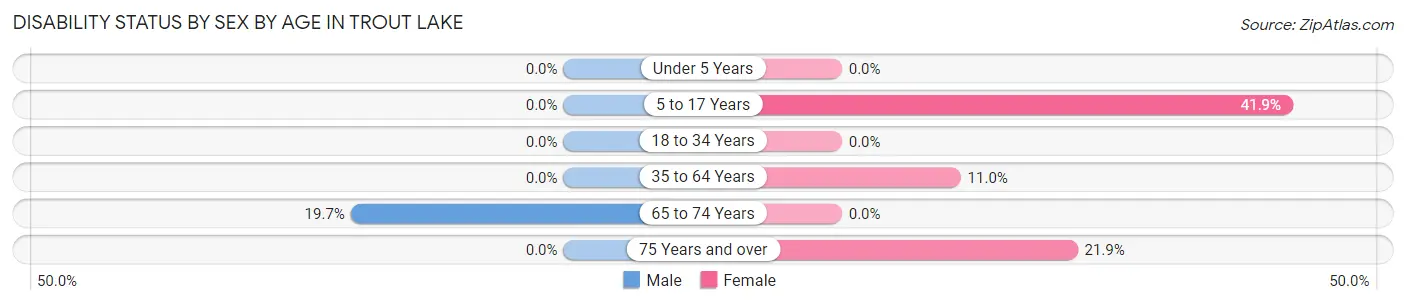
| Age Bracket | Male | Female |
| Under 5 Years | 0 (0.0%) | 0 (0.0%) |
| 5 to 17 Years | 0 (0.0%) | 18 (41.9%) |
| 18 to 34 Years | 0 (0.0%) | 0 (0.0%) |
| 35 to 64 Years | 0 (0.0%) | 15 (11.0%) |
| 65 to 74 Years | 15 (19.7%) | 0 (0.0%) |
| 75 Years and over | 0 (0.0%) | 7 (21.9%) |
Disability Class by Sex by Age in Trout Lake
Disability Class: Hearing Difficulty
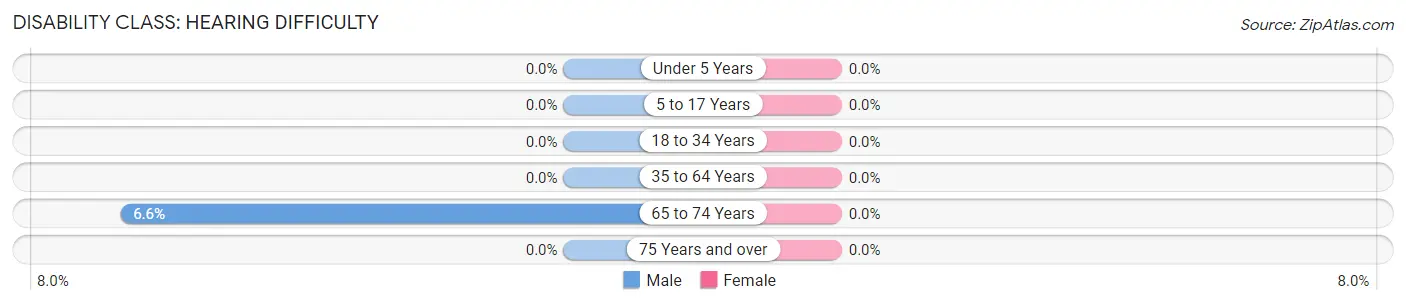
| Age Bracket | Male | Female |
| Under 5 Years | 0 (0.0%) | 0 (0.0%) |
| 5 to 17 Years | 0 (0.0%) | 0 (0.0%) |
| 18 to 34 Years | 0 (0.0%) | 0 (0.0%) |
| 35 to 64 Years | 0 (0.0%) | 0 (0.0%) |
| 65 to 74 Years | 5 (6.6%) | 0 (0.0%) |
| 75 Years and over | 0 (0.0%) | 0 (0.0%) |
Disability Class: Vision Difficulty
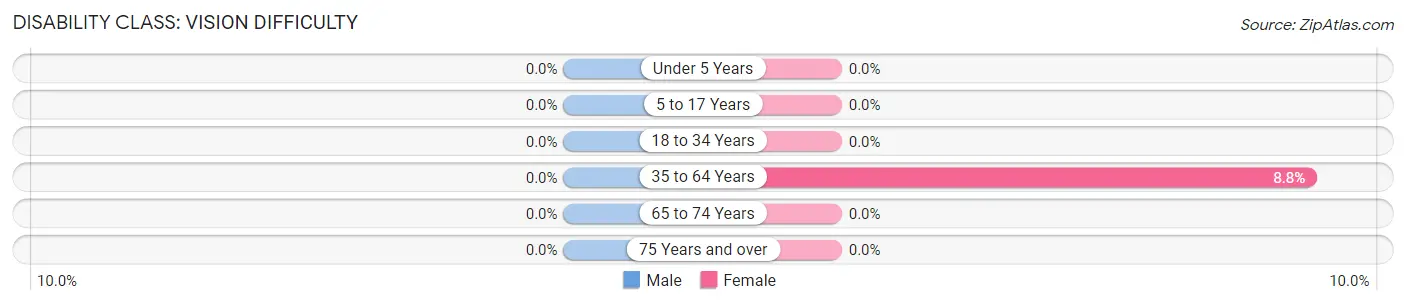
| Age Bracket | Male | Female |
| Under 5 Years | 0 (0.0%) | 0 (0.0%) |
| 5 to 17 Years | 0 (0.0%) | 0 (0.0%) |
| 18 to 34 Years | 0 (0.0%) | 0 (0.0%) |
| 35 to 64 Years | 0 (0.0%) | 12 (8.8%) |
| 65 to 74 Years | 0 (0.0%) | 0 (0.0%) |
| 75 Years and over | 0 (0.0%) | 0 (0.0%) |
Disability Class: Cognitive Difficulty
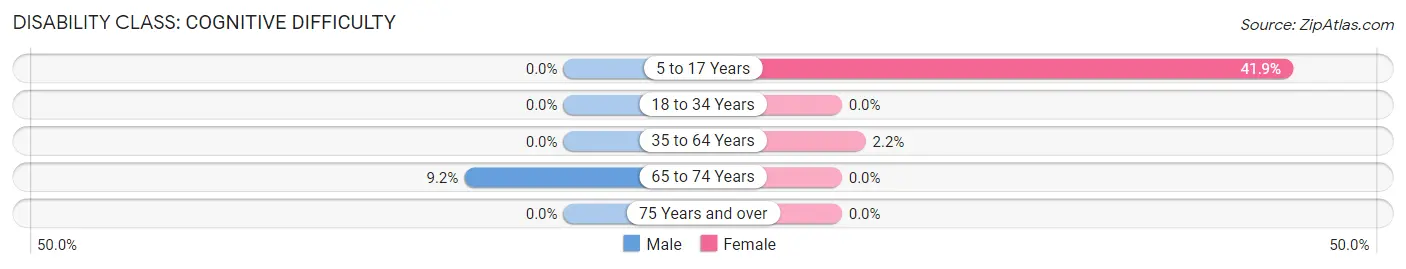
| Age Bracket | Male | Female |
| 5 to 17 Years | 0 (0.0%) | 18 (41.9%) |
| 18 to 34 Years | 0 (0.0%) | 0 (0.0%) |
| 35 to 64 Years | 0 (0.0%) | 3 (2.2%) |
| 65 to 74 Years | 7 (9.2%) | 0 (0.0%) |
| 75 Years and over | 0 (0.0%) | 0 (0.0%) |
Disability Class: Ambulatory Difficulty
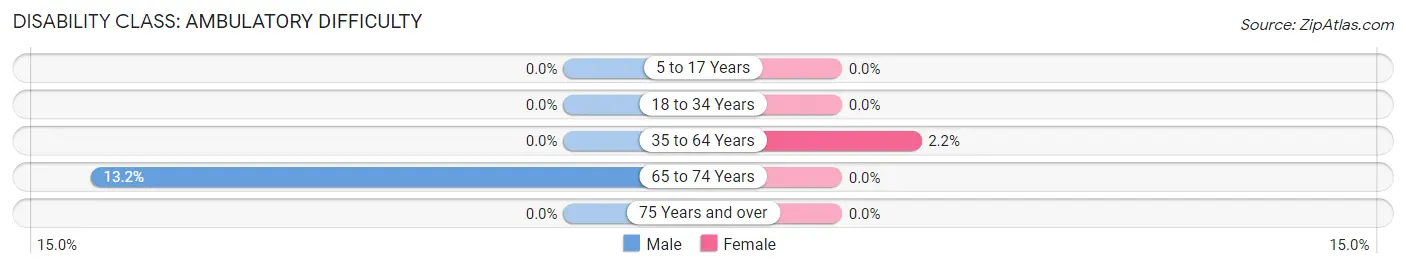
| Age Bracket | Male | Female |
| 5 to 17 Years | 0 (0.0%) | 0 (0.0%) |
| 18 to 34 Years | 0 (0.0%) | 0 (0.0%) |
| 35 to 64 Years | 0 (0.0%) | 3 (2.2%) |
| 65 to 74 Years | 10 (13.2%) | 0 (0.0%) |
| 75 Years and over | 0 (0.0%) | 0 (0.0%) |
Disability Class: Self-Care Difficulty
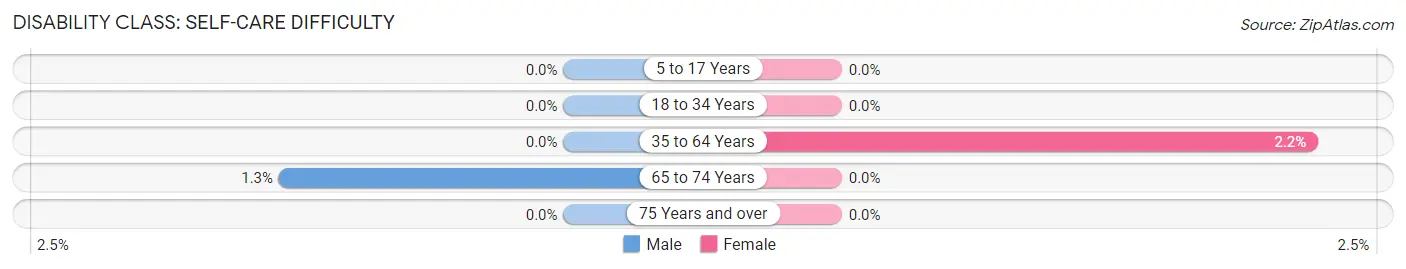
| Age Bracket | Male | Female |
| 5 to 17 Years | 0 (0.0%) | 0 (0.0%) |
| 18 to 34 Years | 0 (0.0%) | 0 (0.0%) |
| 35 to 64 Years | 0 (0.0%) | 3 (2.2%) |
| 65 to 74 Years | 1 (1.3%) | 0 (0.0%) |
| 75 Years and over | 0 (0.0%) | 0 (0.0%) |
Technology Access in Trout Lake
Computing Device Access in Trout Lake
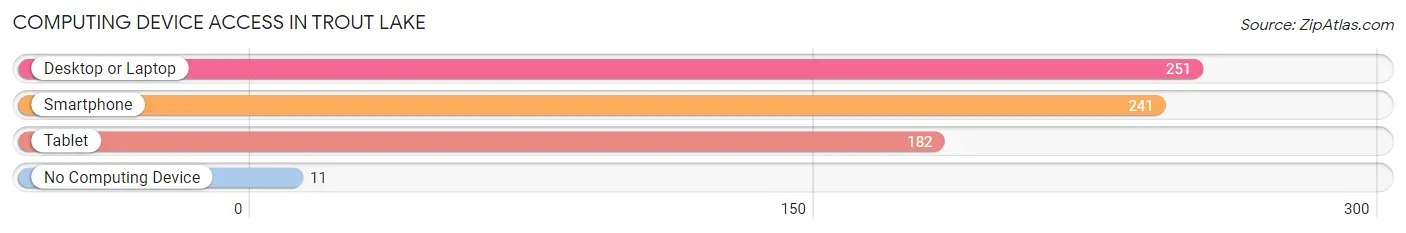
| Device Type | # Households | % Households |
| Desktop or Laptop | 251 | 91.6% |
| Smartphone | 241 | 88.0% |
| Tablet | 182 | 66.4% |
| No Computing Device | 11 | 4.0% |
| Total | 274 | 100.0% |
Internet Access in Trout Lake
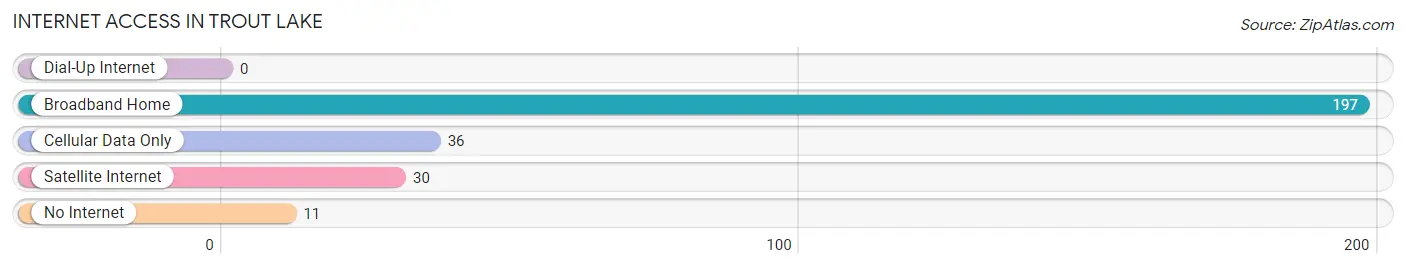
| Internet Type | # Households | % Households |
| Dial-Up Internet | 0 | 0.0% |
| Broadband Home | 197 | 71.9% |
| Cellular Data Only | 36 | 13.1% |
| Satellite Internet | 30 | 11.0% |
| No Internet | 11 | 4.0% |
| Total | 274 | 100.0% |
Trout Lake Summary
Trout Lake is a small unincorporated community located in Klickitat County, Washington, United States. It is situated in the Cascade Mountains, approximately 20 miles east of Mount Adams and 40 miles northeast of Mount St. Helens. The population of Trout Lake was estimated to be around 200 people in 2020.
History
Trout Lake was first settled in the late 1800s by homesteaders who were attracted to the area by its abundance of fish and game. The first post office was established in 1891 and the town was officially incorporated in 1909. The town was named after the nearby Trout Lake, which was stocked with trout by the Washington State Fish and Game Commission in the early 1900s.
Trout Lake was a popular destination for tourists in the early 1900s, and the town was home to several resorts, including the Trout Lake Hotel, which was built in 1910. The hotel was destroyed by a fire in the 1950s, but the town continued to attract visitors due to its proximity to Mount Adams and Mount St. Helens.
Geography
Trout Lake is located in the Cascade Mountains of Washington State, approximately 20 miles east of Mount Adams and 40 miles northeast of Mount St. Helens. The town is situated at an elevation of 2,400 feet and is surrounded by the Gifford Pinchot National Forest. The town is located on the south shore of Trout Lake, which is a popular destination for fishing and camping.
The climate in Trout Lake is generally mild, with temperatures ranging from the mid-30s in the winter to the mid-80s in the summer. The area receives an average of 40 inches of precipitation annually, with most of it falling in the form of snow in the winter months.
Economy
Trout Lake is a small, rural community with a limited economy. The town is home to several small businesses, including a general store, a cafe, and a gas station. The town is also home to a small sawmill, which provides employment for a handful of local residents.
The town is also home to several tourist attractions, including the Trout Lake Hotel, which was destroyed by a fire in the 1950s. The town is also home to several campgrounds, which attract visitors from around the region.
Demographics
Trout Lake is a small, rural community with a population of approximately 200 people. The town is predominantly white, with a small Hispanic population. The median household income in Trout Lake is $35,000, and the median home value is $150,000. The town has a high rate of poverty, with nearly 20% of the population living below the poverty line.
Conclusion
Trout Lake is a small, rural community located in the Cascade Mountains of Washington State. The town is home to a small population of approximately 200 people and is home to several small businesses and tourist attractions. The town has a mild climate and is a popular destination for fishing and camping. The town has a high rate of poverty, with nearly 20% of the population living below the poverty line.
Common Questions
What is Per Capita Income in Trout Lake?
Per Capita income in Trout Lake is $34,100.
What is the Median Family Income in Trout Lake?
Median Family Income in Trout Lake is $79,643.
What is the Median Household income in Trout Lake?
Median Household Income in Trout Lake is $76,875.
What is Income or Wage Gap in Trout Lake?
Income or Wage Gap in Trout Lake is 45.8%.
Women in Trout Lake earn 54.2 cents for every dollar earned by a man.
What is Inequality or Gini Index in Trout Lake?
Inequality or Gini Index in Trout Lake is 0.41.
What is the Total Population of Trout Lake?
Total Population of Trout Lake is 822.
What is the Total Male Population of Trout Lake?
Total Male Population of Trout Lake is 487.
What is the Total Female Population of Trout Lake?
Total Female Population of Trout Lake is 335.
What is the Ratio of Males per 100 Females in Trout Lake?
There are 145.37 Males per 100 Females in Trout Lake.
What is the Ratio of Females per 100 Males in Trout Lake?
There are 68.79 Females per 100 Males in Trout Lake.
What is the Median Population Age in Trout Lake?
Median Population Age in Trout Lake is 43.4 Years.
What is the Average Family Size in Trout Lake
Average Family Size in Trout Lake is 3.4 People.
What is the Average Household Size in Trout Lake
Average Household Size in Trout Lake is 3.0 People.
How Large is the Labor Force in Trout Lake?
There are 516 People in the Labor Forcein in Trout Lake.
What is the Percentage of People in the Labor Force in Trout Lake?
74.0% of People are in the Labor Force in Trout Lake.
What is the Unemployment Rate in Trout Lake?
Unemployment Rate in Trout Lake is 0.8%.