Zip Codes with the Highest Percentage of Population Employed in Administrative & Support Services in San Angelo, TX
RELATED REPORTS & OPTIONS
Administrative & Support Services
San Angelo
Compare Zip Codes
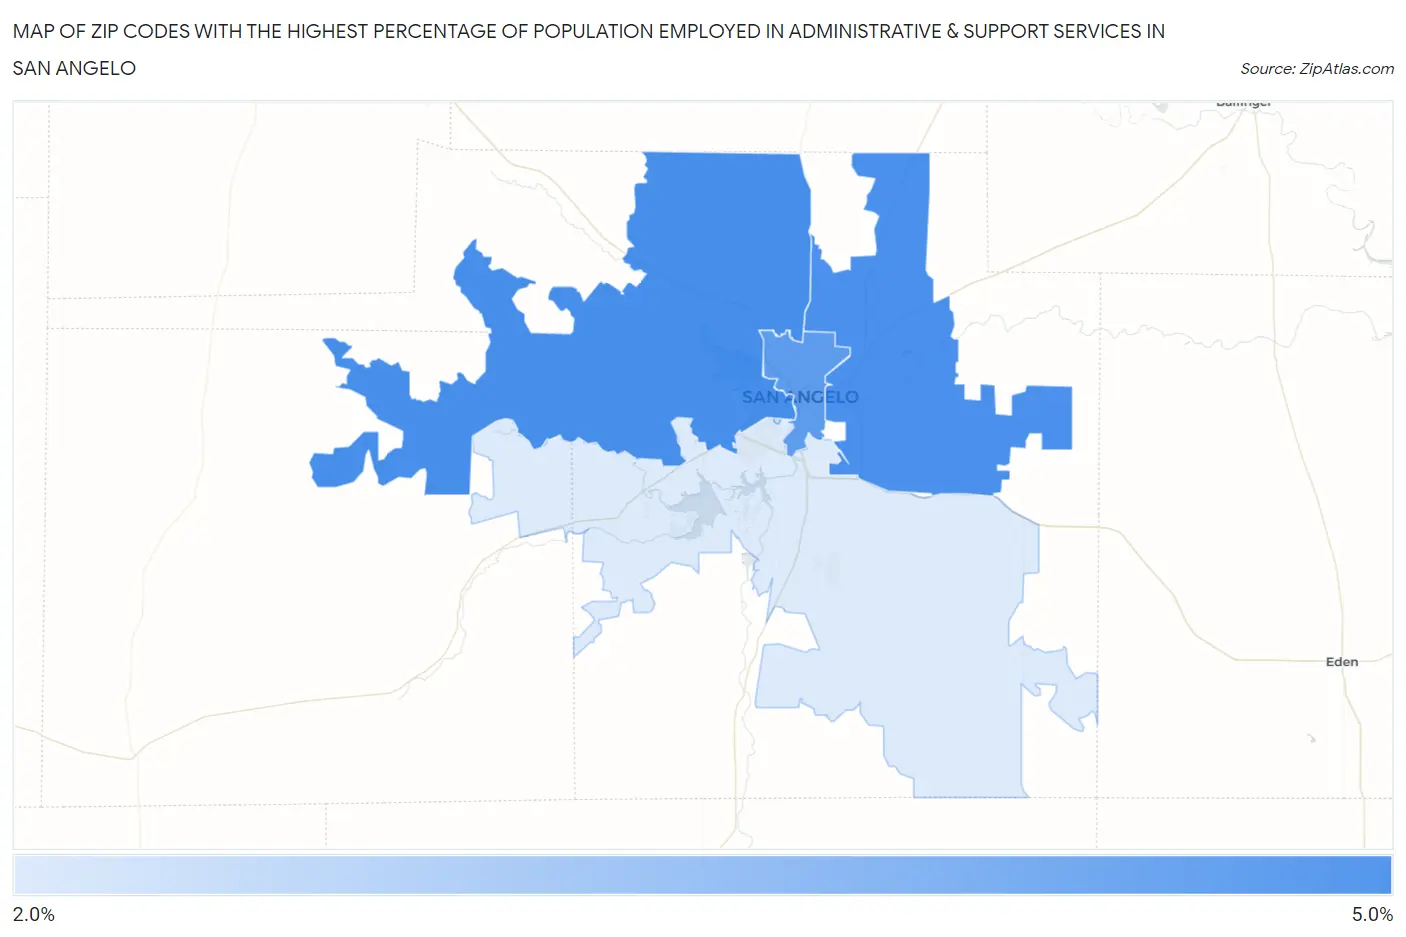
Map of Zip Codes with the Highest Percentage of Population Employed in Administrative & Support Services in San Angelo
2.9%
4.2%
Zip Codes with the Highest Percentage of Population Employed in Administrative & Support Services in San Angelo, TX
| Zip Code | % Employed | vs State | vs National | |
| 1. | 76901 | 4.2% | 4.4%(-0.226)#697 | 4.1%(+0.040)#9,864 |
| 2. | 76905 | 4.2% | 4.4%(-0.243)#705 | 4.1%(+0.024)#9,952 |
| 3. | 76903 | 4.0% | 4.4%(-0.428)#747 | 4.1%(-0.161)#10,751 |
| 4. | 76904 | 2.9% | 4.4%(-1.49)#1,057 | 4.1%(-1.22)#15,848 |
1
Common Questions
What are the Top 3 Zip Codes with the Highest Percentage of Population Employed in Administrative & Support Services in San Angelo, TX?
Top 3 Zip Codes with the Highest Percentage of Population Employed in Administrative & Support Services in San Angelo, TX are:
What zip code has the Highest Percentage of Population Employed in Administrative & Support Services in San Angelo, TX?
76901 has the Highest Percentage of Population Employed in Administrative & Support Services in San Angelo, TX with 4.2%.
What is the Percentage of Population Employed in Administrative & Support Services in San Angelo, TX?
Percentage of Population Employed in Administrative & Support Services in San Angelo is 3.9%.
What is the Percentage of Population Employed in Administrative & Support Services in Texas?
Percentage of Population Employed in Administrative & Support Services in Texas is 4.4%.
What is the Percentage of Population Employed in Administrative & Support Services in the United States?
Percentage of Population Employed in Administrative & Support Services in the United States is 4.1%.